
Forma parte de Ejemplos de presentaciones para inversores · Ejemplos de presentaciones para inversores de la India
Jindal Steel Ltd. (erstwhile Jindal Steel & Power Ltd., NSE: JINDALSTEL) Q2 FY27 earnings presentation dated 23 Oct 2026, filed with BSE and NSE: in the quarter the company reported gross revenue of INR 19,448 cr, adjusted EBITDA of INR 2,504 cr, PAT of INR 771 cr, steel production of 2.40 MT, sales of 2.38 MT and net debt to EBITDA of 1.51x, in a clean corporate-IR design with a saffron, green and slate-blue palette and geometric border motifs
Usa la portada de esta presentación como referencia de estilo para diapositivas creadas con tu propio contenido. O elige cualquier página de abajo para usar su diseño como referencia.
Navegación Rápida
Etiquetas
Compartir las diapositivas
Jindal Steel Ltd. (erstwhile Jindal Steel & Power Ltd., NSE: JINDALSTEL) Q2 FY27 earnings presentation dated 23 Oct 2026, filed with BSE and NSE: in the quarter the company reported gross revenue of INR 19,448 cr, adjusted EBITDA of INR 2,504 cr, PAT of INR 771 cr, steel production of 2.40 MT, sales of 2.38 MT and net debt to EBITDA of 1.51x, in a clean corporate-IR design with a saffron, green and slate-blue palette and geometric border motifs
Vista detallada de cada página de diapositiva, incluyendo diseño, contenido clave y elementos visuales.
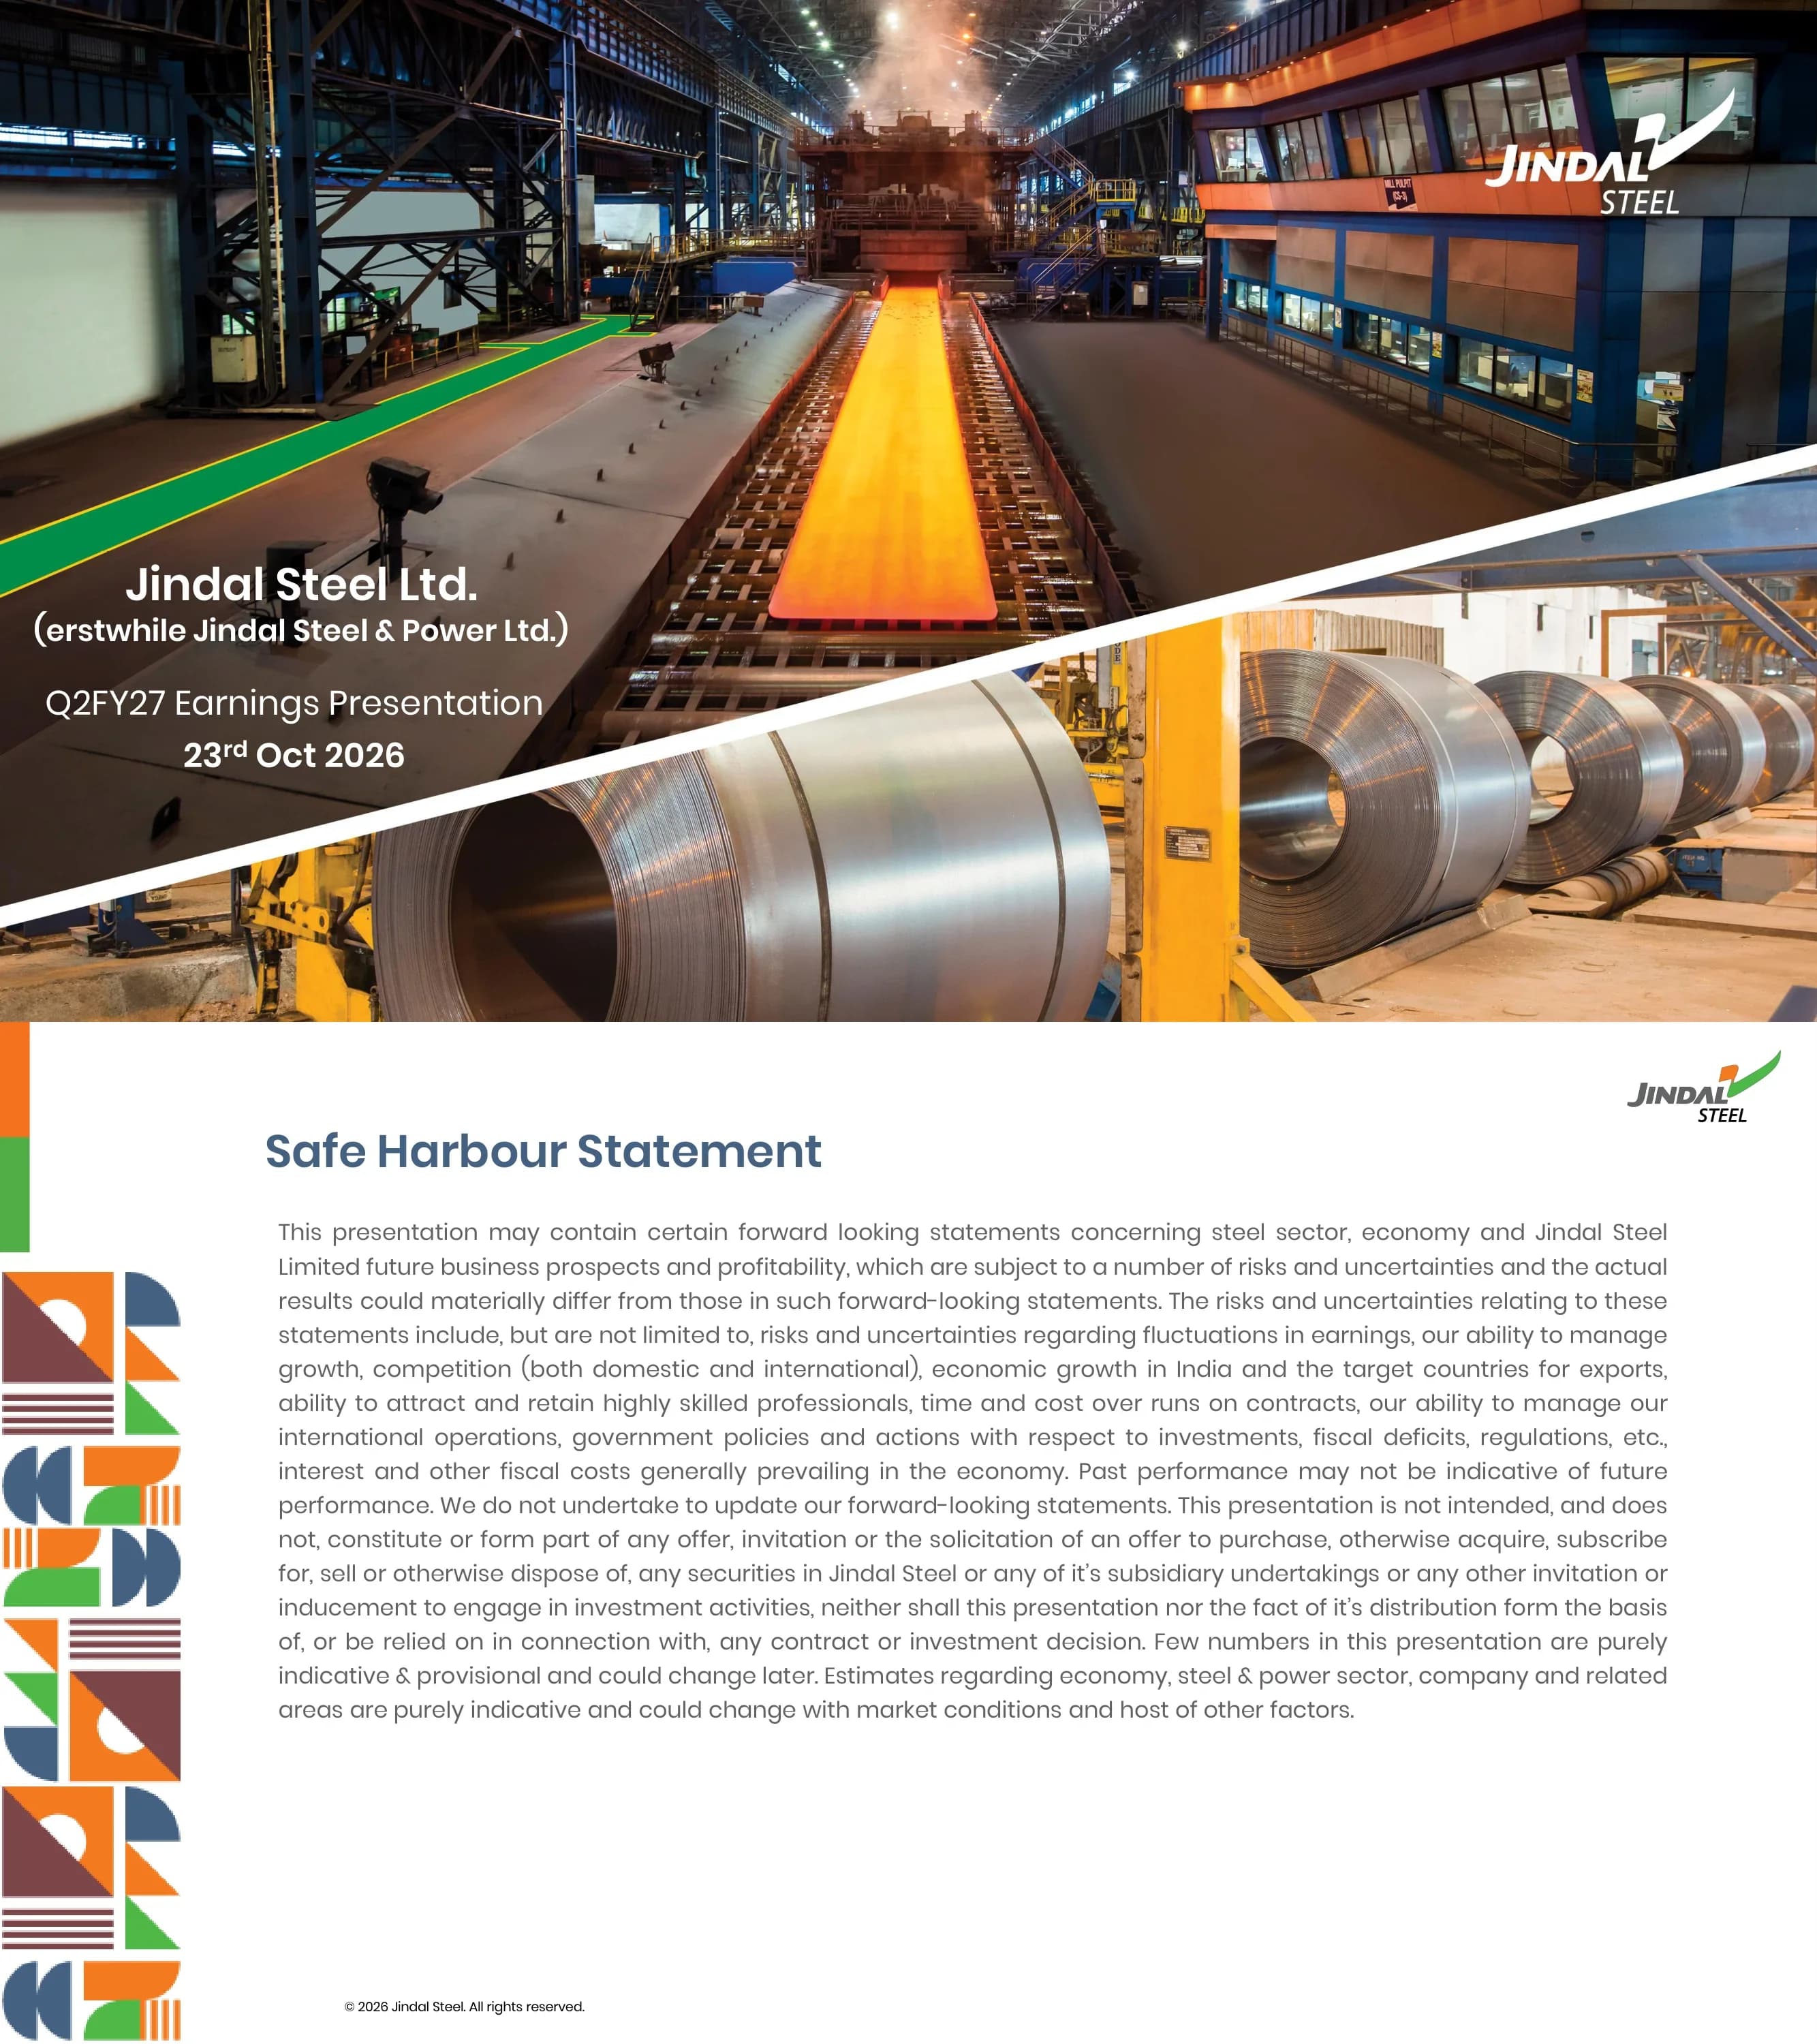
Cover slide naming Jindal Steel Ltd. (erstwhile Jindal Steel & Power Ltd.), the Q2FY27 Earnings Presentation and the date 23rd Oct 2026.
Full-bleed photo split by a diagonal white band; title text in white at lower left, company logo at upper right.
Standard forward-looking statement warning that actual results may differ materially, that the deck is not an offer of securities, and that some numbers are indicative and provisional.
Single justified text block under a slate-blue title, with a vertical column of geometric tiles down the left edge and logo at top right.
Four pillars: Growth Focussed (integrated capacity, value-added products), Strong Financials (liquidity of INR 7,237 cr, Net Debt/EBITDA 1.51x, exchequer contribution over 3x PAT), Sustainability Driven (world's first and largest coal gasification plant for steel-making, 192 km slurry pipeline, 14.6 million+ lives impacted) and Industry 4.0 & AI.
Four equal cards, each with a photo on top, a slate-blue header bar and green-highlighted bullet points; multicolour title with 'Nation' in orange and 'Dreams' in green.
Capacity from iron ore to finished steel: iron ore 10.61 to 13.61 MTPA, iron making 10.42 to 17.02 MTPA (DRI 3.12 to 5.12, blast furnace 7.30 to 11.90), liquid steel 9.60 to 15.60 MTPA and finished steel 7.25 to 13.75 MTPA, with commissioned capacity ticked. Lists mines (Tensa, Kasia, Roida-I, Gare Palma IV/6, Utkal C, Utkal B1 & B2, Mozambique, South Africa) and mills (plate, hot strip, cold roll, RUBM, bar rod, special profiling, wire rod).
Four-stage horizontal value chain with slate-blue headers; large orange target figures, small orange baseline tags, curved arrows and detail panels below, footnotes at bottom.
Six KPI tiles: gross revenue INR 19,448 cr, adjusted EBITDA 2,504 cr, PAT INR 771 cr, production 2.40 MT, sales 2.38 MT and net debt to EBITDA 1.51x. Other highlights: 18 MTPA iron ore slurry pipeline commissioned, Guinness World Record steel slag road, IIT Hyderabad Centre of Excellence partnership, and the World Steel Association 2026 Steelie Award for Excellence in People (Dakshata safety initiative).
2x3 grid of tan KPI tiles with white text above a slate-blue 'Other key highlights' bar and four bullet lines; notes at bottom left.
Jindal Steel was awarded the Guinness World Record for the world's longest road built exclusively with processed steel slag, developed with CSIR-CRRI in Raigarh. Callout of 1.85 km road length and the message that circularity can move beyond the plant to everyday infrastructure.
Left two-thirds photo collage (road banner, framed certificate, award ceremony); right column with an orange-tinted text box, circular 1.85 km badge and a green-tinted conclusion box.
World Steel Association Short Range Outlook (Oct 2026) in six panels, steel demand in MT for CY25, CY26E and CY27E: World 1,724 / 1,722 / 1,752; China 796 / 780 / 772; India 160 / 172 / 186 with 8% growth each year; USA 91 / 93 / 94; EU & UK 147 / 146 / 151; Japan 48 / 48 / 49. Takeaway: India is the fastest growing major steel market.
2x3 grid of combo charts (bars for demand, green line for YoY growth) with the India panel highlighted in blue and framed; summary banner beneath.
India data (Source: JPC) for Q2FY26, Q1FY27, Q2FY27 and H1: crude steel production 41.6 / 42.1 / 43.0 mt (H1 82.5 to 85.1); finished steel production 40.0 / 40.6 / 41.2 mt; consumption 40.5 / 41.6 / 43.4 mt (H1 78.9 to 84.9); exports 1.6 / 1.6 / 2.0 mt; imports 2.0 / 2.1 / 2.1 mt. India drew down about 2 MT of inventory and remained a net importer (0.1 MT) for the third consecutive quarter.
Five bar charts with percentage-change bracket callouts plus a text box of three bullets at lower right; banner at bottom.
Price tables and trend lines. HRC domestic Mumbai INR 49,525 / 58,627 / 59,669 per t (Q2FY26 / Q1FY27 / Q2FY27) and export FOB 45,734 / 55,213 / 51,542; premium HCC Australia USD 200 / 261 / 269 per t; rebar Mumbai 47,977 / 57,115 / 53,594; iron ore fines 5,335 / 5,354 / 5,042 and lumps 7,504 / 7,412 / 7,138 INR/t. HRC premium to TMT at INR 1,700 per t.
Five chart-and-table panels with orange ovals marking recent periods plus a commentary box; takeaway banner at bottom, sources cited.
Crude steel production 2.00 / 2.40 / 2.40 mt (+20% YoY, 0% QoQ; H1 4.09 to 4.79). Sales 1.87 / 2.23 / 2.38 mt (+27% YoY, +6% QoQ; H1 3.78 to 4.61). Domestic sales 1.69 / 2.03 / 2.19 mt; exports 0.18 / 0.21 / 0.19 mt. Share of flats rose to 61% in Q2FY27 versus 50% a year earlier.
2x2 grid of bar charts with growth bracket callouts; share-of-flats and share-of-exports strips above two charts; banner at bottom.
Sector-wise sales mix: infrastructure 35% / 31% / 25%, distribution 32% / 29% / 27%, engineering & packaging 11% / 19% / 26%, building & construction 19% / 18% / 17%, automotive 3% / 3% / 4%. TMT sales split into retail and project, with dealers growing from 5,003 to 6,010 and TMT volumes shown as 451, 528 and 356 thousand tonnes.
Two side-by-side stacked bar charts across Q2FY26, Q1FY27 and Q2FY27 with legends underneath; summary banner at bottom.
Six marquee projects supplied with steel: Adani Connex Data Center (Gujarat), Versova Bandra Sea-Link Road (Maharashtra), Amaravati Secretariat (Andhra Pradesh), Project Varsha (Andhra Pradesh), Nuclear Power Plant - Gorakhpur (Uttar Pradesh) and High Speed Rail (Gujarat & Maharashtra).
2x3 grid of white cards, each with a photo, bold project name and state name.
JARVIS (Jindal AI for Real time Visibility, Intelligence & Systems) is one governed platform for data, workflows and AI agents. Employee productivity: Employee Assistant, Dashboard Builder Agent, Smart Presentation. Business execution: Sales, Procurement, HR, Finance, CEO and Dakshata agents. Plant performance: Grid Monitoring Dashboard and Plant Stock Track.
Three numbered cards with orange, green and grey header bars, a description, bullets or a 2x3 grid of agent tiles and a category pill at the bottom; banner below.
Four priority areas with outcomes: Production performance (lean planning, sales-order automation, Smart Mines; higher throughput and improved yield), Plant and logistics (Integrated Smart Port, smart logistics planning, GPS-enabled road and rail; lower logistics cost), Commercial and functions (intelligent procurement, Smart Recruitment HR Agent, simplified payroll; faster service) and Workforce and resilience (Jindal Suraksha Kavach, security command center, SAP disaster recovery).
Four equal columns, each with a circular icon, colored title pill, three bullets and a tinted outcome box.
Four Q2 initiatives: Logistics resilience (Barbil-Angul 192 km slurry pipeline, 18 MTPA), Circularity at scale (1.85 km four-lane steel slag road), Proactive safety (Suraksha Kavach smartwatch with SOS, danger-zone and fall alerts) and Clean energy innovation (SmartFlower at Angul, 2.5 kWp with up to 40% higher yield than fixed-tilt).
Four vertical cards with photo, colored label pill, bold subtitle, colored highlight and description; slate-blue summary banner and footnote.
CSR reach: ~1.2 million drinking water and sanitation beneficiaries, ~5.5 lacs community members benefited, ~2.1 lacs rural infrastructure beneficiaries, 2 lacs+ health and nutrition beneficiaries, ~50k students supported through education, 1,000+ artists and community members supported, 900+ sports players served and 500+ students in skill development.
Left two-thirds: 2x4 grid of stat cards with colored number tiles; right third: 2x2 photo grid of community activities.
Timeline of CSR and sustainability awards from 2019 to 2026 YTD, including Golden Peacock CSR Award (2019, 2024), FICCI CSR Award (2022; 21st FICCI CSR Award in 2025), CSR Journal Excellence Award (2023, 2024) and a long 2025 list. 2026 awards include CSR Universe Award for women and child development, GEEF Global Water Tech Award and the World Steel Association Steelie Award for Excellence in People (Dakshata).
Horizontal timeline with green year labels above and below the axis, boxed award lists, orange boxes for 2026 and photos with a trophy at lower right.
Gross revenue INR 19,448 cr (Q1FY27 17,834; Q2FY26 13,505); adjusted EBITDA INR 2,504 cr (2,667; 1,875); adjusted EBITDA per ton INR 10,529 (11,937; 10,010); PAT INR 771 cr (844; 635); production 2.40 MT; sales 2.38 MT; net debt INR 14,786 cr (15,927; 14,156); net debt to EBITDA 1.51x (1.71x; 1.48x). Adjusted for FX gain of INR 68 cr.
Two rows of four gradient tiles (orange row for P&L, green row for volumes and debt) with prior-period comparisons beneath each tile.
Table in INR cr for Q2FY27 / Q1FY27 / Q2FY26 / H1FY27 / H1FY26: gross revenue 19,448 / 17,834 / 13,505 / 37,282 / 27,841; net revenue 16,704 / 15,501 / 11,708 / 32,205 / 24,033; adjusted EBITDA 2,504 / 2,667 / 1,875 / 5,171 / 4,859; depreciation 947 / 926 / 750 / 1,873 / 1,471; finance cost 566 / 548 / 371 / 1,114 / 668; PBT 1,084 / 1,205 / 982 / 2,288 / 3,000; PAT 771 / 844 / 635 / 1,614 / 2,131.
Clean financial table with Quarterly and Half Yearly column groups; Q2FY27 and H1FY27 columns highlighted in slate blue; footnotes below.
Volumes: production stable despite monsoon, sales up QoQ on inventory liquidation. Revenue/ASP: net revenue up QoQ on higher sales volume and ASP, helped by higher share of flats. Costs: raw material up on higher coking coal cost; other operating costs up on power, fuel and freight. Finance and depreciation in line; ETR reflects profit mix; PAT in line with EBITDA.
Two-column table with an orange header row, category labels on the left, bullet commentary on the right and thin dividers between rows.
Standalone table in INR cr for Q2FY27 / Q1FY27 / Q2FY26 / H1FY27 / H1FY26: gross revenue 17,721 / 17,565 / 14,021 / 35,286 / 28,527; net revenue 15,289 / 15,292 / 12,119 / 30,581 / 24,555; adjusted EBITDA 1,865 / 2,227 / 1,752 / 4,092 / 4,610; PBT 1,170 / 1,474 / 1,244 / 2,644 / 3,441; PAT 861 / 1,086 / 921 / 1,947 / 2,545.
Same table template as page 19 with Q2FY27 and H1FY27 columns highlighted in slate blue and footnotes on FX gains.
Net debt bridge (INR cr): 15,927 at 30 Jun'26, +93 long term debt raised, -517 long term debt repayment, +468 short term loans, -1,185 change in cash and cash equivalents, 14,786 at 30 Sep'26. EBITDA bridge: 2,667 in Q1FY27, +198 ASP, +172 volume, -533 cost, 2,504 in Q2FY27. Capital acceptances of INR 434 cr (Sep'26) and 369 cr (Jun'26) are excluded.
Two stacked waterfall charts, each with a slate-blue title bar; grey start bars, green end bars, black and green floating deltas.
FY20 to Q2FY27 trends: net debt falls from INR 35,918 cr to 14,786 cr (-59%); net debt/EBITDA from 4.56x to 1.51x (-67%); debt/equity from 1.2x to 0.41x (-64%); cumulative capex rises from INR 1,665 cr to 43,637 cr.
2x2 grid of bar charts with slate-blue headers, grey history bars, a highlighted green Q2FY27 bar and green percentage-change brackets.
Commitment versus status across four areas. Scope: invest in steel and ancillaries, with the Angul expansion and slurry pipeline commissioned. Capex: annual INR 7,500-10,000 cr at 18-20% project ROCE, current ROCE 8%. Liquidity and debt: INR 3,000 cr liquidity and net debt/EBITDA below 1.5x; cash INR 7,237 cr and 1.51x. Dividends: 200% dividend declared in FY26.
Matrix with orange row labels and icons at left, 'Our commitment' and 'Current status' columns of outlined boxes, banner at bottom.
Closing slide with the Jindal Steel logo, investor relations email ir@jindalsteel.in, corporate office at Jindal Centre 12, Bhikaiji Cama Place, New Delhi, and website www.jindalsteel.in.
Centered white slide with logo above stacked contact blocks; copyright line at lower left.
Preguntas comunes sobre esta diapositiva y el contenido de la presentación subyacente.
It covers the quarter ended 30 September 2026 in 25 slides: consolidated and standalone financials, operating volumes, India and global steel market data, price trends, product mix, net debt and EBITDA bridges, digital and AI initiatives, ESG and CSR, and the capital allocation framework.
Consolidated gross revenue was INR 19,448 cr, adjusted EBITDA INR 2,504 cr, PAT INR 771 cr, production 2.40 MT and sales 2.38 MT. Net debt was INR 14,786 cr and net debt to EBITDA stood at 1.51x.
Jindal Steel Ltd. (erstwhile Jindal Steel & Power Ltd., NSE: JINDALSTEL) filed the presentation with BSE and NSE. The deck is dated 23 October 2026.
The page offers the original PDF as filed, plus an editable PPTX that has been converted from the PDF. The PPTX is handy for reusing layouts, but charts and fonts may need small adjustments after conversion, so check the PDF for the exact filed version.
Adjusted EBITDA moved from INR 2,667 cr to INR 2,504 cr. The EBITDA bridge on slide 22 shows +198 from ASP and +172 from volume, offset by -533 from higher costs, mainly coking coal, power and fuel, and freight.
Net debt to EBITDA improved from 1.71x in Q1FY27 to 1.51x, and net debt fell from INR 15,927 cr to INR 14,786 cr. Over the longer term, net debt is down 59% from FY20 and net debt/EBITDA down 67%.
Yes. It includes World Steel Association demand outlooks for CY25 to CY27E, India production, consumption, export and import data, and HRC, TMT, coking coal and iron ore price tables with year-on-year and quarter-on-quarter changes.
Yes. It uses a clean corporate IR style with slate-blue title bars, saffron and green accents, KPI tiles, bar charts with growth callouts, waterfall bridges and card layouts, which can be adapted to other industrial or manufacturing results decks.

Create Your Own Slides
Turn your ideas into professional presentations in seconds with 2slides AI.
Referencia diseños profesionales, elige tu estilo y genera diapositivas con renderizado de texto perfecto. Impulsado por Nano Banana—comienza a crear tu presentación ahora.
Tu Agente IA para diapositivas. Ahorra tiempo, brilla más rápido con la creación inteligente de presentaciones.


© 2026 2slides. Todos los derechos reservados.