
Forma parte de Ejemplos de presentaciones para inversores · Ejemplos de presentaciones para inversores de Japón
Idemitsu Kosan H1 FY2026 Earnings Presentation. This is the Japanese-language 2026年度第2四半期 決算説明資料 released on TDnet, the Tokyo Stock Exchange timely-disclosure service, on 11 November 2026. FY2026 runs April 2026 to March 2027, so the deck covers the first half (April-September 2026) of the integrated energy, chemicals and materials group, with H1 results, a raised full-year forecast, mid-term plan progress and a long reference appendix.
Usa la portada de esta presentación como referencia de estilo para diapositivas creadas con tu propio contenido. O elige cualquier página de abajo para usar su diseño como referencia.
Navegación Rápida
Etiquetas
Compartir las diapositivas
Idemitsu Kosan H1 FY2026 Earnings Presentation. This is the Japanese-language 2026年度第2四半期 決算説明資料 released on TDnet, the Tokyo Stock Exchange timely-disclosure service, on 11 November 2026. FY2026 runs April 2026 to March 2027, so the deck covers the first half (April-September 2026) of the integrated energy, chemicals and materials group, with H1 results, a raised full-year forecast, mid-term plan progress and a long reference appendix.
Vista detallada de cada página de diapositiva, incluyendo diseño, contenido clave y elementos visuales.
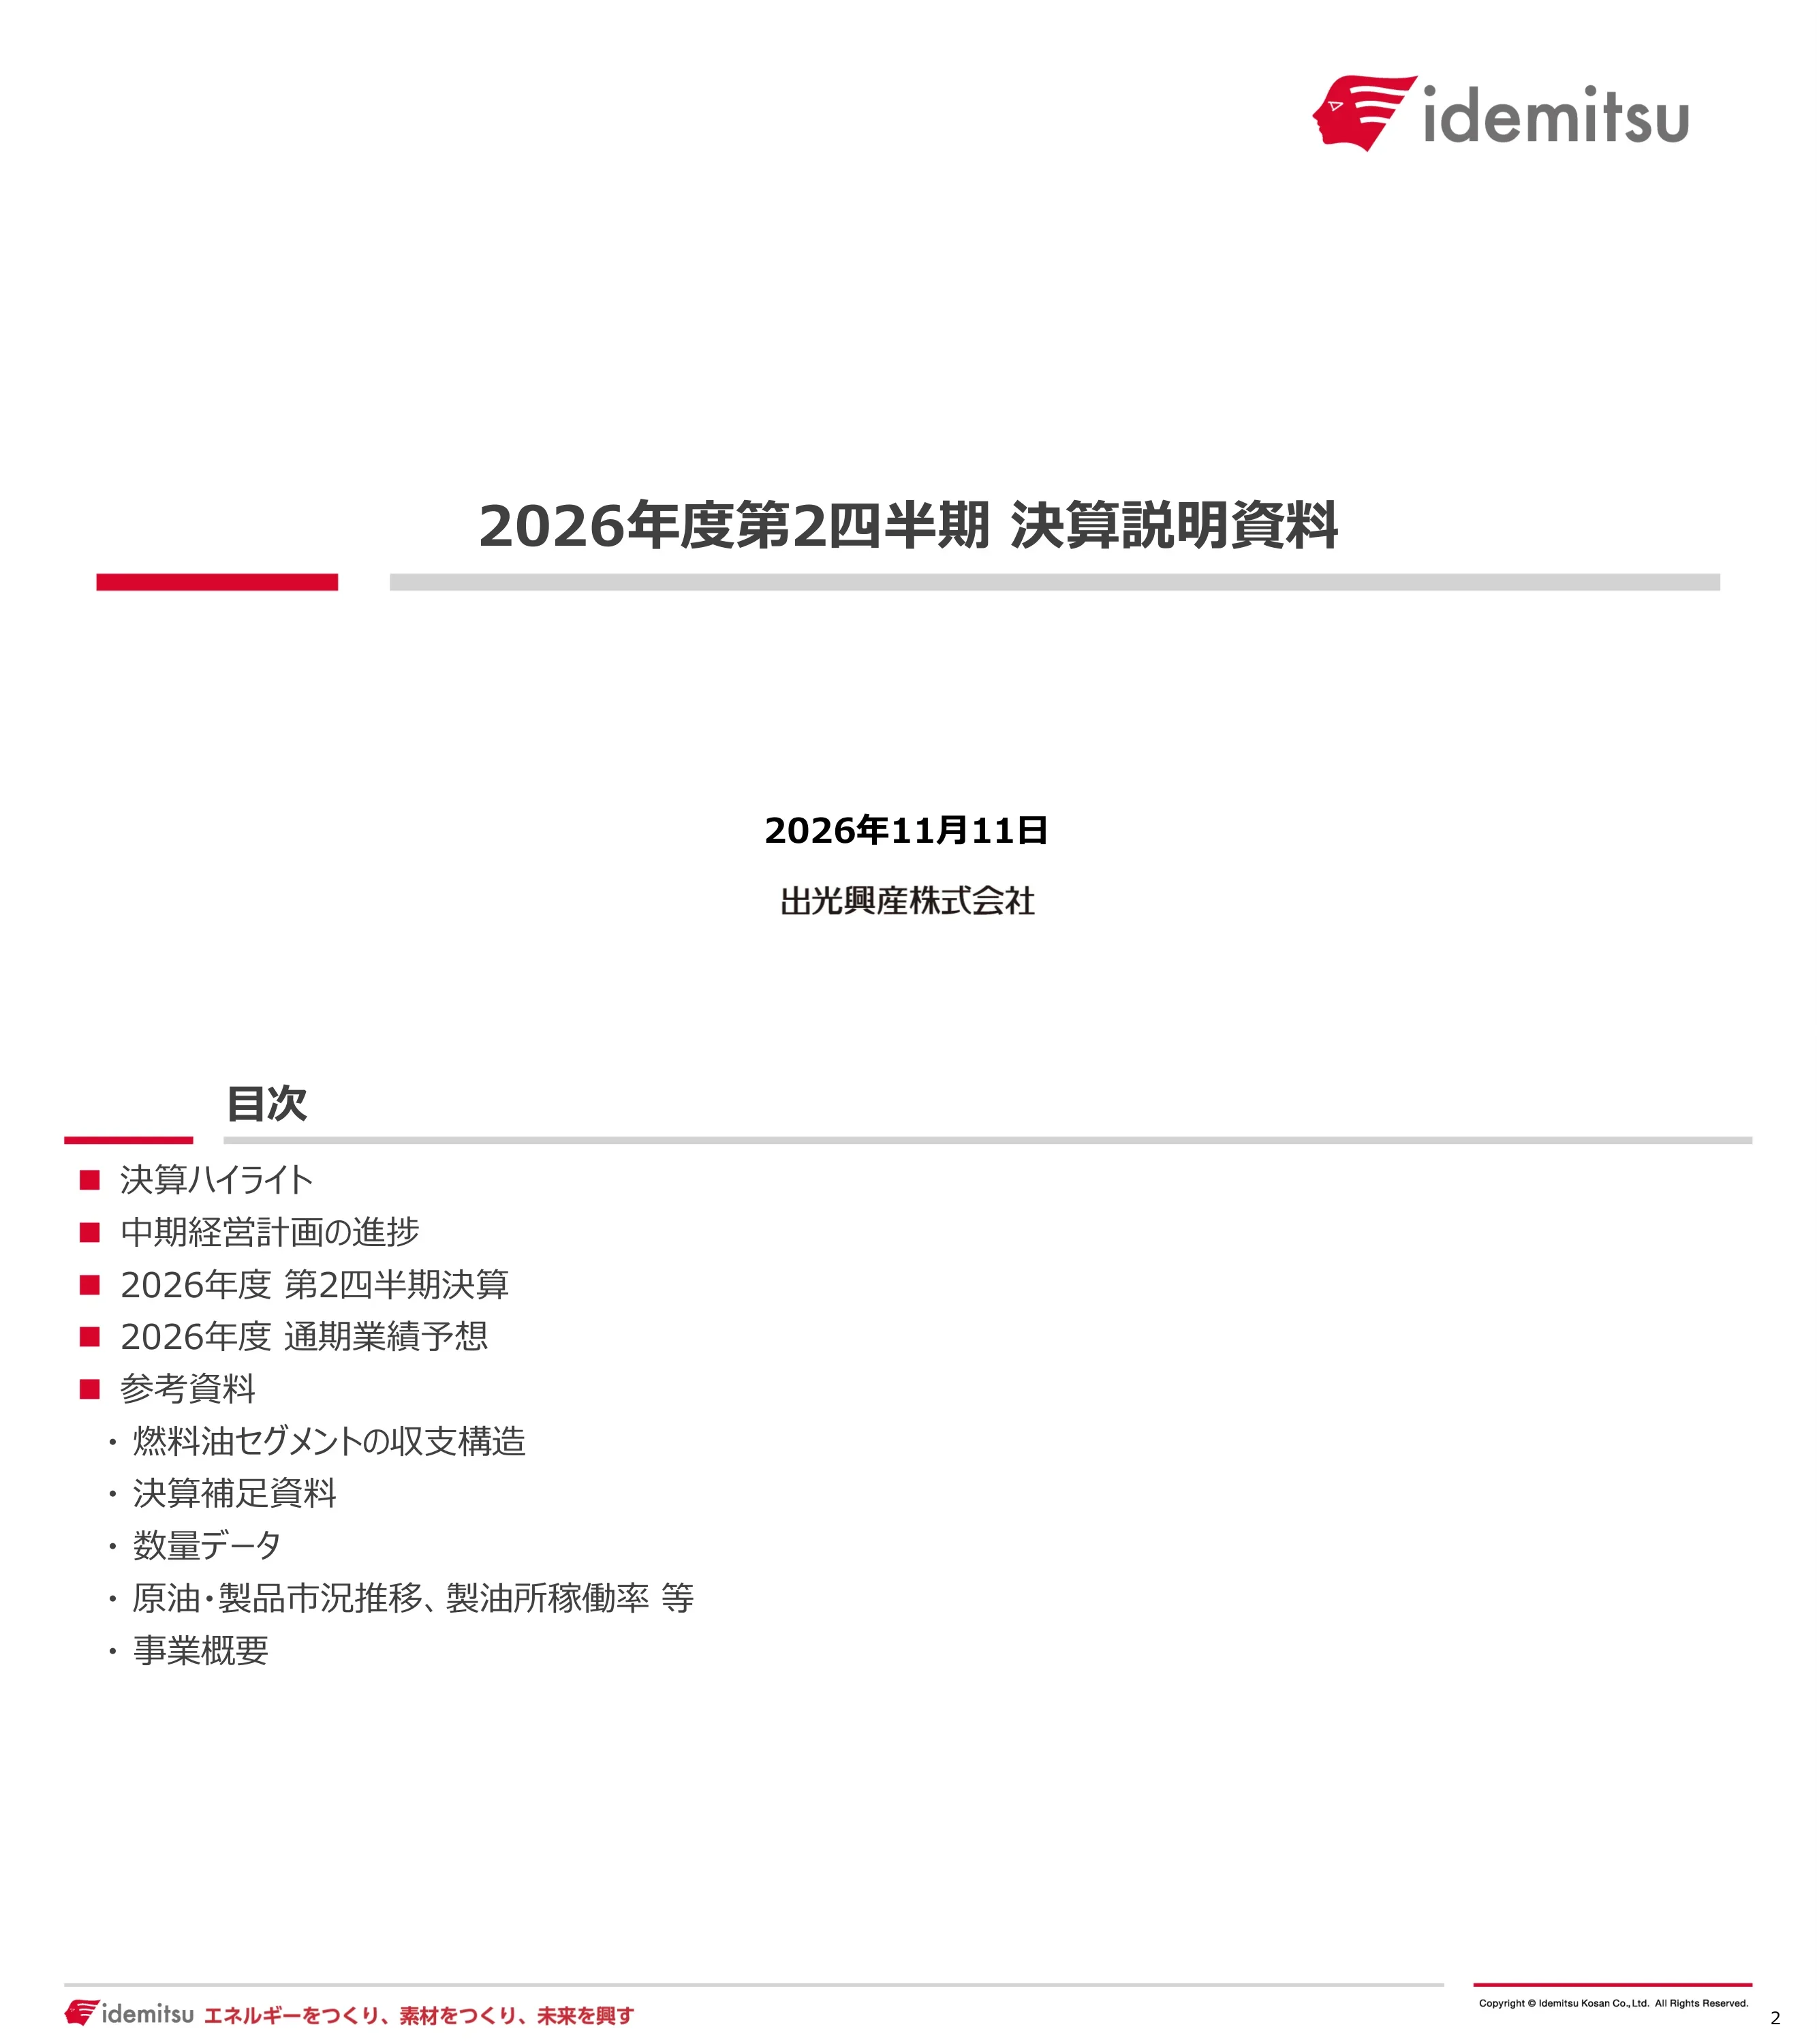
Cover of Idemitsu Kosan's 2026年度第2四半期 決算説明資料 (FY2026 Q2 earnings presentation), dated 11 November 2026 and issued by 出光興産株式会社 (Idemitsu Kosan Co., Ltd.).
Minimal white cover with the logo at top right, the title centred above a red-and-grey rule, and the date and company name below.
Lists the five sections: earnings highlights, mid-term management plan progress, FY2026 Q2 results, FY2026 full-year forecast, and reference materials. The reference section breaks down into the fuel oil segment profit structure, supplementary results, volume data, crude and product market trends with refinery utilization, and a business overview.
Left-aligned bullet list with red square markers for the main sections and small dot bullets for the reference sub-items.
Idemitsu marked 20 years since its listing on the Tokyo Stock Exchange on 24 October 2006. It says it will keep its people-centred management while executing the mid-term plan to raise corporate value and help solve social issues. A share price chart from 2006 to 2026 is overlaid with a rising arrow.
Two bullet lines on top, a photo of the listing ceremony bell-ringing with a caption box on the left, and a long grey share-price line chart with a pink arrow across the bottom.
Section divider introducing the earnings highlights chapter. It has no figures.
Blank slide with a centred red square and the section name.
Idemitsu says the outlook in the Middle East remains uncertain but it is maintaining stable supply to the domestic market while working to expand earnings. Compared with August 2026, as of November it continues alternative crude procurement from outside the Strait of Hormuz, operates plants at or above last year's level, keeps domestic supply stable, and resumes exports from the second quarter. Pricing pass-through keeps the domestic fuel oil business neutral, excluding time-lag effects.
Three rows (procurement, manufacturing, sales) shown as red pills with an August column on the left, a big gradient arrow, and a November column on the right.
Excluding inventory effects, Q2 pre-tax profit before finance costs was ¥198.2 billion (1,982 億円), up ¥73.2 billion year on year (including a ¥87.8 billion fuel oil time-lag gain), and net income was ¥143.6 billion (1,436 億円), up ¥41.9 billion. Overseas trading, lubricants and resources were strong. The full-year forecast was raised by ¥100.0 billion to ¥240.0 billion for pre-tax profit before finance costs and by ¥75.0 billion to ¥165.0 billion for net income versus the 12 May forecast, mainly because the crude price assumption for Q4 was lifted from $65 to $85 per barrel, narrowing the fuel oil negative time lag.
Two stacked bands, results above and forecast below, each with two large number callouts on the left and a red headline pill with bullet commentary on the right.
For FY2026 Idemitsu plans to return at least 50% of net income excluding inventory effects. The year-end dividend forecast is ¥22 per share (up ¥4), and from FY2027 a progressive dividend with a floor of ¥44 per year is planned. The amount and timing of further share buybacks will be decided from Q3, and the ¥25.0 billion buyback announced in May starts on 12 November. A bar chart shows annual dividends of ¥36 for 2025, ¥40 for 2026 (¥18 interim plus ¥22 forecast year-end) and ¥44 for 2027.
Bold policy bullets across the top and a stacked bar chart of interim and year-end dividends in the centre with arrows between the years and two bullet notes below.
Section divider introducing progress on the mid-term management plan.
Blank slide with a centred red square and the section name.
The strategy rests on three themes: GRIT (deepening existing businesses), GROWTH (creating growth businesses in areas such as electrification, ICT and overseas) and CNX (taking on low- and decarbonization businesses). They are applied across five businesses: fuel oil, basic chemicals, high-performance materials, power and renewables, and resources. The left column lists the social issues, including energy security, the S+3E balance and growing overseas demand, and footnotes define GRIT as Guts, Resilience, Initiative, Tenacity.
A left box of social issues connects with a funnel-shaped red wedge to a right-hand panel of three stacked theme cards, over a row of five coloured business tabs at the bottom.
GRIT aims to combine stable supply with high capital efficiency across the value chain from development and procurement to refining and logistics and sales. Supply stabilization and sales-strengthening measures target +¥70.0 billion (700 億円) of pre-tax profit before finance costs by FY2030, and business integration and restructuring (Fuji Oil synergies, ethylene cracker consolidation, polyolefin integration, SDS Agrokansho synergies, restructuring of challenged businesses) targets +¥40.0 billion (400 億円). Safe and stable refinery operation is highlighted.
A three-step value chain banner at the top, two large pink panels of bulleted measures tagged with coloured segment labels, and a right column showing the FY2030 profit contribution figures.
The goal is a stable utilization rate of 90% or more. Utilization excluding turnarounds across six refineries including Fuji Oil was 91% in Q2 FY2026 (Q1 84%, against 85% and 81% a year earlier), helped by smooth procurement of crude from outside the Middle East. The three-year FY2023-25 average was 86%, and a utilization improvement project is on schedule, with a target of 90%+ by FY2030.
A grouped bar chart of previous-year and current-year utilization by quarter on the left, and a stair-step roadmap graphic with continuing and accelerated measures on the right.
Explains the background: a shrinking workforce, severe weather, ageing equipment and fewer skilled veterans. The approach is to reduce trouble through equipment that fails less, early detection and appropriate response, and to minimize impact when it occurs. Measures are strengthening on-site capability (standardization, training by veterans with simulators), digital and AI support, headquarters-site cross-functional coordination using PDCA/OODA, and investment to protect throughput.
A table-style slide with rows for background, trouble-reduction thinking and current issues at the top, then a red vertical label for accelerated measures with three boxed rows and an investment column on the right.
Illustrates how site strength is made visible: a skill matrix for shift teams marks proficiency by colour (sufficient or insufficient) to show gaps, and quality and quantity measures follow. A second panel shows simulation-based operator training built on veterans' knowledge, moving from advance preparation to simulation training to actual operation. It builds judgement, risk sensitivity and usable procedures.
Left side navigation of the four Ms (Man, Media, Machine, Management), a central panel with a green/yellow skill grid and photo, and a right panel with a three-step training flow and photo.
Construction of the large pilot plants for lithium sulfide (completion June 2027) and for the solid electrolyte (completion within 2027) is progressing and is in its second half. Development targets practical all-solid-state batteries for vehicles in 2027-2028, and non-vehicle uses such as drones and humanoids are under study.
Text bullets at the top and a horizontal process arrow below running from critical minerals and sulfur through lithium sulfide and solid electrolyte to all-solid-state batteries, with a red-framed box on expansion to other uses.
Idemitsu opened a development lab for space-use CIGS solar cells at the OASIS industry-academia site at UC Santa Barbara, with a bench plant planned within 2027 on the way to mass production. Separately, subsidiary Idemitsu Chemical Recycle Japan will supply chemical-recycled oil made from used plastic to the Chiba refinery to produce naphtha, completing an in-group chain from plastic collection to naphtha. Source links to company releases are printed on the slide.
Two stacked sections: a roadmap strip (now, 2027 onward, future) beside footnotes, and below it a process flow diagram inside blue boundary boxes.
Nghi Son Refinery (NSRP) kept running at a high rate in the first half by securing crude mainly from outside the Strait of Hormuz and, helped by strong overseas product markets and positive time lag, posted a net profit and expects a net profit for the full year. Sponsors agreed to simplify interest on subordinated loans from FY2026. An equity-method gain of about ¥17.0 billion (170 億円) is expected in FY2026 from a reversal of provisions linked to principal repayment of senior loans.
Three bullet points at the top and a wide aerial photograph of the refinery below with a caption.
Basic chemicals: agreement to consolidate the Chiba ethylene unit into Mitsui Chemicals in July 2027, and to integrate Prime Polymer's polyolefin business with Sumitomo Chemical's domestic PP and LLDPE businesses, with the absorption-type split to Prime Polymer scheduled to complete in April 2027. Power and renewables: restructuring of the North American power business is under way.
Text-only slide with two bold headings and bullet points in the top third and a large blank area below.
Section divider for the half-year results chapter.
Blank slide with a centred red square and the section name.
Three line charts compare FY2026 (red) with FY2025 (grey). Dubai crude averaged $96.1 per barrel for April-June and $93.1 for July-September 2026, against $66.9 and $70.1 a year earlier; the FY2025 average was $71.8 and the FY2026 forecast premise is $91.8. Australian thermal coal spot was $119.6 and $136.2 per ton in the two quarters (FY2025 average $105.4, FY2026 premise $131.9). The yen was 159.5 and 159.3 per dollar (FY2025 average 150.8, FY2026 premise 157.2).
Three side-by-side line charts, each with dashed monthly lines and solid quarterly averages, and a small text note of average and premise values below each.
Dubai crude averaged $94.6 per barrel in Q2 FY2026 (+38.3% year on year), Australian thermal coal $127.9 per ton (+24.7%) and the yen 159.4 per dollar (+9.1%). Consolidated revenue was ¥5,055.9 billion (50,559 億円, +33.6%) and operating profit ¥425.7 billion (4,257 億円) against ¥57.2 billion, including an inventory valuation gain of ¥261.1 billion. Pre-tax profit before finance costs was ¥459.3 billion (¥198.2 billion excluding inventory effects) and net income ¥322.4 billion (¥143.6 billion excluding inventory effects).
Two tables stacked vertically: market prices on top and consolidated highlights below, with year-on-year change columns and highlighted bold rows for profit measures.
Waterfall of pre-tax profit before finance costs excluding inventory effects from ¥125.0 billion in Q2 FY2025 to ¥198.2 billion in Q2 FY2026 (+¥73.2 billion). Fuel oil contributed +¥47.0 billion, basic chemicals +¥6.9 billion, high-performance materials +¥5.0 billion, power and renewables -¥7.2 billion, resources +¥19.0 billion (oil and gas +¥9.0 billion, coal +¥10.1 billion) and other +¥2.5 billion.
A single waterfall chart with grey start and end bars, light blue increase bars, a red decrease bar and a dotted box grouping the resources items.
Fuel oil rose from ¥83.4 billion to ¥130.3 billion (+¥47.0 billion): time lag +¥87.8 billion, trading +¥36.6 billion and product import/export +¥28.0 billion, offset by own-use fuel cost -¥35.1 billion and main fuel margin -¥29.5 billion. Basic chemicals moved from -¥5.5 billion to ¥1.3 billion, high-performance materials rose to ¥35.3 billion, power and renewables fell to -¥3.6 billion on a Toa Oil turnaround and a power plant problem, and resources rose to ¥38.6 billion. Total was ¥198.2 billion.
A segment table with Q2 FY2025, Q2 FY2026, change and a wide commentary column of plus and minus drivers, with a grey-shaded total row.
Balance sheet at 30 September 2026 versus end of March 2026: total assets ¥6,251.3 billion (62,513 億円, +¥982.1 billion), equity ¥1,754.4 billion, net interest-bearing debt ¥2,086.8 billion (+¥581.2 billion), net D/E ratio 1.21 (from 1.03) and equity ratio 27.6% (from 27.8%). Cash fell to ¥303.6 billion while receivables and inventories rose to ¥3,708.3 billion.
Two side-by-side balance sheet tables (assets left, liabilities and equity right) with a smaller key-ratio table at the bottom right.
Operating cash flow was -¥339.4 billion, driven by a ¥646.3 billion working capital increase against operating profit of ¥425.7 billion and depreciation of ¥111.7 billion. Investing cash flow was -¥121.0 billion, including ¥169.4 billion for property and intangible acquisitions. Financing cash flow was +¥397.1 billion (borrowings +¥467.0 billion, dividends and buybacks -¥51.7 billion). Cash ended at ¥303.6 billion.
A single centred table with three boxed blocks for operating, investing and financing flows with indented sub-items, followed by FX effect, net change and closing balance.
Section divider for the full-year forecast chapter.
Blank slide with a centred red square and the section name.
Compared with the 12 May forecast, the Dubai crude assumption rises from $81.3 to $91.8 per barrel, coal from $126.1 to $131.9 per ton and the yen from 151.3 to 157.2 per dollar. From November the premises are $85.0, $136.0 and 155.0 yen. Pre-tax profit before finance costs is now ¥425.0 billion (from ¥120.0 billion), or ¥240.0 billion excluding inventory effects (from ¥140.0 billion). Net income is ¥295.0 billion (from ¥75.0 billion), or ¥165.0 billion excluding inventory effects (from ¥90.0 billion).
Two tables, market premises with an extra column for November onward and consolidated highlights with before, after and change columns.
Waterfall from the 12 May forecast of ¥140.0 billion to the new ¥240.0 billion (+¥100.0 billion), excluding inventory effects. Fuel oil adds ¥85.0 billion, basic chemicals ¥10.0 billion, high-performance materials ¥18.0 billion and resources ¥15.0 billion (oil and gas ¥10.0 billion, coal ¥5.0 billion). Power and renewables subtracts ¥14.0 billion and other subtracts ¥14.0 billion.
Waterfall chart with grey start and end bars, light blue positive steps, two red negative steps and a dotted box around resources.
Fuel oil goes from ¥105.0 billion to ¥190.0 billion (+¥85.0 billion): time lag +¥69.0 billion, import/export +¥37.0 billion, trading +¥30.0 billion and NSRP +¥17.0 billion, offset by own-use fuel cost -¥60.0 billion and main fuel margin -¥8.0 billion. Basic chemicals improves to -¥20.0 billion, high-performance materials to ¥50.0 billion, power and renewables falls to -¥10.0 billion, resources rises to ¥60.0 billion and other is -¥30.0 billion on one-off restructuring costs. Total ¥240.0 billion.
Segment table with 12 May forecast, new forecast, change and commentary columns, and a shaded total row.
A $10 per barrel move in crude and a 5 yen move in the dollar rate changes pre-tax profit by +¥29.0 billion excluding inventory effects and +¥121.0 billion including them (the same amount of loss in the opposite direction). Excluding inventory, crude time lag is +¥34.0 billion and other crude effect -¥10.0 billion, with FX +¥8.0 billion and -¥3.0 billion. Inventory effects are +¥74.0 billion for crude and +¥18.0 billion for FX, all in the fuel oil segment, based on Q4 premises of $85 per barrel and 155 yen.
A summary sentence at the top and a grouped table below listing indicator, premise, change, segment and profit impact, with subtotal lines and a bottom total.
FY2026 capital expenditure is expected to be ¥265.0 billion, unchanged from May, with about ¥150.0 billion spent by the end of Q2. The split is GRIT ¥127.0 billion, GROWTH and CNX ¥123.0 billion and business platform ¥15.0 billion. Amounts are on a cash-outlay basis.
Two bullet lines on top and a small centred table of May outlook, current outlook and change.
Section divider opening the reference section.
Blank slide with a centred red square and the section name.
Shows a 2030 vision of improved equipment, better ways of working for people, and advanced use of digital and AI, with a target utilization rate (excluding turnarounds) of 90%+ by FY2030. A timeline from FY2025 to FY2030 sets out four workstreams: strengthening on-site capability (company-wide measures, model-site trial then rollout), investment to raise utilization (planning in FY2026, execution with turnarounds), digital and AI use, and horizontal coordination between headquarters and sites.
A dark banner of three vision boxes at top, then a Gantt-style grid of four workstreams across years with pink and blue bars and a red target bubble at the right edge.
Describes the flow from crude procurement (about one month transport from producing countries) through refining to domestic and overseas sales. Three points drive earnings: (1) time lag, where rising crude prices help and falling prices hurt, (2) sales margin, the selling price minus crude price, which is described as steady and stabilizing profit, and (3) utilization rate, where higher utilization raises exports or lowers procurement.
A dark three-box process chain at the top and, below, three explanatory panels, two with bar diagrams of unit price and volume.
Uses April as an example. Time lag: crude loaded in March arrives, is refined and sold in April after about one month at sea, so the gap between April and March crude prices is the time lag, positive when prices rise. Inventory effect: the difference between cost excluding inventory (close to actual payment) and cost including inventory (used for accounting, with a 70-day stockholding obligation under Japanese law) is positive when prices rise and negative when they fall.
Two dashed red panels, a world map with a tanker arrow on the left and a stacked tank diagram on the right, each with explanatory text below.
Two charts show the monthly average share price, rising from roughly 500-600 yen in April 2023 to about 1,500 yen by late 2026, and the monthly average price-to-book ratio, which climbs from about 0.5 to above 1.0 and about 1.25 at the latest point. A marker shows the move to IFRS from April 2026.
Two stacked line charts sharing a time axis, a red line for share price and a dark line for PBR, with a grey arrow annotation for IFRS adoption.
Q2 FY2026 revenue was ¥5,055.9 billion (50,559 億円), up 33.6%. Fuel oil was 42,144 億円 (+34.5%), basic chemicals 3,306 億円 (+40.6%), high-performance materials 3,122 億円 (+22.0%), power and renewables 478 億円 (-12.1%), resources 1,442 億円 (+48.8%, with oil development 284 and coal 1,158) and other 69 億円.
A single table of year-on-year revenue by segment with sub-rows for resources and a shaded total row.
Total fuel oil sales were 18,741 thousand KL (+3.1%). Domestic sales fell 1.5% to 15,213 thousand KL, with gasoline 5,905 (-5.4%), naphtha 403 (-7.9%), jet fuel 1,283 (+5.4%), kerosene 747 (+12.2%) and diesel 4,838 (flat). Exports rose 28.9% to 3,528 thousand KL.
A single product-by-product table with prior year, current year, change and percent columns, and shaded subtotal rows.
Basic chemicals sold 1,468 thousand tons (-0.7%). In high-performance materials, lubricants were 535 thousand KL (+0.8%) and functional chemicals 191 thousand tons (-7.8%). Retail power sales were 933 million kWh (+0.9%).
Three small tables stacked vertically, one per segment, each with its own unit label.
Gas and oil production was 27.8 thousand BOED (+13.4%): Vietnam 14.6 (+7.9%) and Norway 13.2 (+20.1%), equal to 5,057 thousand BOE. Coal production was 3,265 thousand tons (+24.0%). Figures are on an equity basis, Norway for January-June and Vietnam for April-September.
Two tables, oil and gas production above and coal production below, each with explanatory footnotes.
The FY2026 outlook for domestic fuel oil sales is 33,320 thousand KL (+1.2% versus May), with gasoline 11,610, naphtha 1,380 (+17.9%), jet 2,500, kerosene 3,470, diesel 9,770, A heavy oil 2,930 and C heavy oil 1,660. Exports are expected at 9,110 thousand KL and total sales at 42,420 thousand KL; the May forecast did not show an export figure.
A product table comparing the May forecast with the current outlook, with dashes where no earlier figure existed.
Basic chemicals are expected at 3,180 thousand tons (-9.9% versus May), lubricants at 1,080 thousand KL, functional chemicals at 410 thousand tons and retail power at 1,900 million kWh (+0.5%).
Three small tables stacked by segment with May forecast, current outlook and change columns.
Gas and oil production is now expected at 25.4 thousand BOED (+3.3%; Vietnam 12.6, Norway 12.8), or 9,290 thousand BOE. Coal production is unchanged at 6,300 thousand tons. Norway figures are for January-December and Vietnam for April-March.
Two tables, oil and gas production on top and coal below, with footnotes on basis and fiscal periods.
A line chart of Brent and Dubai crude in USD per barrel from April 2020 to autumn 2026. It shows the rise to about $110-120 in 2022, a drift to the $60s-$70s through 2025, and a sharp spike to roughly $130 around the start of FY2026 followed by a dip near $80 and a rebound above $110.
A single large line chart with a grey Brent line and a red Dubai line and annual gridlines.
A combination chart of domestic gasoline spot and crude prices in yen per litre with the spread as bars on a second axis, April 2020 to 2026. The spread is typically 10-20 yen per litre, turns negative to about -10 yen in mid-2026, and rebounds to about 40 yen at the latest data point.
Line chart with a dual axis: crude and product lines on the left axis, light blue spread bars on the right.
Same format for diesel: domestic spot and crude in yen per litre with the spread on the right axis. The spread is generally 10-25 yen per litre, dips negative in mid-2026 and recovers to about 40 yen.
Dual-axis combination chart with lines for diesel and crude and bars for the spread.
Chart of Singapore gasoline spot against Dubai crude in USD per barrel with the spread as bars, April 2020 to 2026. The spread peaked above $35 per barrel in 2022 and widened again to about $25-30 in 2026.
Dual-axis combination chart with two lines and light blue spread bars.
Chart of Singapore diesel against Dubai crude in USD per barrel with the spread as bars. The spread peaked near $90 per barrel around the start of FY2026, well above the 2022 peak of roughly $60, and stays elevated at roughly $65-70 at the latest points.
Dual-axis combination chart with two lines and bars on a 0 to 100 right axis.
Price chart of naphtha, paraxylene (PX) and mixed xylene (MX) in USD per ton with PX and MX spreads as bars. An inset table shows the average PX spread rising from $242 to $282 per ton (+40) and MX from $114 to $139 (+25) between Q2 FY2025 and Q2 FY2026.
A dual-axis chart with three lines and two sets of layered bars, with a small table inset at the top centre.
Price chart of naphtha, styrene monomer (SM) and benzene (BZ) in USD per ton with spreads as bars. The inset table shows the SM spread rising from $344 to $375 per ton (+31) and BZ from $144 to $163 (+19) in Q2 FY2026 versus Q2 FY2025.
A dual-axis chart with three lines, two layered spread bar series and an inset table at the upper right.
Refinery utilization including turnarounds (BCD) was 71%, 71%, 82%, 87%, 72% and 81% from Q1 FY2025 to Q2 FY2026; excluding turnarounds (BSD) it was 85%, 81%, 92%, 88%, 84% and 91%. The number of service stations declined from 6,136 in FY2022 to 5,918 in FY2024, 5,835 in FY2025 and 5,735 at Q2 FY2026.
Two tables, a six-quarter utilization table with BCD and BSD rows on top and a five-period service station count table below.
Based on FY2025 results or the position at September 2026. Fuel oil: crude processing capacity 931 thousand barrels per day (excluding Nghi Son), domestic fuel sales of about 33 million KL per year and 5,735 service stations. Basic chemicals: ethylene 1.00 million tons, paraxylene 840 thousand tons and styrene monomer 790 thousand tons per year. High-performance materials include lubricants (1.1 million KL per year), engineering plastics (200 thousand tons) and organic EL materials (26 tons). Power: 1.91 GW, of which 920 MW renewable. Resources: crude production 25 thousand barrels per day and coal 5.66 million tons per year.
A grid of five boxes, one for each business, with bullet lists of capacities and footnotes below.
Refinery table in 10,000 barrels per day: Hokkaido 14.0, Chiba 20.0, Aichi 16.3, Showa Yokkaichi Sekiyu's Yokkaichi 22.5 (75.0% stake), Toa Oil's Keihin 6.0 (100%) and Fuji Oil's Sodegaura 14.3 (92.5%), giving 93.1 domestic. Nghi Son in Vietnam adds 20.0 (35.1% stake). Secondary unit capacities (hydrodesulfurization, FCC, RFCC and others) are listed per site.
A wide matrix with operating company and refinery rows and columns for crude capacity and each conversion unit, with bold subtotal rows for domestic and overseas.
Annual capacity in thousand tons. Chiba: ethylene 374, paraxylene 265, styrene monomer 210. Aichi: paraxylene 357. Tokuyama: ethylene 623, paraxylene 214, styrene monomer 340. Domestic totals are ethylene 997, paraxylene 836 and styrene monomer 550. Overseas, Idemitsu Petrochemicals Malaysia (100%) has 240 of styrene monomer and Nghi Son (35.1%) has 700 of paraxylene.
A matrix table of operating company, site and three product columns, with shaded domestic and overseas total rows.
Lubricants: automotive, grease and industrial oils, ranked 8th in global share with overseas sales above 50% and a network across 28 countries (map of red dots). Functional chemicals: engineering plastics such as polycarbonate resin (smartphones, lenses, automotive lighting) and SPS (automotive electronics, cookware), and hydrogenated petroleum resin used as a tackifier for hot-melt adhesives in hygiene products.
Two columns, lubricants on the left with a world map and functional chemicals on the right with bullets and small product photos.
Electronic materials: organic EL display materials and semiconductor materials for displays, with production and support sites in Paju, South Korea (12 tons), Chengdu, China (12 tons) and the Omaezaki plant in Japan (2 tons), and development of oxide semiconductor materials. Agri-life: chemical and biological agrochemicals such as Daconil 1000, and a functional feed, Luminup, containing cashew shell liquid that reduces methane in cow belching.
Two columns, electronic materials with a three-point Asian map, agri-life with product photos and two footnotes.
Table of power plants with ownership share and capacity in 10,000 kW. Domestic renewables total 31.9 (solar 19.1, biomass 10.3, wind 2.0, geothermal 0.5), domestic thermal 83.4, overseas solar 59.8 and thermal 16.3, for a total of 191.4. Renewable capacity is 91.7 (domestic 31.9, overseas 59.8). The company uses its own thermal sources for wholesale and retail power, and stopped solar panel manufacturing in June 2022, shifting to a system integrator role.
A long table by energy type, plant, operating company, stake and capacity, with shaded subtotal rows and diamond bullet notes below.
Idemitsu produces and sells oil and gas in Vietnam and Norway and aims to shift toward natural gas in Southeast Asia. A table lists the Vietnam Sao Vang-Dai Nguyet field (43.08% held through Idemitsu Gas Production) and Norwegian fields operated through INPEX Idemitsu Norge. A bar chart shows reserves for 2023-2025 of roughly 70-95 million BOE, with a box explaining the PRMS reserve standard and proven and estimated reserves.
Left side with overview text and a field table, right side with a small bar chart over a long definition box.
Strategy is to use the competitive Boggabri mine for stable supply and income, push low-carbon solutions and shift into critical minerals, renewables, hydrogen and ammonia. Boggabri (New South Wales; about 70% thermal and 30% coking coal; shipped from Newcastle, about 360 km by rail) is described. Idemitsu Green Energy Pellet cut coal-fired CO2 by co-firing 20-30% black pellets, started a 120 thousand ton per year commercial plant in Vietnam in FY2025 and aims for 3 million tons of supply by FY2030. New Australian businesses include vanadium (Vecco investment) and pumped-hydro study at the Muswellbrook mine site.
Two-column slide, overview with a map of Australia on the left and restructuring with a photo of black pellets and a Vietnam map on the right.
States that forecasts, strategy and management policies that are not historical fact are forward-looking and based on management's judgement of currently available information. Actual results may differ significantly because of factors such as economic conditions, crude oil prices, demand for petroleum products, market conditions, exchange rates and interest rates.
Text-only slide with three bold paragraphs under the title.
Preguntas comunes sobre esta diapositiva y el contenido de la presentación subyacente.
It is Idemitsu Kosan's Japanese-language 2026年度第2四半期 決算説明資料 (earnings presentation), released on TDnet, the Tokyo Stock Exchange timely-disclosure service, on 11 November 2026. The slides are in Japanese, and this page gives English titles and key figures, keeping the company's yen units such as ¥100 million (億円).
FY2026 runs from April 2026 to March 2027, and this deck covers the first half (April-September 2026), with balance sheet data as of 30 September 2026 compared with the end of March 2026.
Excluding inventory effects, pre-tax profit before finance costs was ¥198.2 billion (+¥73.2 billion year on year) and net income was ¥143.6 billion (+¥41.9 billion). Including inventory effects, revenue was ¥5,055.9 billion, operating profit ¥425.7 billion and net income ¥322.4 billion.
Yes. Versus the 12 May forecast, full-year pre-tax profit before finance costs excluding inventory effects was raised by ¥100.0 billion to ¥240.0 billion and net income by ¥75.0 billion to ¥165.0 billion. The slides cite a higher Q4 crude assumption ($85 per barrel instead of $65) and stronger overseas businesses.
The year-end dividend forecast is ¥22 per share (up ¥4), giving ¥40 for FY2026, and a progressive dividend with a floor of ¥44 per year is planned from FY2027. The deck says the ¥25.0 billion buyback announced in May starts on 12 November and that further buybacks will be decided from Q3.
Because crude takes about a month to arrive, the difference between loading-time and selling-time prices is the time lag, positive when prices rise. Inventory effects arise from accounting cost that includes stockholding, which also helps when prices rise and hurts when they fall. Slides 33, 34 and 29 explain this with diagrams and a sensitivity table.
Slides 31-58 contain segment revenue, sales and production volumes and outlooks, crude and product spread charts, refinery utilization, service station counts, refinery and chemical plant capacities, power plants and business overviews for lubricants, functional chemicals, electronic materials, agri-life, oil and gas, and coal.
Yes. It shows a typical Japanese earnings-deck structure: highlights, strategy progress, results, forecast and appendix, using waterfall bridges, before-and-after forecast tables, key-point pills and plain white slides with a red accent line. Fine footnotes and small print on some tables may be hard to read at low resolution.

Create Your Own Slides
Turn your ideas into professional presentations in seconds with 2slides AI.
Referencia diseños profesionales, elige tu estilo y genera diapositivas con renderizado de texto perfecto. Impulsado por Nano Banana—comienza a crear tu presentación ahora.
Tu Agente IA para diapositivas. Ahorra tiempo, brilla más rápido con la creación inteligente de presentaciones.


© 2026 2slides. Todos los derechos reservados.