
Forma parte de Ejemplos de presentaciones para inversores
Fubon Financial H1 2026 Results Presentation: the English-language investor meeting deck from Fubon Financial Holding (TWSE: 2881) on first-half 2026 (1H26) results. It was filed on Taiwan's Market Observation Post System (MOPS) for the investor conference (法說會) held around November 2026. The deck reports 1H26 net income of NT$97.4 billion (New Taiwan dollars) and EPS of NT$6.67. Adding FVOCI equity disposal gains brings combined earnings to NT$188.5 billion, or NT$13.17 per share. It covers the group and its subsidiaries Fubon Life, Taipei Fubon Bank, Fubon Insurance, Fubon Securities, Fubon Asset Management, Fubon Bank (Hong Kong) and Fubon Bank (China).
Usa la portada de esta presentación como referencia de estilo para diapositivas creadas con tu propio contenido. O elige cualquier página de abajo para usar su diseño como referencia.
Navegación Rápida
Etiquetas
Compartir las diapositivas
Fubon Financial H1 2026 Results Presentation: the English-language investor meeting deck from Fubon Financial Holding (TWSE: 2881) on first-half 2026 (1H26) results. It was filed on Taiwan's Market Observation Post System (MOPS) for the investor conference (法說會) held around November 2026. The deck reports 1H26 net income of NT$97.4 billion (New Taiwan dollars) and EPS of NT$6.67. Adding FVOCI equity disposal gains brings combined earnings to NT$188.5 billion, or NT$13.17 per share. It covers the group and its subsidiaries Fubon Life, Taipei Fubon Bank, Fubon Insurance, Fubon Securities, Fubon Asset Management, Fubon Bank (Hong Kong) and Fubon Bank (China).
Vista detallada de cada página de diapositiva, incluyendo diseño, contenido clave y elementos visuales.
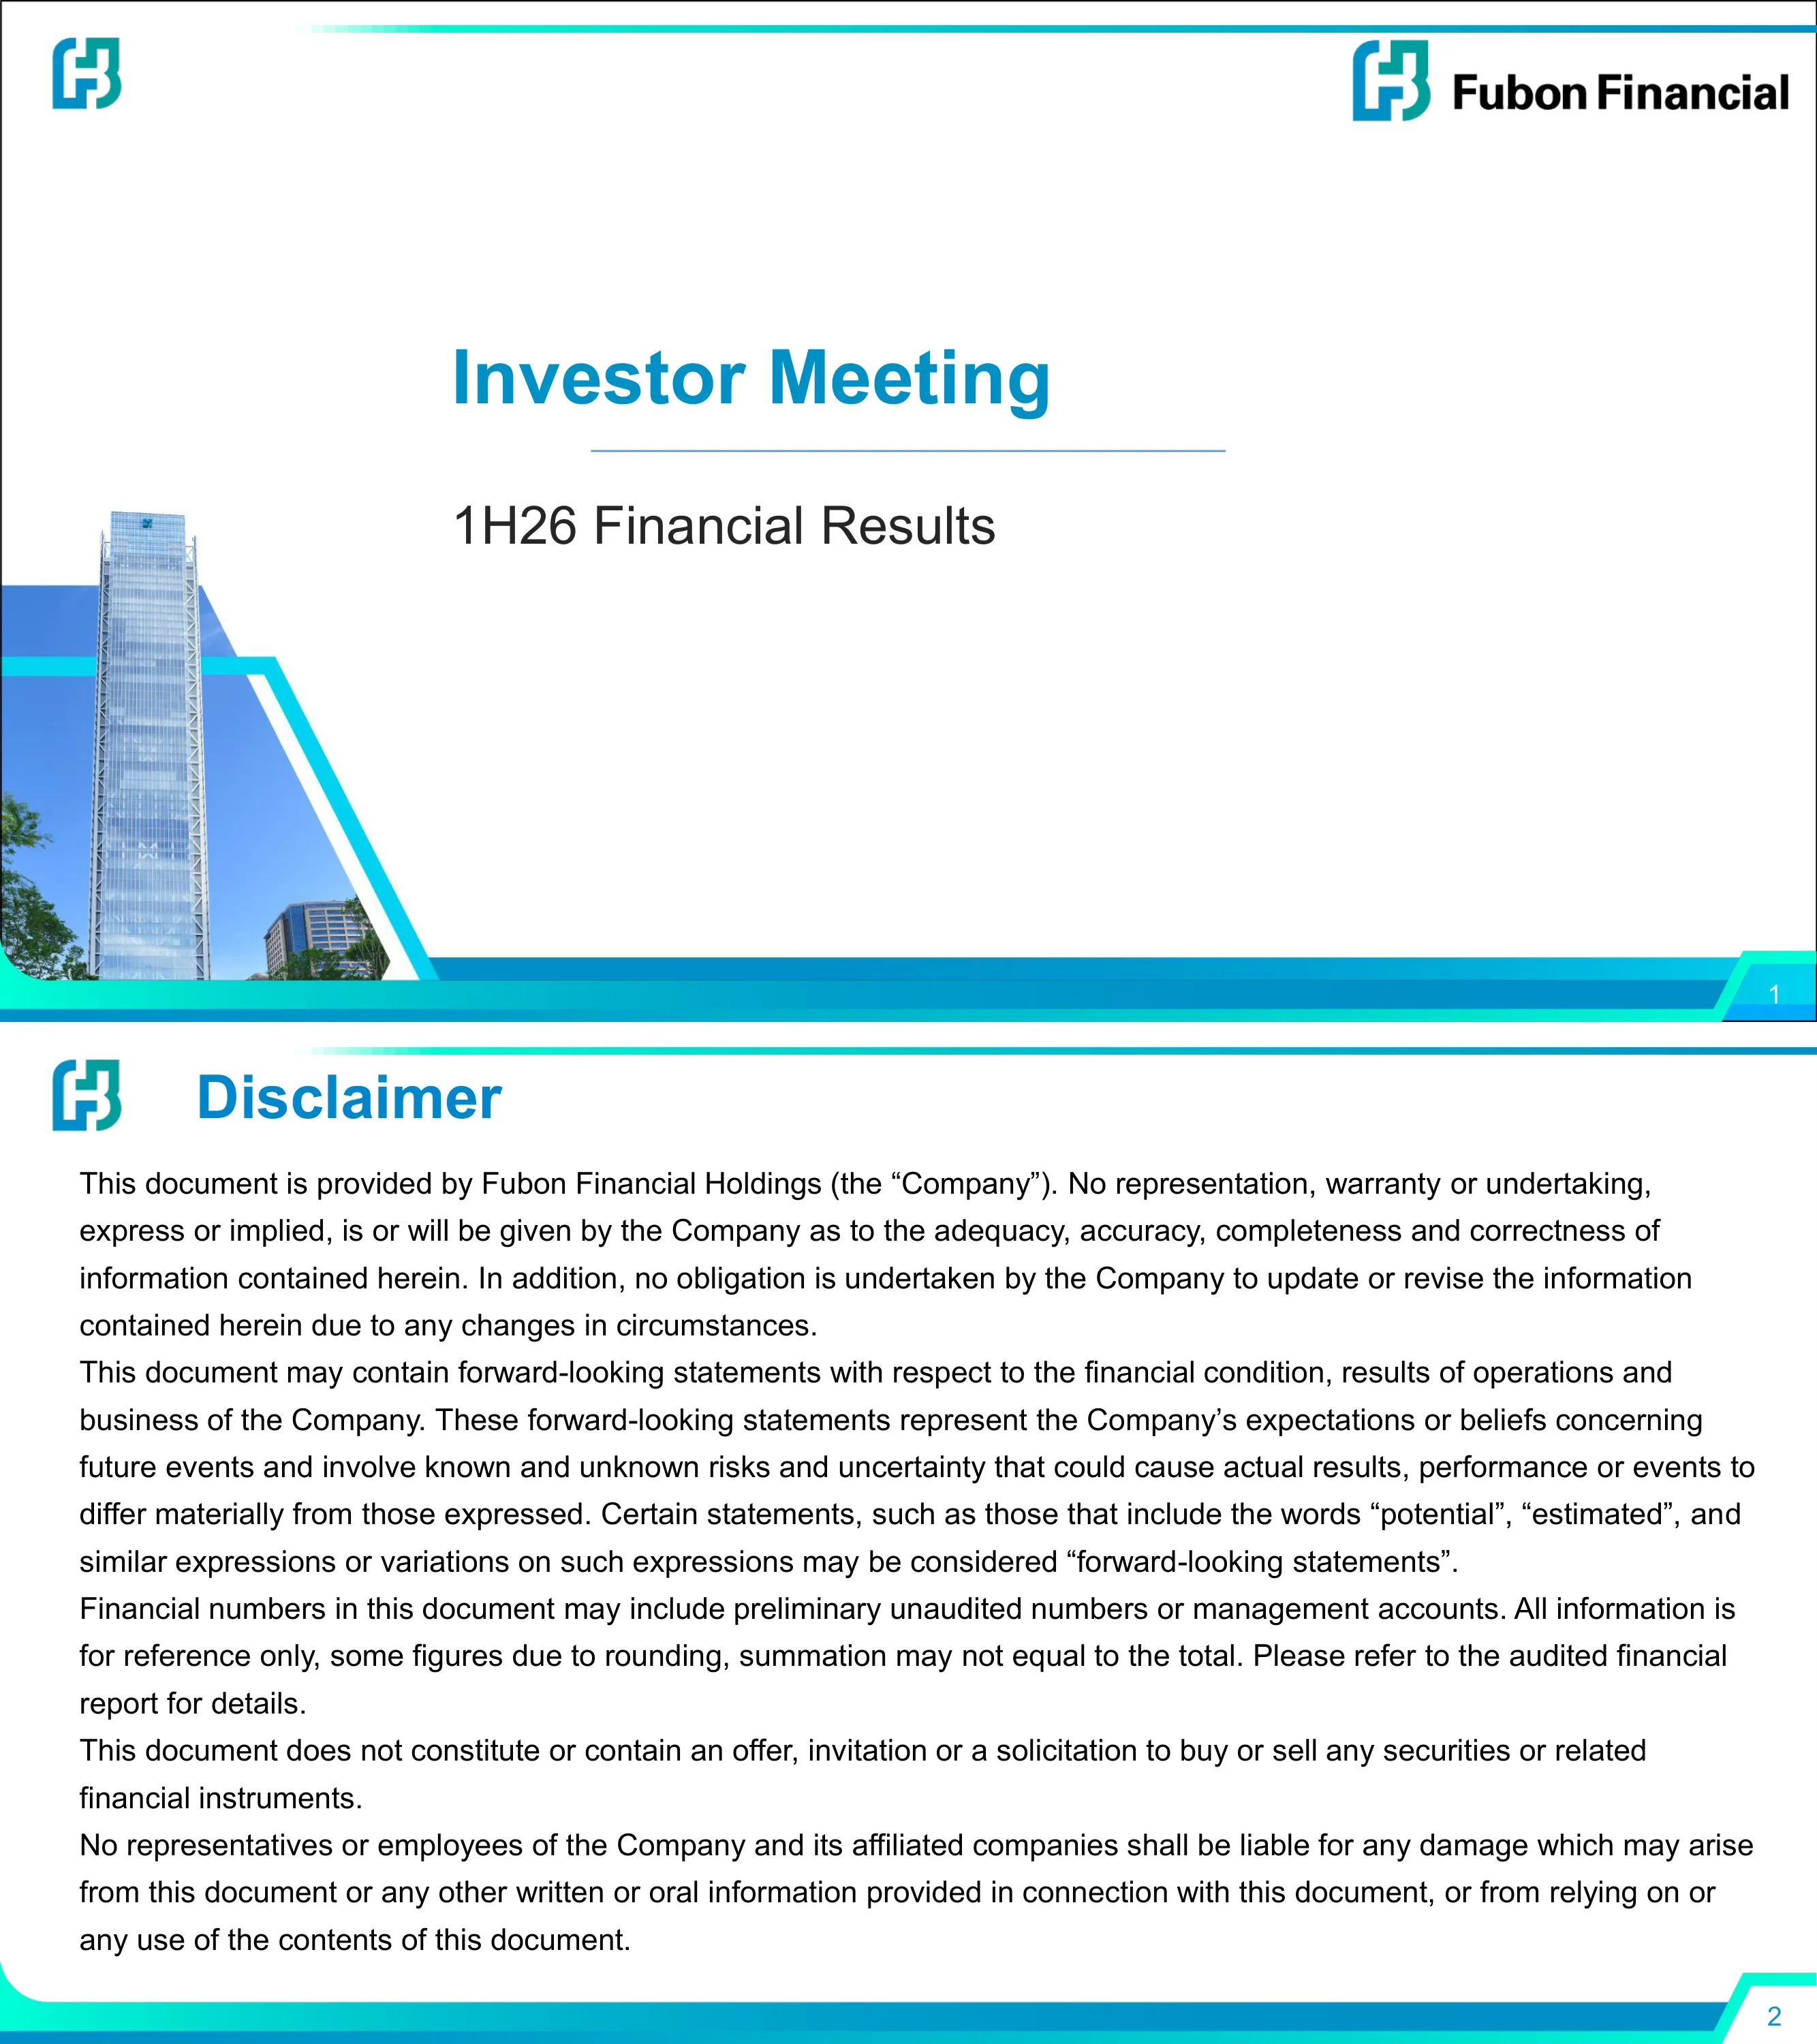
Cover of Fubon Financial's investor meeting deck on first-half 2026 financial results.
Centered title and subtitle with the Fubon Financial logo top-right and a photo of the Fubon tower in the lower-left corner.
Standard legal disclaimer: forward-looking statements, figures that may be preliminary and unaudited, and no offer of securities.
Full-width text block under a header.
Three pillars: leading market position across banking, life, securities and P&C; a sustainable dividend policy with solid capital and the highest net worth among peers; and ESG leadership, including an 'AA' MSCI ESG rating in the global insurance sector.
Three bold headers, each followed by bullet points.
Section divider opening the holding-company view.
Gray title panel beside a building photo.
#1 among FHC peers by net income and EPS; ROAA 1.47% and ROAE 18.00%; #1 market cap in the financial sector at over NT$2trn; #2 in total assets and #1 in net worth; 40%–50% total payout ratio and 3%–6% cash dividend yield over 10 years; 14.8mn customers.
Four-column KPI grid with colored headers and two stat tiles per column.
Subsidiary rankings: Fubon Life #1 life insurer, Fubon Insurance #1 P&C insurer, Taipei Fubon Bank #3 private bank, Fubon Securities #3 broker. Fubon leads the top 6 FHCs with a market cap of NT$2,115bn and 1H26 net income of NT$97.4bn plus NT$91.1bn of FVOCI gains (NT$188.5bn), on EPS of NT$6.67, or NT$13.17 including FVOCI gains.
Org chart strip on top; peer bar charts below for market cap and net income, with asset and EPS badges.
Fubon Life is #2 in total premium (14.0% share), FYP (11.1%) and FYPE (14.7%). Taipei Fubon Bank has deposit share of 6.1% and loan share of 5.7%, and is #2 in active cards (14.6%). Fubon Insurance is #1 with 24.9% of direct written premium. Fubon Securities is #3 in brokerage (7.14%) and #2 in margin loans (10.11%) and securities lending (21.26%).
Four tables in a 2x2 grid, one per subsidiary, with ranking and share columns.
Founded in 2001 as Taiwan's first FHC, Fubon completed the first FHC acquisition (Jih Sun) in 2021. The subsidiary timeline runs from Fubon Insurance (1961) to Fubon Bank (China) (2014). Fubon Life acquired ING in 2009 and held 88.5% of Fubon Hyundai Life as of 6M26.
Central circular wheel of six subsidiaries with founding years, surrounded by callout boxes.
Network as of 8M26 across banking, non-life, life, securities and asset management. Examples: Taipei Fubon Bank has 7 overseas branches and 2 rep offices; Fubon Bank (HK) has 16 branches; Fubon Bank (China) has 25 sites; Xiamen Bank has 124 sites; Fubon P&C Insurance has 40 offices in China.
Map of Asia with color-coded pins on the left; table of entities by business line on the right.
From 2001 to 2026: employees grew 2.9x to 57,286; net worth 8.6x to NT$1.27trn; market cap 12.7x to NT$2,115.1bn; total assets 12.5x to NT$13.8trn; net income 10.4x to NT$97.4bn, or 20.1x to NT$188.5bn including FVOCI gains. EPS has been the highest among Taiwan FHCs for 17 consecutive years.
Ascending 3D bar staircase ending in a large arrow labeled Year 2026.
Fubon FHC's share price since 2016 against TAIEX and the financial index (Jan 2002 = 100), annotated with events such as the Jih Sun acquisition and US tariffs. Total shareholder return is 75.8% (1yr), 69.2% (3yrs), 26.6% (5yrs) and 20.0% (10yrs). ROE was 12.2% in 2016 and 18.0% in 1H26.
Annotated line chart on the left, TSR box on the right, ROE table strip at the bottom.
Long-term ROE target is over 10%. Fubon's 2016–2025 average ROE of 12.1% ranks second among the top six FHCs, behind CTBC at 12.3%. Net income rose from NT$48.4bn in 2016 to NT$120.9bn in 2025; 1H26 net income was NT$97.4bn plus NT$91.1bn of FVOCI gains, with ROE of 18.00% (adjusted 34.83%).
Peer ROE bar chart top-right; combined bar and line chart of net income and ROE across the bottom.
1H26 net income of NT$97.4bn plus NT$91.1bn of FVOCI disposal G/L equals NT$188.5bn, against NT$51.4bn in 1H25. Net worth is NT$1,267.6bn; adding NT$359.1bn of after-tax CSM gives NT$1,626.7bn. BVPS is NT$83.7 (adjusted NT$109.3), up from NT$52.7.
Bullet text top-left with three stacked-bar charts in quadrants.
Dividend history for FY2016–2025: cash dividend rose from NT$2.0 to NT$4.25 in 2024 and 2025. Cash payout ratio was 50.8% for 2025, cash yield ranged 2.6%–5.0%, and the share price at announcement reached NT$90.00 for 2025.
Full-width multi-row table by fiscal year.
Capital ratios against regulatory minimums. Fubon Financial CAR: 120.1% (1H26) vs 147.2% (2025). Fubon Life: 140% TIS. Taipei Fubon Bank: Tier 1 13.3%, CAR 15.4%. Fubon Securities: CAR 243.8%. Fubon Insurance: 226.0% TIS. Fubon Bank (HK): CAR 17.8%. Fubon Bank (China): CAR 14.0%.
Single comparison table: entity, metric, 1H26, 2025, requirement.
A 14.6mn customer base drives cross-selling. Bancassurance FYP sold through the group reached NT$84,989mn in 1H26 (32% of Fubon Life FYP). Cross-sold premium was 25% of Fubon Insurance premium (NT$40,287mn). Cross-sold accounts were 30% of new Fubon Securities brokerage accounts (134.1k), and cross-sold cards 13% of new TFB credit cards (116k).
Four mini bar-and-line charts in a 2x2 grid with red callout percentages.
Section divider for Taiwan macro and market context.
Gray title panel beside a lobby photo.
Nominal GDP growth is 11.6% in 2025, 17.4% forecast for 2026F and 10.7% for 2027F. Exports grow 41.8% and imports 41.0% in 2026F. The 2026F GDP mix is consumption 39%, investment 26%, net exports 23% and government spending 11%.
Four charts in a 2x2 grid: grouped bars, grouped bars, line, pie.
Taiwan exports hit a record US$640bn in 2025 (+35%) and are forecast at US$904bn in 2026 (+42%). ICT and electronic components made up 74% of 2025 exports and 79% of 1–8M26 exports (US$452bn of US$574bn).
Stat boxes on the left; clustered bar chart with data table on the right.
GDP per capita reached US$39.5k in 2025, passing Japan and South Korea. Excess savings rose to NT$5.7tn (19.8% of GDP) and are projected at NT$11tn (29.5%) by 2027. The housing index stood at 168.77 in 2Q26, and TWSE plus TPEx market cap was NT$150,789bn (Aug-26).
Four charts in a 2x2 grid: line, bar plus line, line, bar.
Group exposure to AI and tech across five units. Bank: around 20% of corporate loans are AI/tech, with AI loans up 21% YoY. Life: 65% return on Taiwan equity investment, on AUM of NT$5.46trn. Non-life: 18.8% of commercial premiums come from AI/tech. Securities: top 3 underwriter. Asset management: AUM up 167% during 2023–Aug 26.
Five photo-topped columns, each with a headline stat and bullets.
TWSE earnings growth is forecast at 80.1% in 2026F (Elec index 90.3%). TWSE is up 65.5% 9M26 YTD (Elec 75.2%). P/E is 21.6x and 23.7x on 2026F, easing to 16.6x and 17.1x on 2027F. Tech is forecast to deliver 73.4% of earnings in 2026F.
Bullet text on top; line chart plus table on the left; two bar charts on the right.
Section divider for the Fubon Life strategic overview.
Gray title panel beside a building photo.
Fubon Life is #1 life insurer by net income and #2 in TP, FYP and RP. Total premium is NT$228.1bn (14.0% share), FYP NT$85.0bn (+35.1% YoY) and NB CSM NT$34.9bn (+11.4%). It is #2 in agency force and #1 in investment yield among major peers.
Four-column KPI grid with themed headers.
Five highlights: product offerings, distribution with agency force and bancassurance, lower COL and strong investment record, solid capital, and ROE outperformance.
Numbered arc of five banner rows next to the Fubon Life logo.
Total premium grew from NT$323.7bn (2023) to NT$367.4bn (2025), and from NT$192.3bn in 1H25 to NT$228.1bn in 1H26. In the 1H26 FYP mix, investment-linked rose to 32.8% while traditional regular-paid fell to 42.4%.
Stacked bar chart of total premium on top; 100% stacked FYP mix below.
1H26 FYP by channel: tied agents 53.1%, Taipei Fubon Bank 27.5%, external banks 10.2%. NB CSM rose 11.4% from NT$31.3bn to NT$34.9bn as the NB CSM margin fell from 76.3% to 65.7% and AFYP rose from NT$41.1bn to NT$53.1bn.
100% stacked channel bars on the left; NB CSM bar chart with a small table on the right.
COL compared with investment return, 2016–1H26. In 1H26, COL under IFRS 17 is 2.00%, investment return 8.20% and recurring return after hedge 2.36%, against COL of 3.11% and return of 4.90% in 2025.
Clustered bar chart of three metrics by year with a methodology footnote.
Fubon Life's equity-to-asset ratio rose from 9.8% (2023) to 15.3% (2Q26), against an early-warning indicator of 3%. As of 1Q26 market data, Fubon led peers at 11.5% vs KGI 10.4% and Cathay 8.2%.
Two side-by-side bar charts.
Fubon Life ROE has run above the industry average since 2016: 18.57% in 2024 vs industry 12.29%, and 10.07% in 2025 vs 6.80%. 1H26 ROE is 15.73%, or 40.53% including FVOCI gains; 1H26 industry data is NA.
Two-line chart above a data table.
Section divider for the Taipei Fubon Bank strategic overview.
Gray title panel beside a logo-sculpture photo.
As of 2Q26: deposit share 6.1% (#3 private), loan share 5.7% (#4), 5.86mn effective cards (#2), card spending NT$334bn (+13.3%), wealth management fees +44.2%, credit card fees +7.9%, NPL 0.11%, coverage 1113%, CAR 15.35%.
Four-column KPI grid.
Five highlights: margin expansion, cross-sale from the Costco card and the Jih Sun merger, wealth management and card fee synergies, overseas opportunities, and stable asset quality and capital.
Numbered arc of five banners next to the Taipei Fubon Bank logo.
NIM rose from 1.18% (1H25) to 1.30% (1H26), and the loan-to-deposit spread from 1.22% to 1.48%. The loan rate held at 3.04% while the deposit rate fell from 1.82% to 1.57%.
Two bar-and-line charts side by side with annual and half-year sections.
FX loans rose 27.3% from NT$365.5bn to NT$465.4bn, and SME credit 11.8% from NT$420.6bn to NT$470.3bn (38.4% of corporate credit), comparing 1H25 with 1H26.
Two bar charts with growth callouts.
Customers grew from 6.62mn (2021) to 9.49mn (1H26). Retail AUM grew at a 10.7% CAGR to NT$3.57tn in 2025, and rose 10.9% YoY to NT$3.77tn in 1H26.
Two bar charts with a CAGR arrow and growth bubble.
Wealth management fees rose 44.2% from NT$10,040mn to NT$14,475mn in 1H26, with insurance commission at NT$7,021mn. Customer AUM is 59% deposits, 22% investments and 19% insurance.
Stacked bar chart on the left; pie chart on the right.
Overseas branch net revenue rose 7.1% to NT$5.33bn and net profit 3.5% to NT$3.36bn, or 13.1% of bank profit. The Tokyo branch opened in May and Sydney in July; India is planned by the end of 2026.
Bullets on top; two bar charts below.
At Jun-26: NPL 0.11% vs industry 0.14%; coverage 1113% vs 940%; personal unsecured NPL 0.17%. CET-1 is 11.7%, Tier-1 13.3% and CAR 15.4%, against D-SIB requirements of 11.0%, 12.5% and 14.5%.
Four charts in a 2x2 grid.
Section divider for the non-bank, non-life subsidiaries.
Gray title panel beside a lobby photo.
Three highlights: #1 in Taiwan for over 40 years, over 20% share across business lines, and an underwriting track record that outperforms.
Numbered arc of three banners.
Direct written premium was NT$40.3bn as of Jun-26: auto 38.7%, commercial fire 16.1%, accident and health 14.9%. Market share is above 20% in every line, e.g. A&H 31.9% and marine 29.4%.
Donut chart on the left; horizontal bar chart with a 20% reference line on the right.
Net combined ratio, 2016–1H26: 83.9% in 2025 and 86.9% in 1H26 under IFRS 17, with a 237.1% spike in 2022 from Covid policies. Market share rose to 24.9% in 1H26.
Stacked bar chart of claim and expense ratios with a market share table row.
Three highlights: top-3 share and profit, scale and ROE gains from the Jih Sun Securities merger, and a brokerage focus through segmentation and platform optimization.
Numbered arc of three banners.
1H26 net income was NT$11,016mn (+171.8%), above full-year 2025 (NT$10,591mn). Operating revenue was NT$19,318mn vs NT$8,777mn. Shares: brokerage 7.14% (#3), margin loans 10.11% (#2), securities lending 21.26% (#2).
Bullets top-left, market share tiles top-right, revenue and net income bar charts below.
ROE tracks market turnover: 30.85% in 1H26, with average daily turnover of NT$1,269bn and TAIEX up 17,162 points YTD, against 16.49% ROE and NT$533bn turnover in 2025.
Combined bar chart with two lines.
Three highlights: top-4 AUM in Taiwan, a product range covering Vietnam, India, Japan, the US and HK/China, and growth from ETF and fund demand.
Numbered arc of three banners.
AUM grew from NT$593bn (2023) to NT$1,601bn (Jun-26), a 48.7% CAGR. 1H26 net income was NT$892mn with 36.5% ROE. Mutual funds are 91.2% of AUM, and ETF and index funds 83.8% of the NT$1,461bn in funds and ETFs.
Bullets plus net income/ROE chart on top; AUM bars and two donut charts below.
Investor relations contact with QR codes and tickers: TWSE 2881.TT, LUXSE GDR RegS FFHCR LX, GDR 144A FUISY US.
Logo and two QR codes above a ticker strip, with a tower image on the right.
Cover of the second embedded deck, the 1H26 Interim Results presentation dated 24 August 2026. Page numbering restarts here.
Cover layout matching page 1.
Same legal disclaimer as page 2, repeated for the interim results deck.
Full-width text block.
Agenda: performance highlights of Fubon Financial Holdings, then reviews of Fubon Life, Taipei Fubon Bank, Fubon Securities, Fubon Insurance and overseas banking operations.
Bulleted agenda beside a tower photo.
Section divider for group-level results.
Gray title panel beside a building photo.
FHC: net income NT$97.39bn, EPS NT$6.67, combined NT$188.46bn (NT$13.17/share), assets above NT$13.7tn (+15.7%). Life: NT$55.63bn, combined NT$143.29bn, FX reserve NT$153.7bn. Bank: NT$25.74bn (+31.9%). Securities: NT$11.02bn (+171.8%). Insurance: NT$5.58bn, combined ratio 86.9%.
Five rows, each a blue entity label with gray bullet panels.
Net income rose from NT$51.4bn (1H25) to NT$97.4bn plus NT$91.1bn of FVOCI gains, a record NT$188.5bn. EPS rose from NT$3.40 to NT$6.67, plus NT$6.50 from FVOCI gains, for NT$13.17.
Bullets above two stacked-bar charts.
All subsidiaries grew: FHC +266.8% (NT$188.5bn combined), Fubon Life +482.7% (NT$143.3bn), TFB +31.9% (NT$25.7bn), Securities +171.8% (NT$11.0bn), Insurance +156.8% (NT$7.4bn), Fubon Bank (HK) +22.4%, Fubon Bank (China) +33.1%.
Grouped bar chart across seven entities with growth bubbles and footnotes.
Total assets rose 15.7% from NT$11,902.1bn to NT$13,765.4bn. Net worth is NT$1,267.6bn (+55.3%), or NT$1,626.7bn adjusted; BVPS is NT$83.7 (adjusted NT$109.3).
Bullets top-left with three bar charts.
Annualized ROAA is 1.47% (adjusted 2.85%) vs 0.85% in 1H25. ROAE is 18.00% (adjusted 34.83%) vs 11.63%.
Two stacked-bar charts side by side.
TIME World's Most Sustainable Companies (No.158 globally, 3 years running), MSCI ESG AA, FTSE4Good TIP Taiwan constituent for 12 years, Global Views ESG award, and Global Finance Innovators 2026 awards.
Award rows with logos on the left, bullets in the middle, photos on the right.
Section divider for Fubon Life results.
Gray title panel beside a building photo.
FYP NT$85.0bn (+35.1%), NB CSM NT$34.9bn (+11.4%), CSM balance NT$428.9bn (+6.4% YTD). Net income NT$55.6bn plus FVOCI NT$87.7bn equals NT$143.3bn. Net worth NT$883.4bn, adjusted NT$1,226.5bn; E/A 15.3%, adjusted 21.2%.
Three horizontal KPI bands for business, financial and net worth.
Waterfall: insurance service result NT$19.8bn (CSM/RA release 17.2), financial result NT$54.0bn (recurring income 85.1, other investment income 61.1, insurance finance expense -92.2). Net income NT$55.6bn plus FVOCI NT$87.7bn equals NT$143.3bn; ROE 15.73%, adjusted 40.53%.
Full-width waterfall chart with group headers.
1H26 FYP rose 35.1% to NT$85.0bn, renewal premium 10.6% to NT$143.1bn and total premium 18.6% to NT$228.1bn. Fubon Life is second largest in each.
Stacked bars for 1H and full-year periods with growth bubbles.
Non-NTD share (excluding investment-linked) rose from 61.5% to 76.1%; regular-paid share fell from 63.2% to 49.3%. FYP from tied agents rose 42.3% and from TFB 82.7%; internal channels supplied about 85.5% of FYP.
Bullets above two 100% stacked charts with a small table.
FYPE fell 5.3% from NT$30.4bn to NT$28.8bn as the mix shifted to single-premium products. FYPE/FYP is 33.9% vs an industry average of 25.6%; tied agents supply 49.2% of FYPE.
Two stacked-bar charts.
CSM roll-forward: NT$403.2bn at 1/1, plus NB CSM 34.9, expected return 3.4 and variance 2.5, less release of 15.1, gives NT$428.9bn at 6/30 (+6.4% YTD). The release rate is about 3.4%; the NB CSM margin is 65.7%.
Waterfall chart on the left; NB CSM bar chart with table on the right.
Total investment rose from NT$5,165.0bn to NT$5,462.7bn, with a 9.18% return. Overseas fixed income is 50.0% (3.98% return) and domestic equity 12.1% (65.25% return). The asset classification is 48% AC, 42% FVOCI and 10% FVTPL.
Allocation table with returns on the left; stacked classification bars on the right.
At Jun-26: corporate credit 52.4%, financial bonds 35.7%, government bonds 11.1%. By region: North America 54.3%, Asia and others 27.1%, Europe 18.6%.
Two 100% stacked charts over three dates.
1H26 net investment income was NT$138.3bn (return 5.35% after hedge and FX); adding NT$99.6bn of pre-tax FVOCI disposal gains gives NT$237.9bn (9.18%). In 1H25, investment income was NT$89.5bn (3.76%).
Two side-by-side income tables for 1H25 and 1H26.
1H26 hedging cost was -124bps (CS+NDF -48bps, FX/reserve -76bps). The FX reserve grew from NT$51.6bn (Jun-25) to NT$153.7bn (Jun-26). FX exposure: naked USD and other currencies 60.9%, currency swaps and NDF 24.6%.
Hedging-cost bars and reserve bars on the left; exposure bar and pie on the right.
COL fell from 2.61% to 2.00%. Total return rose from 3.76% to 9.18% (8.20% excluding par policies). Recurring return after hedge rose from 2.36% to 2.89%, and after FX provision to 2.42%.
Three bar charts side by side.
The FVOCI unrealized balance moved from NT$-100.5bn at 1/1 to NT$20.8bn at 6/30. Net worth rose from NT$530.8bn to NT$883.4bn (net income 55.6, FVOCI 209.0, liability valuation 102.0); adding CSM of 343.1 gives adjusted NT$1,226.5bn. E/A rose from 9.7% to 15.3%.
Two stacked waterfall charts.
Section divider for Taipei Fubon Bank results.
Gray title panel beside a logo-sculpture photo.
Net revenue rose 25.8% from NT$42.4bn to NT$53.3bn; net interest income grew 27.3% to NT$27.3bn and net fee income 39.5% to NT$17.0bn (31.9% of revenue). Full-year revenue was NT$85.5bn in 2025.
Stacked bars for 1H and annual periods.
Total credit rose 14.9% to NT$2,752.4bn: retail NT$1,512.0bn (+15.4%), corporate NT$1,226.0bn (+15.2%), government loans NT$14.5bn.
Stacked bars for Jun-25 vs Jun-26 and Dec-23 to Dec-25.
NTD corporate credit rose 8.9% to NT$760.5bn and FX credit 27.3% to NT$465.4bn (38.0% of corporate). SME credit rose 11.8% to NT$470.3bn.
Grouped bar chart on the left; bar-and-line chart on the right.
Mortgages rose 11.6% to NT$1,305.4bn. Other personal loans rose 47.1% to NT$206.6bn, with unsecured consumer loans at NT$139.8bn (+42.9%).
Bar chart on the left; stacked bars on the right.
Deposits rose 15.3%, and NTD deposits 21.0% to NT$2,739.2bn. NTD LDR fell to 82.1%. FX deposits are NT$1,294.1bn; the FX loan-to-deposit ratio is 35.8% (90.9% including bonds).
Four charts in a 2x2 grid.
NIM rose 12bps to 1.30%; the loan-to-deposit spread rose 26bps to 1.48%. Quarterly NIM rose from 1.21% (2Q25) to 1.33% (2Q26) as the deposit rate fell from 1.78% to 1.55%.
Four bar charts in a 2x2 grid: half-year and quarterly.
NPL is 0.11% (industry 0.14%) and coverage 1113% (940%). Quarterly provision fell to NT$726mn in 2Q26, for an annualized credit cost of 0.11%.
Four charts in a 2x2 grid.
Active cards are 5,858k (14.6% share). Card spending rose 13.3% to NT$334,348mn, while spending share is shown falling from 13.1% to 11.60%. Monthly spend per card is NT$9,510 (+11.7%); card NPL is 0.14% vs industry 0.16%.
Four charts in a 2x2 grid.
Net fee income rose 39.5% to NT$16,971mn: wealth management NT$14,475mn (+44.2%), credit cards NT$1,362mn. Insurance commission was NT$7,021mn and mutual funds NT$4,927mn.
Two stacked-bar charts.
Overseas deposits rose 24.8% to NT$516bn and loans 32.1% to NT$210bn. Net revenue was NT$5.33bn (+7.1%) and net income NT$3.36bn (+3.5%).
Four bar charts in a 2x2 grid.
Section divider for Fubon Securities results.
Gray title panel beside an office-tower photo.
Net income rose 171.8% to NT$11,016mn; operating revenue rose 120.1% to NT$19,318mn, with brokerage and wealth management up 145.6% to NT$13,040mn. Brokerage share rose from 6.70% to 7.14%, and the 'Fubon AI PRO' app was promoted.
Bullets and a share table on top; revenue and net income bar charts below.
Section divider for Fubon Insurance results.
Gray title panel beside a lobby photo.
Market share 24.9%; net combined ratio 86.9%. Insurance service result NT$4,796.9mn and financial result NT$1,944.8mn. Net income NT$5,581.5mn plus FVOCI NT$1,832.2mn equals NT$7,413.7mn. Net worth NT$38,163.7mn, E/A 29.8%, TIS 253.9%.
Three horizontal KPI bands.
Direct written premiums rose 8.2% from NT$37.2bn to NT$40.3bn (commercial 44.0%). The net combined ratio improved from 89.4% (1H25 restated under IFRS 17) to 86.9%; it was 82.1% under IFRS 4.
Two stacked-bar charts.
Section divider for Fubon Bank (Hong Kong) and Fubon Bank (China).
Gray title panel beside a skyscraper photo.
Loans rose 29.1% to HK$96bn and deposits 19.3% to HK$175bn. NIM is 1.70% (-2bps). Net income rose 24.3% to HK$887mn. NPL fell from 1.33% to 0.76%; coverage is 77.4%.
Four charts in a 2x2 grid.
Loans rose 15.6% to RMB88bn and deposits 17.4% to RMB118bn. NIM is 2.55% (+15bps), or 2.66% including swaps (-9bps). Net income rose 26.6% to RMB381mn. NPL is 0.82% and coverage 187.0%.
Four charts in a 2x2 grid.
Closing contact page of the interim deck, with QR codes and tickers 2881.TT, FFHCR LX and FUISY US.
Same layout as page 49.
1H26 results against 2026 goals: green finance NT$3,475.3bn (goal NT$3,008.0bn), green bond underwriting participation 75% (40%), operational carbon reduction -17% (-25.29%), customer satisfaction 89.8% (90%), online bank applications 91.22% (90%).
Two indicator tables with icons and check marks for achieved targets.
Female employees 62.3% and female managers 56.1%; employee volunteer hours 37,117 against a goal of 25,500; anti-fraud outreach 2,425,775; micro-insurance cases 21,275 against a goal of 100,000; employee engagement score under analysis.
Two indicator tables with icons.
IFRS 17 1H26: net revenue NT$172,468mn, net income attributable NT$97,391mn plus FVOCI NT$91,068mn equals NT$188,459mn; total assets NT$13,765,403mn; ROE 18.00%; CAR 142.30%. Comparatives under IFRS 4: 1H25 net income NT$51,384mn; 2025 NT$120,944mn.
Two side-by-side financial tables (IFRS 17 and IFRS 4) on a landscape sheet.
IFRS 17 1H26: insurance service result NT$19,764mn, financial result NT$54,007mn, net income attributable NT$55,625mn (NT$143,291mn with FVOCI); CSM NT$435,132mn; adjusted net worth NT$1,226,511mn; ROE 15.73%. IFRS 4 comparatives: 1H25 net income NT$24,591mn; RBC 434% in 2025.
Two side-by-side financial tables.
1H26: net interest income NT$35,292mn (+27.5%), net fee income NT$13,477mn (+40.4%), total net revenue NT$58,400mn (+22.1%), net income to parent NT$25,744mn (+31.9%); loans NT$3,095,017mn; ROE 15.87%; NPL 0.11%; BIS 15.35%.
Single wide financial table with half-year, quarterly and annual columns.
1H26: brokerage commissions NT$12,997mn (+146.6%), total operating revenue NT$21,942mn (+118.3%), net income NT$11,016mn (+171.7%); margin loans NT$79,956mn (+172.9%); ROE 30.85%; CAR 244%.
Single wide financial table.
IFRS 17 1H26: insurance service result NT$4,797mn, net income attributable NT$5,581mn (NT$7,414mn with FVOCI), equity NT$38,164mn, ROE 33.01%, TIS shown as 2.5391 (253.9%). IFRS 4 1H25: direct written premiums NT$39,188mn and net income to parent NT$2,887mn.
Two side-by-side financial tables.
In HK$mn for 1H26: net interest income 1,564 (+16.3%), total revenue 1,838, net income 887 (+24.3%), loans 95,956, deposits 174,551; ROE 9.78%, NPL 0.76%, BIS 18.25%.
Single financial table with half-year and annual columns.
In RMB mn for 1H26: net interest income 1,737 (+21.7%), provision -274 (-49.3%), net income 381 (+26.6%), deposits 118,197, total assets 165,185; ROE 8.40%, NPL 0.82%, LDR 86.70%, BIS 13.98%.
Single financial table with half-year, quarterly and annual columns.
Preguntas comunes sobre esta diapositiva y el contenido de la presentación subyacente.
It is Fubon Financial Holding's (TWSE: 2881) English-language investor meeting deck on first-half 2026 (1H26) results. The 101 pages combine a strategic investor-meeting deck (pages 1–49) with the 1H26 Interim Results deck dated 24 August 2026 (pages 50–101), which includes financial summary appendices for the group and six subsidiaries.
This is the English version filed on Taiwan's Market Observation Post System (MOPS, https://mops.twse.com.tw/) for Fubon's investor conference (法說會) held around November 2026. Taiwan-listed companies usually also file a Chinese-language version on MOPS, so check there for the Chinese deck.
The financial results are for the first half of 2026 (1H26, to 30 June 2026), presented at the November 2026 investor meeting. A few slides use later dates: market cap and shareholder return as of 30 September 2026, and the Asia footprint and some AI-sector data as of August 2026. The deck does not contain third-quarter results.
Net income was NT$97.39 billion (New Taiwan dollars), with EPS of NT$6.67. Adding NT$91.07 billion of FVOCI equity disposal gains gives NT$188.46 billion, or NT$13.17 per share, a record for a first half. Total assets exceeded NT$13.7 trillion (+15.7% YoY). Net worth was NT$1,267.6 billion and adjusted net worth NT$1,626.7 billion. ROAE was 18.00%, or 34.83% adjusted.
1H26 figures are under IFRS 17 and IFRS 9, while 1H25 comparatives are under IFRS 4 with the IFRS 9 overlay approach. Because of this, the deck shows net income alongside FVOCI equity disposal gains and adds after-tax CSM to calculate adjusted net worth and BVPS. Footnotes give restated 1H25 figures, and the appendix tables split IFRS 17 and IFRS 4 data.
Fubon Life (life insurance), Taipei Fubon Bank, Fubon Insurance (P&C), Fubon Securities, Fubon Asset Management, Fubon Bank (Hong Kong) and Fubon Bank (China). Topics include CSM, FYP, investment return, the FX reserve, NIM, credit mix, asset quality, the combined ratio, brokerage share and AUM.
Yes, as a design reference. It shows a clean investor-relations format: KPI grids, numbered highlight wheels, waterfall charts for profit and CSM roll-forwards, stacked bar comparisons, peer benchmarks, ESG scorecards and appendix financial tables. Replace Fubon's data and branding with your own.
Analysts and investors covering Taiwan financials, IR and finance teams at banks and insurers looking for an IFRS 17 reporting example, and researchers studying Taiwan's financial holding companies, life insurers' FX hedging, or the AI-driven Taiwan economy.
Official filing platform where Taiwan-listed companies, including Fubon Financial (2881), file investor conference materials in English and Chinese.

Create Your Own Slides
Turn your ideas into professional presentations in seconds with 2slides AI.
Referencia diseños profesionales, elige tu estilo y genera diapositivas con renderizado de texto perfecto. Impulsado por Nano Banana—comienza a crear tu presentación ahora.
Tu Agente IA para diapositivas. Ahorra tiempo, brilla más rápido con la creación inteligente de presentaciones.


© 2026 2slides. Todos los derechos reservados.