
Forma parte de Ejemplos de presentaciones para inversores · Ejemplos de presentaciones para inversores de Japón
Daiwa Securities Group H1 FY2026 Earnings Presentation (fiscal Q2, April–September 2026): a 36-page Japanese-language results deck (2026年度 第2四半期 決算説明資料) dated October 30, 2026 and published on TDnet, the Tokyo Stock Exchange's Timely Disclosure network. It reports record first-half ordinary income of ¥166.3 billion (+69.9% YoY) and net income attributable to owners of ¥107.8 billion (+36.6%), net operating revenues of ¥444.3 billion (+35.5%), base profit of ¥125.2 billion against a ¥150 billion medium-term target, an annualized ROE of 12.0%, a record interim dividend of ¥39, and the first quarter of consolidating ORIX Bank into the Wealth Management division.
Usa la portada de esta presentación como referencia de estilo para diapositivas creadas con tu propio contenido. O elige cualquier página de abajo para usar su diseño como referencia.
Navegación Rápida
Etiquetas
Compartir las diapositivas
Daiwa Securities Group H1 FY2026 Earnings Presentation (fiscal Q2, April–September 2026): a 36-page Japanese-language results deck (2026年度 第2四半期 決算説明資料) dated October 30, 2026 and published on TDnet, the Tokyo Stock Exchange's Timely Disclosure network. It reports record first-half ordinary income of ¥166.3 billion (+69.9% YoY) and net income attributable to owners of ¥107.8 billion (+36.6%), net operating revenues of ¥444.3 billion (+35.5%), base profit of ¥125.2 billion against a ¥150 billion medium-term target, an annualized ROE of 12.0%, a record interim dividend of ¥39, and the first quarter of consolidating ORIX Bank into the Wealth Management division.
Vista detallada de cada página de diapositiva, incluyendo diseño, contenido clave y elementos visuales.
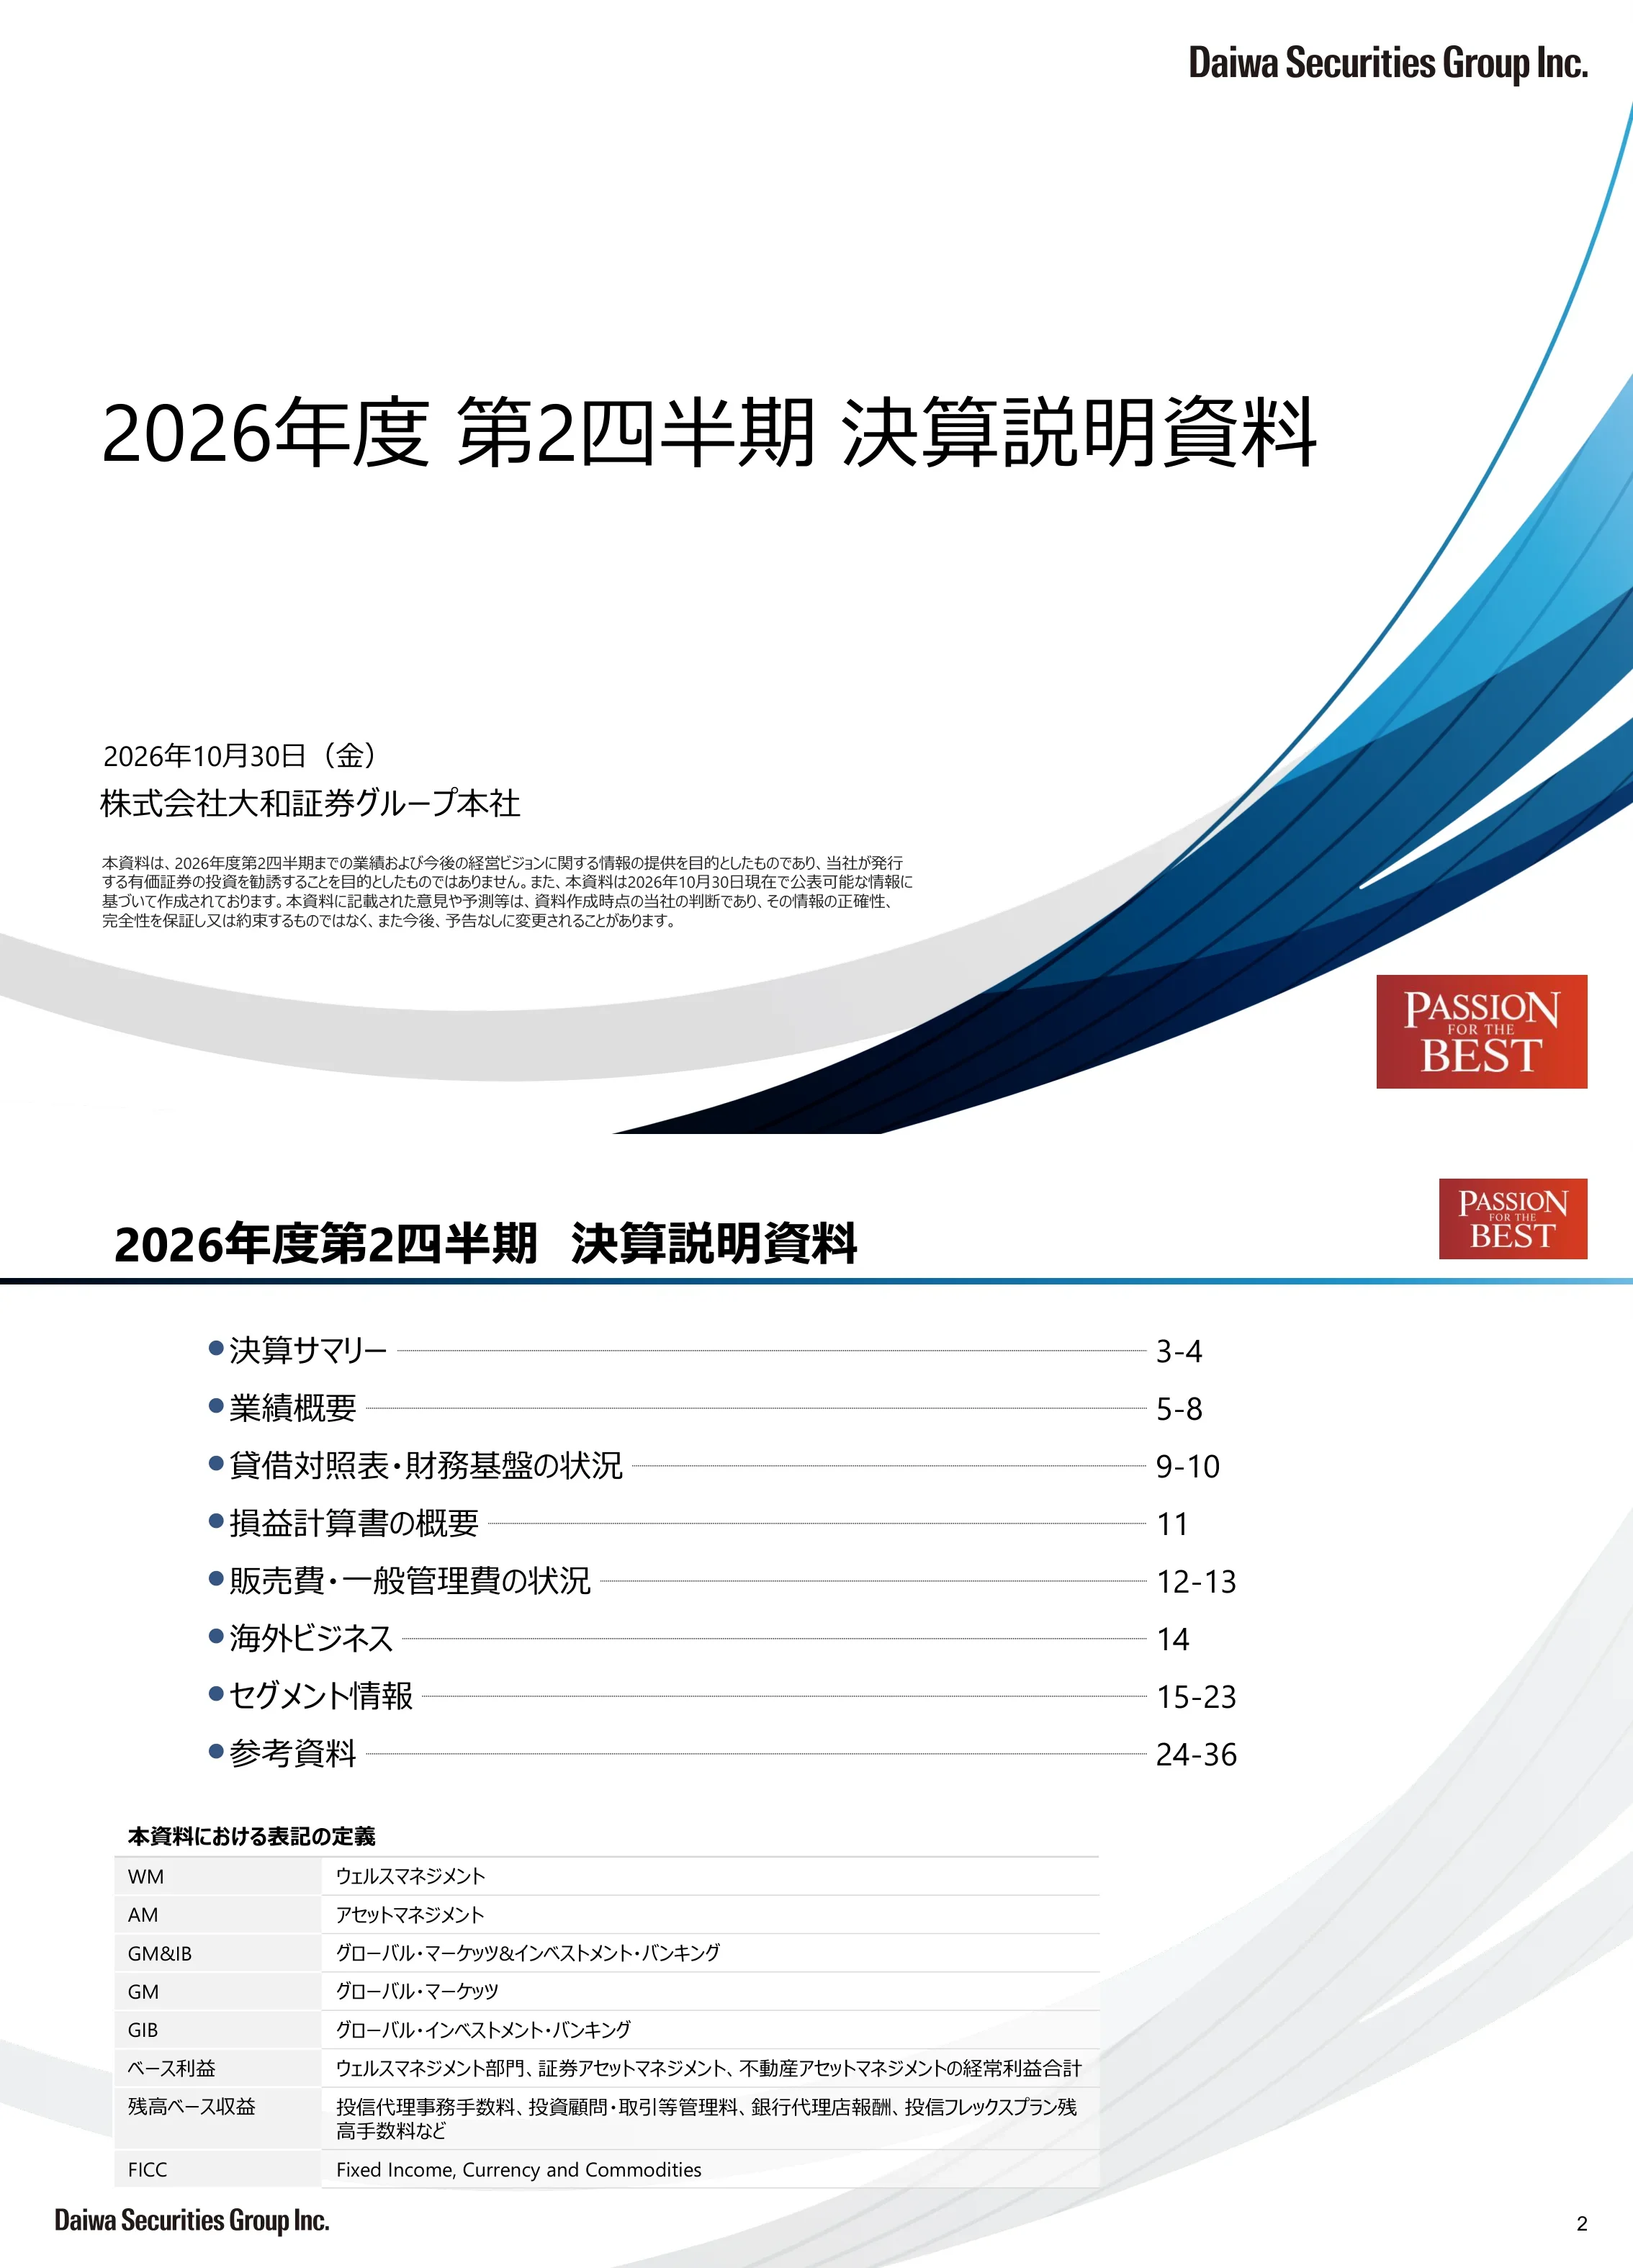
Title slide for Daiwa Securities Group Inc.'s fiscal 2026 second-quarter results materials, dated Friday, October 30, 2026, with a Japanese disclaimer that the document is for information on results through Q2 and management vision, not a solicitation to invest, and reflects information available as of October 30, 2026.
Large Japanese title left-aligned in the middle, date and company name below, small-print disclaimer at the bottom, sweeping blue ribbon graphic on the right edge, Daiwa wordmark top right and red PASSION FOR THE BEST badge bottom right.
Agenda listing results summary (p.3-4), performance overview (5-8), balance sheet and financial base (9-10), income statement (11), SG&A (12-13), overseas business (14), segment information (15-23) and appendix (24-36). A glossary defines WM (Wealth Management), AM (Asset Management), GM&IB (Global Markets & Investment Banking), GM, GIB, base profit (ordinary income of WM, securities AM and real estate AM), stock-based revenue (fund agency fees, advisory/account management fees, bank agency fees, etc.) and FICC.
Bulleted table of contents with dotted leaders and page ranges in the upper half; two-column definitions table in the lower half.
Headline: ordinary income and net income are first-half records and every division grew profit; earnings power has stepped up and ORIX Bank consolidation adds stability. H1 net operating revenues ¥444.3 billion (4,443億円, +35.5%), ordinary income ¥166.3 billion (+69.9%), net income attributable to owners ¥107.8 billion (+36.6%). Base profit ¥125.2 billion (+60.2%), already over 80% of the ¥150 billion medium-term plan target. WM ordinary income ¥77.0 billion (+56.2%, half-year record) with record stock-based revenue of ¥74.2 billion; Daiwa Next Bank ordinary income ¥21.9 billion (+117.8%) with ORIX Bank consolidated from Q2 (July–September). AM ordinary income ¥54.2 billion (+102.1%), with securities AM AUM and profit at records. GM&IB ordinary income ¥38.4 billion (+93.8%). H1 ROE 12.0%. Record interim dividend of ¥39 (payout ratio 50.3%).
Underlined two-line headline, a three-row comparison table (H1 FY2026 vs H1 FY2025 vs YoY change) on navy headers, then square-bulleted divisional highlights and an underlined dividend callout at the bottom, all on a light grey-blue panel.
Despite market conditions, recurring profits from wrap accounts and equity investment trusts kept building; annualized Q2 ROE 11.3%. Q2 net operating revenues ¥223.9 billion (2,239億円, +1.6% QoQ), ordinary income ¥78.2 billion (-11.2%), net income ¥51.4 billion (-8.8%). WM (Daiwa Securities) profit fell on market correction but stock-based revenue hit a record; AM AUM reached a record while alternative AM capital gains fell; GM was down on weaker overseas FICC while GIB grew on debt underwriting and domestic M&A; ORIX Bank's three months were consolidated from Q2. Three bar charts show nine quarters (FY2024 Q2 to FY2026 Q2) of net operating revenues (161.0 to 223.9), ordinary income (72.8 to 88.0 peak in Q1 then 78.2) and net income (53.7 to 56.4 in Q1 then 51.4), in ¥ billion.
Headline and QoQ table with four bullets in a top panel; three equal-width light-blue bar charts across the bottom with navy title bars.
Quarterly table in ¥ million: Q2 operating revenues 431,090; net operating revenues 223,902; SG&A 152,986; ordinary income 78,262; net income 51,431. H1 totals: operating revenues 865,454 (+23.3%), net operating revenues 444,301 (+35.5%), SG&A 295,873 (+22.3%), ordinary income 166,352 (+69.9%), net income 107,846 (+36.6%). Total assets ¥40.41 trillion, net assets ¥2.12 trillion, shareholders' equity ¥1.84 trillion. Q2 EPS ¥36.90 (H1 ¥77.57), BPS ¥1,318.82, annualized ROE 11.3% (H1 12.0%). Boxes show the FY2026 interim dividend of ¥39 and, for reference, the FY2024–2026 minimum annual dividend of ¥44.
Wide financial table with quarterly columns, QoQ and YoY change columns, H1 comparison and FY2025 full-year column; current quarter and H1 shaded light blue; two dividend boxes underneath.
Net operating revenues and ordinary income by segment in ¥ million. Q2 net operating revenues: WM 99,259 (WM HQ/Daiwa Securities 72,662; Daiwa Next Bank 24,940, +151.3% QoQ), AM 38,013 (securities AM 22,941, real estate AM 12,035, alternative AM 3,036), GM&IB 69,137 (GM 45,712, GIB 23,424). Q2 ordinary income: WM 39,737, AM 23,879, GM&IB 15,786, consolidated 78,262; base profit 62,384 (-0.7% QoQ, +41.9% YoY). H1 base profit 125,205 (+60.2%). Footnote: from Q2 Daiwa Next Bank figures include ORIX Bank, with ordinary income after goodwill amortization.
Two stacked segment tables (net operating revenues above, ordinary income below) with the same column structure as the consolidated overview; sub-segments indented.
Four combo charts in ¥ billion for FY2025 Q1 to FY2026 Q2. WM net operating revenues rose steadily from 62.9 to 99.2, with ordinary income from 19.7 to 39.7. AM net operating revenues 38.0 in Q2 (40.9 in Q1) with ordinary income 23.8 (30.3 in Q1). GM&IB revenues 69.1 (76.5 in Q1) with ordinary income 15.7 (22.7 in Q1). Consolidated ordinary income 78.2 versus 88.0 in Q1, with base profit 62.3 versus 62.8.
2x2 grid of stacked bar charts with red line overlays for ordinary income; each quadrant has a navy title bar, the consolidated chart has a grey title bar.
Q2 base profit was ¥62.3 billion (+41.9% YoY, -0.7% QoQ) and the H1 total of ¥125.2 billion exceeds 80% of the ¥150 billion medium-term plan target. Annual chart in ¥ billion: consolidated ordinary income 135.8 (FY2021), 86.9 (FY2022), 174.5 (FY2023), 224.7 (FY2024), 234.5 (FY2025) and 166.3 for H1 FY2026; base profit 87.8, 73.1, 114.2, 137.5, 182.7 and 125.2. A quarterly chart from FY2021 Q1 shows Q2 FY2026 ordinary income of 78.2, made up of WM 39.7, securities AM 12.8 and real estate AM 9.8 for base profit of 62.3.
Two bold bullet headlines on top; side-by-side annual and quarterly stacked bar charts with a red base-profit line; dashed divider separating the H1 FY2026 bar.
Balance sheet in ¥ billion: total assets 40,407 (+2,329 vs March end), current assets 38,349 including cash and deposits 4,720, trading products 13,589, operating loans 5,536 (+1,926) and cash collateral for borrowed securities 9,927. Liabilities 38,287 including trading products 10,508, collateralized borrowings 11,600 and banking-business deposits 7,502 (+2,460). Net assets 2,119; shareholders' equity 1,841, up ¥77.4 billion from the prior year-end. Side panel: total assets ¥40.4071 trillion, net assets ¥2.1195 trillion; 75.4% of assets are highly liquid.
Two-column balance sheet table (assets left, liabilities and net assets right) with September-end and change-vs-March columns; summary figures and bullet notes on the right.
As of June 30, 2026: consolidated total capital ratio 21.04%, Tier 1 ratio 20.95%, CET1 ratio 18.63% and leverage ratio 5.03%. Liquidity coverage ratio for July–September 2026 (daily average) 139.6%. Charts track total capital (¥1,719 billion in FY2026 Q1) and CET1 capital (¥1,522 billion) since FY2024 Q1, total exposure (¥33,977 billion), and high-quality liquid assets (¥3,777 billion) versus net cash outflows (¥2,705 billion).
Wide capital ratio chart across the top, leverage ratio and LCR charts side by side below, with a text panel on the right listing the period-end ratios.
Consolidated P&L in ¥ million. Q2 commissions 137,735 (-4.0% QoQ), trading gains 28,910 (-13.0%), financial revenue 206,313 (+17.5%), net operating revenues 223,902, SG&A 152,986, operating income 70,915, ordinary income 78,262, extraordinary gains 3,954, pre-tax income 82,217, net income 51,431. H1 operating income 148,427 (+72.5%). Side notes: brokerage commissions ¥26.4 billion (-24.4%), underwriting ¥11.7 billion (-31.2%), distribution fees ¥7.7 billion (-16.4%), M&A-related fees ¥15.1 billion (+20.5%). From this page, comparisons are QoQ unless stated.
Full income statement table with quarterly, QoQ, YoY, H1 and FY2025 columns; current quarter shaded; commission bullet notes on the right.
Q2 SG&A ¥152,986 million (+7.1% QoQ; H1 295,873, +22.3%): trading-related 30,824 (+6.8%), personnel 73,445 (+2.6%), real estate 12,788, office costs 11,458 (+16.4%), depreciation 10,430 (+9.8%), taxes and dues 5,465, other 8,572. The increase was mainly driven by consolidating ORIX Bank from Q2.
SG&A line-item table with the standard multi-period columns and a two-bullet explanation on the right.
SG&A split into variable and fixed costs in ¥ billion from FY2024 Q2. Q2 FY2026 total 152.9: variable costs 64.8 (trading-related 30.8 including advertising 2.3, bonuses 24.2, overtime and part-time 2.4) and fixed costs 88.1 (personnel 46.6, real estate 12.7, depreciation 10.4, outsourcing 11.1, taxes and dues 5.4). FY2025 full-year SG&A was 513.0 (variable 217.0, fixed 296.0).
Single wide table with grey full-year subtotal columns for FY2024 and FY2025 and shaded FY2026 Q2 column; variable and fixed cost blocks outlined.
Overseas ordinary income was ¥7,276 million in Q2 (-44.6% QoQ) and a record ¥20.4 billion for H1 (+78.6% YoY). Europe turned profitable in Q2 (¥1,119 million); Asia & Oceania fell to ¥2,242 million as strong Q1 equity revenue and equity-method income declined; the Americas fell to ¥3,914 million on lower FICC revenue. A stacked bar chart shows regional contributions since FY2024 Q2.
Regional results table at top, stacked bar chart with total line below, three bullets on the right.
Q2 WM net operating revenues ¥99,259 million (+12.5% QoQ; H1 +36.3%) and ordinary income ¥39,737 million (+6.6%). Equity revenue fell ¥6.2 billion (-26.1%) from a high Q1 but demand for AI, semiconductors and new growth themes continued. Bond revenue rose ¥0.3 billion (+4.7%), led by SoftBank Group bonds. Fund agency fees hit a record (+6.1%). Wrap-related revenue rose 8.8% to a record ¥20.8 billion. Stock-based revenue reached a record ¥38.3 billion, covering 128.4% of fixed costs and 82.1% of total costs. Net asset inflow of ¥312.6 billion, with 11 consecutive quarters of individual net inflows. Revenue table by product, with Daiwa Next Bank contributing ¥24.9 billion.
Summary table and bracketed topic bullets (Equity, Bonds, Equity Investment Trusts, Wrap, Stock-based Revenue, Asset Inflow) on the left; stacked bar and line chart with product revenue table on the right.
Wrap account contracts of ¥418.2 billion and net increase of ¥294.6 billion were quarterly records; wrap contract assets reached a record ¥6.9469 trillion. Equity investment trust sales were ¥502.7 billion, with net increase of ¥165.0 billion as cancellations fell, led by the Global Select Equity Open (World's Best), Growth Opportunity Fund and a physical AI equity fund. Combined wrap and equity trust net increase of ¥459.6 billion was a quarterly record. Product sales table in ¥ billion: equity offerings 63.9, wrap 418.2, insurance 46.3, domestic bonds 311.8, foreign bonds 233.8, equity investment trusts 502.7.
Text bullets top left, net increase stacked bar chart bottom left, product sales stacked bar chart with data table on the right.
Q2 ordinary revenues ¥35,452 million, net interest and similar income ¥13,439 million (+3.0%), and ordinary income ¥7,876 million, a record (+8.5% QoQ; H1 +50.5%). Deposits fell from the prior quarter-end to ¥5,055 billion as time-deposit campaign inflows were outweighed by transfers into securities investments and maturities; foreign-currency deposits ¥721 billion; deposit accounts rose to 2.412 million. Charts track net interest income (¥42.1 billion in FY2025) and deposit balances since FY2021.
Summary table and bullets top left, income combo chart with table bottom left, deposit balance and account count combo chart with table on the right.
Consolidation began in July–September 2026; contribution to WM ordinary income was ¥6.7 billion after goodwill amortization. ORIX Bank standalone Q2 ordinary revenues ¥24,146 million (+8.5% QoQ) and ordinary income ¥8,392 million (+20.5%). Loan balance flat QoQ at ¥2,767 billion as investment property loans rose to ¥2,005 billion while corporate loans eased to ¥651 billion. Historical charts from FY2021 are standalone reference figures not included in prior consolidated results.
Compact summary table and two bullets top left, income combo chart bottom left, loan balance stacked bar chart and table on the right.
Q2 net operating revenues ¥22,941 million (+7.9% QoQ) but ordinary income ¥12,836 million (-18.3%) due partly to valuation losses. Daiwa Asset Management attracted ¥479.1 billion of net inflows into public equity investment trusts excluding ETFs, and public investment trust AUM topped ¥44 trillion, a record. Total AUM ¥50,495 billion (public equity trusts 42,613, of which ETFs 25,644; public bond trusts 1,463; private trusts 3,028; advisory 3,390). H1 ordinary income ¥28.5 billion versus ¥37.6 billion for all of FY2025.
Summary table and bullets top left, annual ordinary income bar chart bottom left, AUM stacked bar chart with detailed table on the right.
Q2 net operating revenues ¥12,035 million (-9.7%) and ordinary income ¥9,810 million (-0.3%), roughly flat as stable AUM-linked income plus property sale gains at Daiwa Securities Realty and Samty contributed. AUM hit a record ¥1,826 billion including sub-sponsored Samty Residential, led by Daiwa Office Investment (¥487 billion), Daiwa Securities Living (¥399 billion) and Daiwa Securities Residential Private (¥259 billion). H1 ordinary income ¥19.6 billion versus ¥33.0 billion for FY2025.
Summary table and bullets top left, stacked annual profit chart (AUM-linked vs other) bottom left, AUM by vehicle stacked bars and table on the right.
Q2 net operating revenues ¥3,036 million (-52.0%) and ordinary income ¥1,232 million (-74.4%) as capital gains from portfolio exits fell and Daiwa Energy & Infrastructure booked losses on renewable-energy investments. H1 ordinary income ¥6.0 billion after a ¥5.2 billion loss in FY2025. Principal investment balance ¥261 billion: Daiwa PI Partners private equity 18, monetary claims 71, real estate 6, Daiwa Energy & Infrastructure 164 (¥ billion).
Summary table and two bullets top left, annual ordinary income bar chart with negative bar bottom left, principal investment stacked bars and table on the right.
Q2 net operating revenues ¥45,712 million (-15.1% QoQ) and ordinary income ¥11,168 million (-38.6%); H1 ordinary income ¥29.4 billion (+165.7% YoY). Equities stayed firm by capturing institutional flows despite lower global turnover, and equity derivatives saw more new trades despite lower volatility. Domestic FICC was steady on JGB and derivatives client flows, but overseas FICC struggled with lower flows and position management as US rates rose. Q2 revenue mix in ¥ billion: equity 23.5, FICC 21.1, other 1.0.
Summary table and bracketed Equity and FICC bullets on the left; stacked revenue bars with ordinary income line and data table on the right.
Q2 net operating revenues ¥23,424 million (+3.4%) and ordinary income ¥4,017 million (+22.7%). Equity deals include Japan Airport Terminal PO (¥64.3 billion), Oliver IPO (¥26.0 billion), Nichicon euro-yen CB (¥22.0 billion) and a Mitsui & Co. digital real estate STO. Debt deals include a ¥1 trillion SoftBank Group retail bond, Sumitomo Forestry subordinated bonds (¥243.5 billion) and Mexico Samurai bonds (¥282.8 billion). M&A mandates include the SoftBank and Seven & i Holdings capital and business alliance and the Saddora Holdings MBO by Marunouchi Capital. Revenue mix in ¥ billion: equity underwriting 2.6, debt underwriting 4.5, M&A and other 16.2; group M&A-related revenue 17.5.
Summary table and three deal lists (equity, debt, M&A) with offering sizes on the left; stacked revenue bars with profit line and table on the right.
Section divider introducing the reference materials that follow on pages 25-36.
Mostly white slide with the word Appendix (参考資料) at left-centre and a pale blue ribbon graphic in the lower right.
Q2 commissions ¥137,735 million (-4.0% QoQ; H1 281,158, +28.6%): brokerage 26,440 (-24.4%), underwriting and secondary offerings 11,750 (-31.2%), subscription and distribution 7,758 (-16.4%), other commissions 91,785 (+11.8%) including agency fees 9,889, investment advisory and account management fees 20,650, insurance sales 1,390, M&A-related fees 15,114 (+20.5%) and consignment fees 33,824.
Single commission table with nested sub-rows under other commissions and the standard multi-period columns.
Daiwa Securities client assets reached ¥118.7 trillion at the end of Q2 (from ¥90.3 trillion in FY2024 Q2): equities 82.8, domestic bonds 15.0, foreign bonds 4.4, equity investment trusts 12.8, bond trusts 0.8, foreign trusts 0.8, other 1.8 (¥ trillion). Daiwa Next Bank deposits including ORIX Bank were ¥7.6 trillion.
Stacked bar chart across the top with legend on the left, data table across the bottom.
Daiwa Securities data: 3.347 million client accounts with balances, 1.502 million equity-holding accounts, 3.915 million online trading accounts, 49 thousand new accounts in Q2 and 727 thousand NISA accounts. Wrap account assets ¥6,946 billion across 248 thousand contracts. Individual domestic equity trading: 2.773 million executions and ¥3,996 billion traded (down from ¥5,161 billion in Q1); foreign equity trading ¥507 billion.
Single multi-section KPI table spanning nine quarters.
WM Headquarters net asset inflow (cash plus securities) was ¥312.6 billion in Q2: corporate 177.3 and individual 135.3. Individual inflow comprised net cash deposits of ¥59.2 billion and net securities transfers of ¥76.0 billion; Q1 had been 491.5 in total.
Two side-by-side stacked bar charts (total by client type, individual by cash vs securities) each with a data table below.
WM HQ (domestic) Q2 net operating revenues ¥71.7 billion: stock-based revenue 38.3 and flow revenue 33.3, lifting the stock-based ratio to 53.5%. Stock-based revenue covered 128.4% of fixed costs and 82.1% of total costs, up from 104.6% and 68.5% in FY2024 Q2. Balances in ¥ trillion: equity investment trusts 12.8, wrap contract assets 6.9, foreign-currency deposits 0.7.
Stacked revenue composition chart with table and coverage ratios on the left; clustered balance bars with table on the right.
Daiwa ranked No. 1 in straight bonds excluding own issues (22.4% share), No. 2 in municipal bonds (21.1%), No. 3 in equity offerings (14.3%) and FILP agency bonds (22.1%), No. 5 in IPOs (9.0%) and No. 5 in announced M&A by deal count. Nomura led equity offerings (30.2%), IPOs (33.8%), FILP agency and municipal bonds; Mizuho led M&A. Source: Daiwa Securities based on LSEG Data & Analytics.
Ranking grid with six product columns and five rank rows; Daiwa's cells outlined and shaded red.
Trading VaR (99% one-tailed, one-day holding period, correlations considered) was ¥1.09 billion at Q2 end, with a quarterly high of 1.72, low of 0.87 and average of 1.11. By risk factor: equities 0.97, interest rates 0.77, FX 0.57, commodities 0.00. Reference VaR at 95% confidence: ¥0.72 billion.
Methodology box at top, VaR table with period-end, max/min/average and risk-factor rows, plus a 95% reference row.
Consolidated headcount (including temporary staff) rose to 16,755 at Q2 end from 15,803 in Q1, reflecting the newly consolidated bank; overseas staff 1,852.
Simple two-row table across nine quarters on an otherwise white slide.
Standalone Daiwa Securities balance sheet in ¥ billion: total assets 16,964 (-753 vs March), including trading products 8,941 and cash collateral for borrowed securities 4,002 (-2,001). Liabilities 16,396 including collateralized borrowings 3,497 (-2,100). Net assets 568, capital stock 100.
Two-column balance sheet table with September-end and change-vs-March columns.
Standalone Daiwa Securities Q2 operating revenues ¥157,953 million and commissions ¥87,365 million (-7.3%): brokerage 18,072 (-23.4%), underwriting 10,360 (-27.4%), distribution 7,667, other commissions 51,264 (+8.7%). Trading gains 31,242, financial revenue 39,345, net operating revenues 122,333 (-4.2% QoQ). H1 net operating revenues 250,024 (+29.8% YoY).
Detailed revenue table with nested commission sub-rows and the standard multi-period columns.
Standalone Daiwa Securities Q2 SG&A ¥82,043 million (personnel 34,057, office costs 18,019, trading-related 14,665), ordinary income ¥40,748 million (-11.0% QoQ; H1 86,545, +57.7%) and net income ¥27,306 million (H1 58,259, +56.0%). Annualized ROE 19.7% in Q2 and 19.8% for H1; capital adequacy ratio 325.5%.
Continuation table with SG&A line items, profit rows, ROE and capital adequacy ratio.
Investor relations contact: Daiwa Securities Group Inc., Corporate Planning Department, IR Office, with an email address and the IR website https://www.daiwa-grp.jp/ir/.
Mostly white closing slide with a navy contact label and three lines of contact text in the lower right.
Preguntas comunes sobre esta diapositiva y el contenido de la presentación subyacente.
It covers Daiwa's first half of fiscal 2026 (April–September 2026), with a focus on the second quarter (July–September). It reports record H1 ordinary income of ¥166.3 billion (+69.9% YoY), net income of ¥107.8 billion (+36.6%), net operating revenues of ¥444.3 billion, base profit of ¥125.2 billion, a 12.0% ROE and a record ¥39 interim dividend, followed by segment detail, capital ratios and an appendix.
The original deck is in Japanese, titled 2026年度 第2四半期 決算説明資料 (FY2026 Q2 earnings presentation), and was published on TDnet, the Tokyo Stock Exchange's Timely Disclosure network, on October 30, 2026 (ticker 8601). The page-by-page summary on this page is in English, with yen figures kept in Daiwa's own units.
億円 is ¥100 million, so 4,443億円 equals ¥444.3 billion. Charts labelled 十億円 are in ¥ billion, and detailed tables labelled 百万円 are in ¥ million. Daiwa's fiscal year runs from April to March, so FY2026 Q2 is July–September 2026.
Base profit is the combined ordinary income of the Wealth Management division, securities asset management and real estate asset management, the businesses with more stable recurring revenue. H1 FY2026 base profit of ¥125.2 billion already exceeds 80% of the ¥150 billion target in Daiwa's medium-term management plan.
ORIX Bank was consolidated from Q2 (July–September 2026) inside Daiwa Next Bank. It contributed ¥6.7 billion to WM ordinary income after goodwill amortization, lifted Daiwa Next Bank's H1 ordinary income by 117.8%, raised SG&A by 7.1% QoQ and increased consolidated headcount to 16,755.
Yes. Both the original PDF and an editable PPTX converted from it are available on this page. Text, tables and many charts can be edited in PowerPoint, though converted Japanese layouts may need some font and spacing cleanup.
It suits analysts and investors covering Japanese brokers, IR teams benchmarking a results deck for a diversified financial group, and designers who need examples of dense but readable financial tables, segment dashboards and league-table slides.
Daiwa Securities Group publishes results materials, including English versions of many documents, on its IR website at daiwa-grp.jp/ir. Japanese timely disclosures such as this deck also appear on TDnet on the day of release.
Original Japanese-language PDF of this presentation as disclosed on October 30, 2026.
Official IR site listed on the deck's contact page, with earnings materials and English documents.

Create Your Own Slides
Turn your ideas into professional presentations in seconds with 2slides AI.
Referencia diseños profesionales, elige tu estilo y genera diapositivas con renderizado de texto perfecto. Impulsado por Nano Banana—comienza a crear tu presentación ahora.
Tu Agente IA para diapositivas. Ahorra tiempo, brilla más rápido con la creación inteligente de presentaciones.


© 2026 2slides. Todos los derechos reservados.