
Forma parte de Ejemplos de presentaciones para inversores · Ejemplos de presentaciones para inversores de Japón
Chubu Electric Power H1 FY2026 Earnings Presentation (April–September 2026)
Usa la portada de esta presentación como referencia de estilo para diapositivas creadas con tu propio contenido. O elige cualquier página de abajo para usar su diseño como referencia.
Navegación Rápida
Etiquetas
Compartir las diapositivas
Chubu Electric Power H1 FY2026 Earnings Presentation (April–September 2026)
Vista detallada de cada página de diapositiva, incluyendo diseño, contenido clave y elementos visuales.
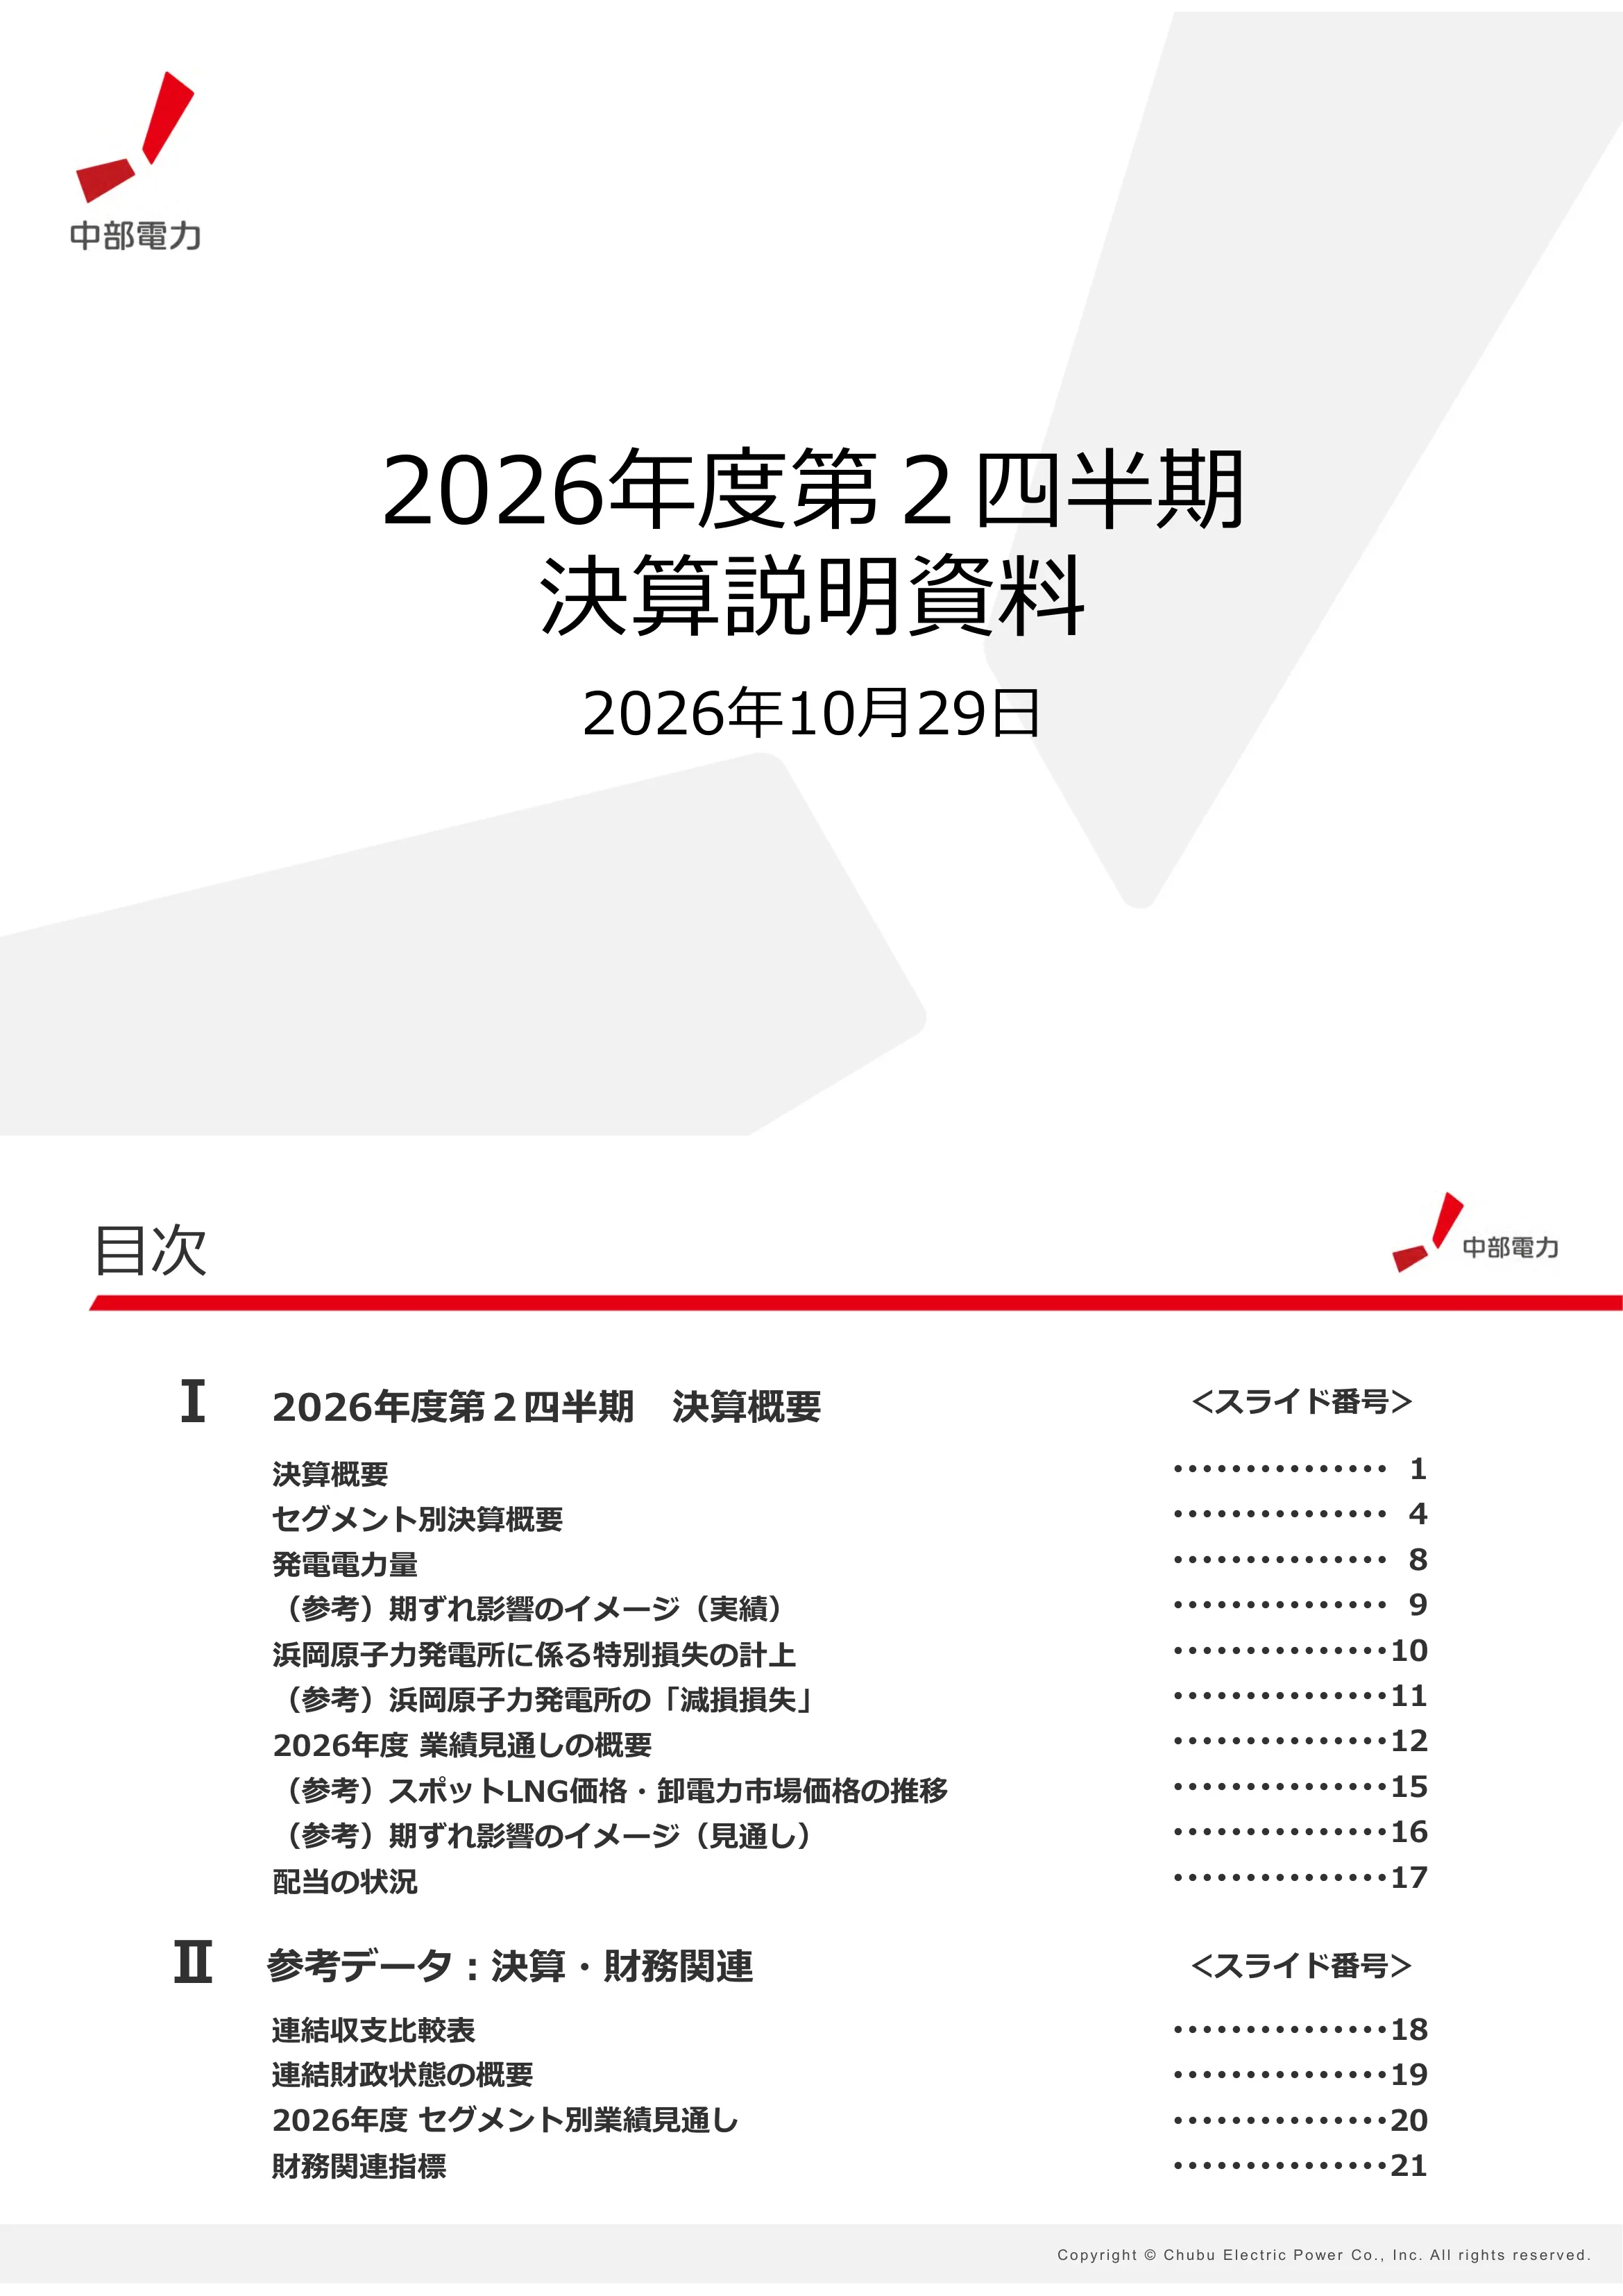
Title slide reading '2026年度第2四半期 決算説明資料' (FY2026 Second Quarter Earnings Presentation), dated October 29, 2026, with the Chubu Electric Power (中部電力) logo.
Centered two-line title with date below; corporate logo top-left; large light-grey angular brand shapes in the background.
Two-part agenda. Part I, FY2026 Q2 results overview: results summary (p.1), segment results (p.4), power generation (p.8), time-lag effect illustration (p.9), Hamaoka extraordinary loss (p.10), Hamaoka impairment explainer (p.11), FY2026 forecast (p.12), spot LNG and wholesale power prices (p.15), forecast time-lag illustration (p.16), dividends (p.17). Part II, reference financial data: consolidated income statement comparison (p.18), financial position (p.19), FY2026 segment forecast (p.20), financial indicators (p.21).
Roman-numeral section headings with indented item list and dotted leaders to right-aligned slide numbers; red header rule.
Section divider for the first-half results. A footnote defines conventions: the fiscal year (年度) runs April to the following March, '2Q' means April–September, monetary amounts are truncated below the display unit and volumes such as electricity sold and generated are rounded.
Large Roman numeral and section title over a full-width red rule; explanatory note at bottom.
Net sales ¥19,452 億円 (¥1,945.2 billion), up ¥1,973 億円 (+11.3%) as higher selling prices lifted sales to other utilities despite lower volume. Ordinary income ¥410 億円, down ¥1,552 億円 (−79.1%): JERA's domestic thermal and gas business improved on the Middle East situation, but Miraiz faced higher procurement costs, the time-lag effect flipped from gain to loss, and Power Grid suffered lower wheeling revenue and higher costs. Operating loss △¥780 億円 vs. ¥1,455 億円 profit. Extraordinary loss ¥3,704 億円 for Hamaoka. Net loss attributable to owners △¥2,804 億円, down ¥4,468 億円. Time-lag-adjusted ordinary income about ¥950 億円 vs. ¥1,632 億円. First revenue increase in three years, first H1 net loss in four years. 83 consolidated subsidiaries (+7) and 97 equity-method affiliates (+5).
Red-bordered commentary box with three bullet headlines, two-column callout bullets, then a five-row comparison table (2026/2Q, 2025/2Q, change, % change).
Waterfall from 2025/2Q net sales of ¥17,478 億円 to 2026/2Q net sales of ¥19,452 億円 (+¥1,973 億円): lower electricity sales volume △¥1,209 億円, higher sales to other utilities from rising prices +¥1,809 億円, and other items +¥1,373 億円, mainly higher fuel cost adjustment charges including government electricity bill subsidies.
Vertical waterfall chart with grey start and end bars, pink decrease bar and blue increase bars; callout box for the 'other' component.
Waterfall from ¥1,962 億円 to ¥410 億円 (△¥1,552 億円). Drivers: time-lag effect △¥870 億円 (from +¥330 億円 to △¥540 億円); Miraiz excluding time lag △¥1,545 億円 (¥956 → △¥588 億円); Power Grid △¥376 億円 (¥269 → △¥107 億円); JERA excluding time lag +¥981 億円 (¥456 → ¥1,438 億円); other +¥257 億円 (△¥49 → ¥208 億円). Time-lag-adjusted ordinary income fell about ¥682 億円, from about ¥1,632 億円 to about ¥950 億円.
Waterfall chart crossing the zero line, segment labels with before→after figures in brackets, horizontal pink arrow summarizing the underlying decline.
Net sales: Miraiz ¥15,206 億円 (+4.5%), Power Grid ¥5,725 億円 (+24.2%), Other ¥3,452 億円 (+8.9%), adjustments △¥4,932 億円; total ¥19,452 億円. Ordinary income: Miraiz △¥1,038 億円 (vs. ¥956), Power Grid △¥107 億円 (vs. ¥269), JERA ¥1,348 億円 (+71.5%), Other ¥753 億円 (−28.4%, including real estate ¥88 億円, +76.1%), adjustments △¥545 億円; total ¥410 億円. Notes: Other covers the renewable energy company, multi-utility, global, real estate, nuclear and overhead divisions; JERA is equity-method so records no sales.
Two stacked comparison tables (net sales and ordinary income) with segment rows and four numeric columns; footnotes below.
Miraiz ordinary income fell ¥1,995 億円 to △¥1,038 億円 as the time-lag effect turned negative (△¥450 億円, from 0), procurement costs rose about ¥1,000 億円 on the Middle East situation, and other items cost △¥545 億円 (lower volume and reversal of prior-year portfolio savings). Excluding time lag: about △¥588 億円, down about ¥1,545 億円. Electricity sold 490 億kWh (49.0 TWh), −10.7% (low voltage 131, high/extra-high voltage 359), with competition about △46 and weather/economy about △13. Group electricity sold 545 億kWh (−9.9%); sales to other utilities 151 億kWh (+48.5%).
Commentary box on top; left half waterfall chart with callout; right half volume tables for retail and group sales.
Power Grid ordinary income fell ¥376 億円 to △¥107 億円: lower wheeling revenue from weaker area demand △¥105 億円, higher supply-demand balancing costs △¥143 億円, higher equipment and general expenses from inflation △¥88 億円, other △¥40 億円. Area demand 603 億kWh, −2.9% (low voltage 175, −6.1%; high/extra-high voltage 429, −1.5%).
Commentary box above a left-side waterfall chart and a right-side area-demand table.
JERA equity-method ordinary income rose ¥561 億円 to ¥1,348 億円: time lag △¥420 億円 (¥330 → △¥90 億円), domestic thermal and gas business +¥1,207 億円 driven by gains on wholesale power exchange sales, fuel business +¥135 億円, other △¥361 億円 (lower overseas and renewable generation earnings). Excluding time lag about ¥1,438 億円, up about ¥981 億円. Crude oil CIF $108.1/bbl vs. $73.7 (preliminary); FX ¥159.4/$ vs. ¥146.0. JERA consolidated net income ¥2,829 億円 vs. ¥1,562 億円 (time-lag-adjusted about ¥3,011 億円 vs. ¥891 億円).
Commentary box; left waterfall chart with callouts; right-side tables for CIF price/FX and JERA consolidated net income.
Chubu Electric's own generation totaled 59 億kWh (−1.7%). Hydro 57 億kWh (−1.6%) with a flow rate of 98.9% vs. 99.1%; nuclear zero output with no capacity factor (Hamaoka remains offline); new energy 2 億kWh, flat. Figures are based on information available at the release date.
Short commentary box with two bullet items above a four-row generation table.
Conceptual chart of the fuel cost adjustment time lag: in 2025/2Q revenue lagged falling fuel costs, producing a gain of ¥330 億円; in 2026/2Q fuel procurement costs rose sharply ahead of revenue, producing a loss of △¥540 億円. Amounts combine JERA and Miraiz time-lag effects.
Two side-by-side time panels (April 2025–March 2026, April 2026–March 2027) with a red cost line and dashed blue revenue line; shaded gaps with up/down arrow labels.
After receiving the investigation committee's report on September 11, 2026 regarding the improper handling of design-basis ground motion in the Hamaoka safety review, the company withdrew the Units 3 and 4 reactor installation change applications on September 25. With restart timing and safety-upgrade costs now uncertain, estimated future cash flows fell below book value, so it booked a ¥3,049 億円 impairment of nuclear power fixed assets and construction in progress plus a ¥653 億円 nuclear fuel valuation loss, ¥3,703 億円 in total. Full-year FY2026 extraordinary loss is expected at about ¥3,800 億円, including about ¥100 億円 of further impairment on capex from Q3.
Dense four-bullet text block inside a red border, with a small three-row table (H1 actual vs. FY2026 forecast).
Plain-language explainer: an impairment writes down fixed assets whose cost recovery can no longer be adequately supported at the reporting date. The withdrawal of the applications raised uncertainty over future income, so the company judged it could not demonstrate recoverability with sufficient evidence. Key messages: the write-down does not mean decommissioning Hamaoka; it is an accounting judgment based on current information; and the company is prioritizing preventing recurrence and restoring trust, saying it is not in a position to discuss restart.
Three-step chevron process (hold assets, review at closing, record impairment), bulleted reasons, a highlighted statement bar, and three numbered message boxes.
Guidance revised from the July 29, 2026 forecast. Net sales ¥42,000 億円 (¥4.2 trillion), up about ¥3,000 億円 on higher fuel cost adjustment amounts. Ordinary income ¥1,100 億円, down about ¥750 億円 from ¥1,850 億円, as JERA improves but Miraiz faces wider time-lag losses and higher procurement costs (time-lag-adjusted about ¥1,600 vs. ¥1,900 億円). Net income attributable to owners △¥2,150 億円 vs. +¥1,600 億円, reflecting about ¥3,800 億円 of Hamaoka extraordinary losses. First full-year loss since FY2021.
Red-bordered commentary box with three bullet headlines, callout bullets, and a three-row comparison table (current vs. July 29 forecast).
Miraiz electricity sales forecast 990 億kWh vs. 987 (+0.3%; competition about △1, weather/economy about +4); group sales 1,097 億kWh vs. 1,098. Crude oil CIF about $105/bbl (from $90); FX about ¥157/$ (from ¥159); nuclear capacity factor not applicable. The company views the Middle East situation's effect on demand as limited, since April–September Chubu-area demand tracked plan.
Two assumption tables (electricity volume and commodity/FX) with callout box and footnotes.
Versus FY2025 actual: net sales ¥42,000 vs. ¥35,460 億円 (+18.4%); ordinary income ¥1,100 vs. ¥2,910 億円 (−62.2%; time-lag-adjusted about ¥1,600 vs. ¥2,840 億円); net income △¥2,150 vs. ¥2,277 億円 (about △¥4,430 億円). Miraiz electricity sold 990 vs. 1,090 億kWh (−9.2%; competition about △90, weather/economy about △10); group sales 1,097 vs. 1,200 億kWh (−8.6%). Crude oil about $105 vs. $71; FX about ¥157 vs. ¥151.
Three stacked tables: earnings forecast vs. prior year, volume assumptions, and commodity/FX assumptions.
Line charts from February to October 2026. Left: JKM spot LNG price ($/mmbtu, Bloomberg) rose from about $11 to roughly $30, with the July 29 forecast set during a dip after a US–Iran memorandum toward ending hostilities and the current forecast during a rise on renewed US–Iran tension (re-closure of the Strait of Hormuz) and low European gas storage. Right: JEPX Chubu-area daily average spot price (¥/kWh) climbed from about ¥9–13 to the ¥20–26 range.
Two side-by-side line charts with annotation boxes marking forecast dates and market drivers; sources noted below each.
Compares the full-year FY2026 time-lag assumption: the July 29 forecast assumed a loss of about ¥50 億円, while the current forecast assumes about ¥500 億円 as fuel costs stay elevated through the second half. Amounts combine JERA and Miraiz.
Two side-by-side illustrative panels (July 29 forecast vs. current forecast) linked by a grey arrow; red cost curve vs. dashed blue revenue curve.
Shareholder return policy: continue capex for safe and stable supply while investing in growth, aiming for stable dividends and a consolidated payout ratio of 30% or more. Interim dividend set at ¥35 per share by the board on the release date; year-end forecast ¥35 for an annual ¥70, unchanged from FY2025 and from the July 29 forecast. FY2025 time-lag-adjusted payout ratio was 23.9%; FY2026 not applicable due to the loss.
Red-bordered panel with policy bullets, dividend bullet and a three-row dividend table with footnotes.
Section divider introducing the reference data appendix on results and financial position.
Large Roman numeral II with section title over a full-width red rule.
Operating revenue ¥19,452 億円; equity-method investment income ¥1,321 億円 (+93.5%); non-operating revenue ¥1,419 億円; ordinary revenue ¥20,871 億円 (+14.6%). Operating expenses ¥20,232 億円 (+26.3%); non-operating expenses ¥228 億円; ordinary expenses ¥20,460 億円. Operating loss △¥780 億円; ordinary income ¥410 億円; drought reserve △¥8 億円; extraordinary loss ¥3,704 億円; income taxes △¥506 億円; non-controlling interests ¥25 億円; net loss attributable to owners △¥2,804 億円 vs. ¥1,663 億円.
Full-width income statement table with nested indentation for sub-items and four numeric columns.
As of September 30, 2026 vs. March 31, 2026: total assets ¥73,751 億円 (△¥2,775), liabilities ¥44,582 億円 (+¥183), net assets ¥29,168 億円 (△¥2,959). Includes ¥558 億円 capital reduction distribution received from the TB investment limited partnership. Equity ratio 38.5% vs. 41.0%; interest-bearing debt ¥33,418 億円, up ¥1,083 億円 (¥994 from financing/repayment, ¥89 from consolidation scope changes).
Two stacked balance-sheet tables with explanatory notes.
Current vs. July 29 forecast: Miraiz △¥1,800 億円 vs. △¥50 億円 (time-lag-adjusted about △¥1,300 vs. 0); Power Grid ¥150 vs. ¥300 億円 (−50%); JERA ¥2,300 vs. ¥1,250 億円 (+84%); other and adjustments ¥450 vs. ¥350 億円, including real estate ¥200 億円 unchanged. Total ¥1,100 vs. ¥1,850 億円 (time-lag-adjusted about ¥1,600 vs. ¥1,900 億円).
Segment forecast table with bracketed time-lag-adjusted values and change columns.
FY2026 forecast vs. FY2025 actual: ROIC 3.4% (excluding tax effects of the Hamaoka loss) vs. 4.4%; ROA about 3% vs. 4.3% — Miraiz about △16% vs. 16.9%, Power Grid about 1% vs. 2.5%, JERA about 13% vs. 5.7%, real estate about 4% vs. 5.8%; ROE about △6% vs. 7.5%; equity ratio about 37% vs. 41.0%. Definitions given for ROIC, ROA, ROE and equity; ordinary income and net income are time-lag-adjusted.
Single KPI table with nested segment ROA rows and definition footnotes.
Cautionary note: forward-looking statements are based on information available at the release date, and actual results may differ due to various factors.
Centered red-bordered text box with title and short paragraph.
Preguntas comunes sobre esta diapositiva y el contenido de la presentación subyacente.
For April–September 2026, consolidated net sales were ¥1,945.2 billion (¥19,452 億円), up 11.3%. Ordinary income fell 79.1% to ¥41.0 billion, and net income attributable to owners swung to a loss of ¥280.4 billion, mainly because of the ¥370.3 billion extraordinary loss related to the Hamaoka nuclear power station.
After an investigation report into the improper handling of design-basis ground motion in Hamaoka's safety review, the company withdrew its Units 3 and 4 applications in September 2026. Restart timing and safety costs became too uncertain to support the assets' book value, so it wrote down ¥304.9 billion of nuclear fixed assets and booked a ¥65.3 billion nuclear fuel valuation loss. The deck stresses this is an accounting judgment, not a decision to decommission the plant.
Japanese fuel cost adjustment systems pass fuel price changes into electricity tariffs with a delay. When fuel prices rise quickly, costs outrun revenue and the utility books a temporary loss; when they fall, it books a gain. In H1 FY2026 the combined JERA and Miraiz time-lag effect was a loss of about ¥54.0 billion, versus a ¥33.0 billion gain a year earlier.
Versus the July 29, 2026 forecast, net sales were raised to ¥4.2 trillion, ordinary income cut to ¥110 billion from ¥185 billion, and net income cut to a loss of ¥215 billion from a ¥160 billion profit. The annual dividend forecast of ¥70 per share (¥35 interim plus ¥35 year-end) is unchanged.
Yes. The original is a Japanese-language earnings briefing deck (決算説明資料) titled '2026年度第2四半期 決算説明資料', released on October 29, 2026 through TDnet, the Tokyo Stock Exchange's timely disclosure system, under securities code 9502. The page summaries here are English translations of each slide, with amounts kept in the company's ¥100 million (億円) units.
億 is 100 million. So ¥19,452 億円 equals ¥1.9452 trillion, and 490 億kWh equals 49.0 billion kWh (49.0 TWh). Negative values are shown with a triangle (△), the standard Japanese notation.
Chubu Electric's fiscal year runs from April to March, so FY2026 is April 2026 to March 2027, and H1 (2Q cumulative) covers April–September 2026.
Yes. The gallery page offers the original PDF and an editable PPTX converted from it, which is useful if you want to reuse the waterfall bridges, segment tables or guidance layouts as a template for your own earnings presentation.
Original Japanese-language deck filed October 29, 2026

Create Your Own Slides
Turn your ideas into professional presentations in seconds with 2slides AI.
Referencia diseños profesionales, elige tu estilo y genera diapositivas con renderizado de texto perfecto. Impulsado por Nano Banana—comienza a crear tu presentación ahora.
Tu Agente IA para diapositivas. Ahorra tiempo, brilla más rápido con la creación inteligente de presentaciones.


© 2026 2slides. Todos los derechos reservados.