
Forma parte de Ejemplos de presentaciones para inversores
CapitaLand Integrated Commercial Trust (CICT) 3Q 2026 Business Updates presentation, lodged with SGX on 29 October 2026, covering the third quarter and nine months ended 30 September 2026
Usa la portada de esta presentación como referencia de estilo para diapositivas creadas con tu propio contenido. O elige cualquier página de abajo para usar su diseño como referencia.
Navegación Rápida
Etiquetas
Compartir las diapositivas
CapitaLand Integrated Commercial Trust (CICT) 3Q 2026 Business Updates presentation, lodged with SGX on 29 October 2026, covering the third quarter and nine months ended 30 September 2026
Vista detallada de cada página de diapositiva, incluyendo diseño, contenido clave y elementos visuales.
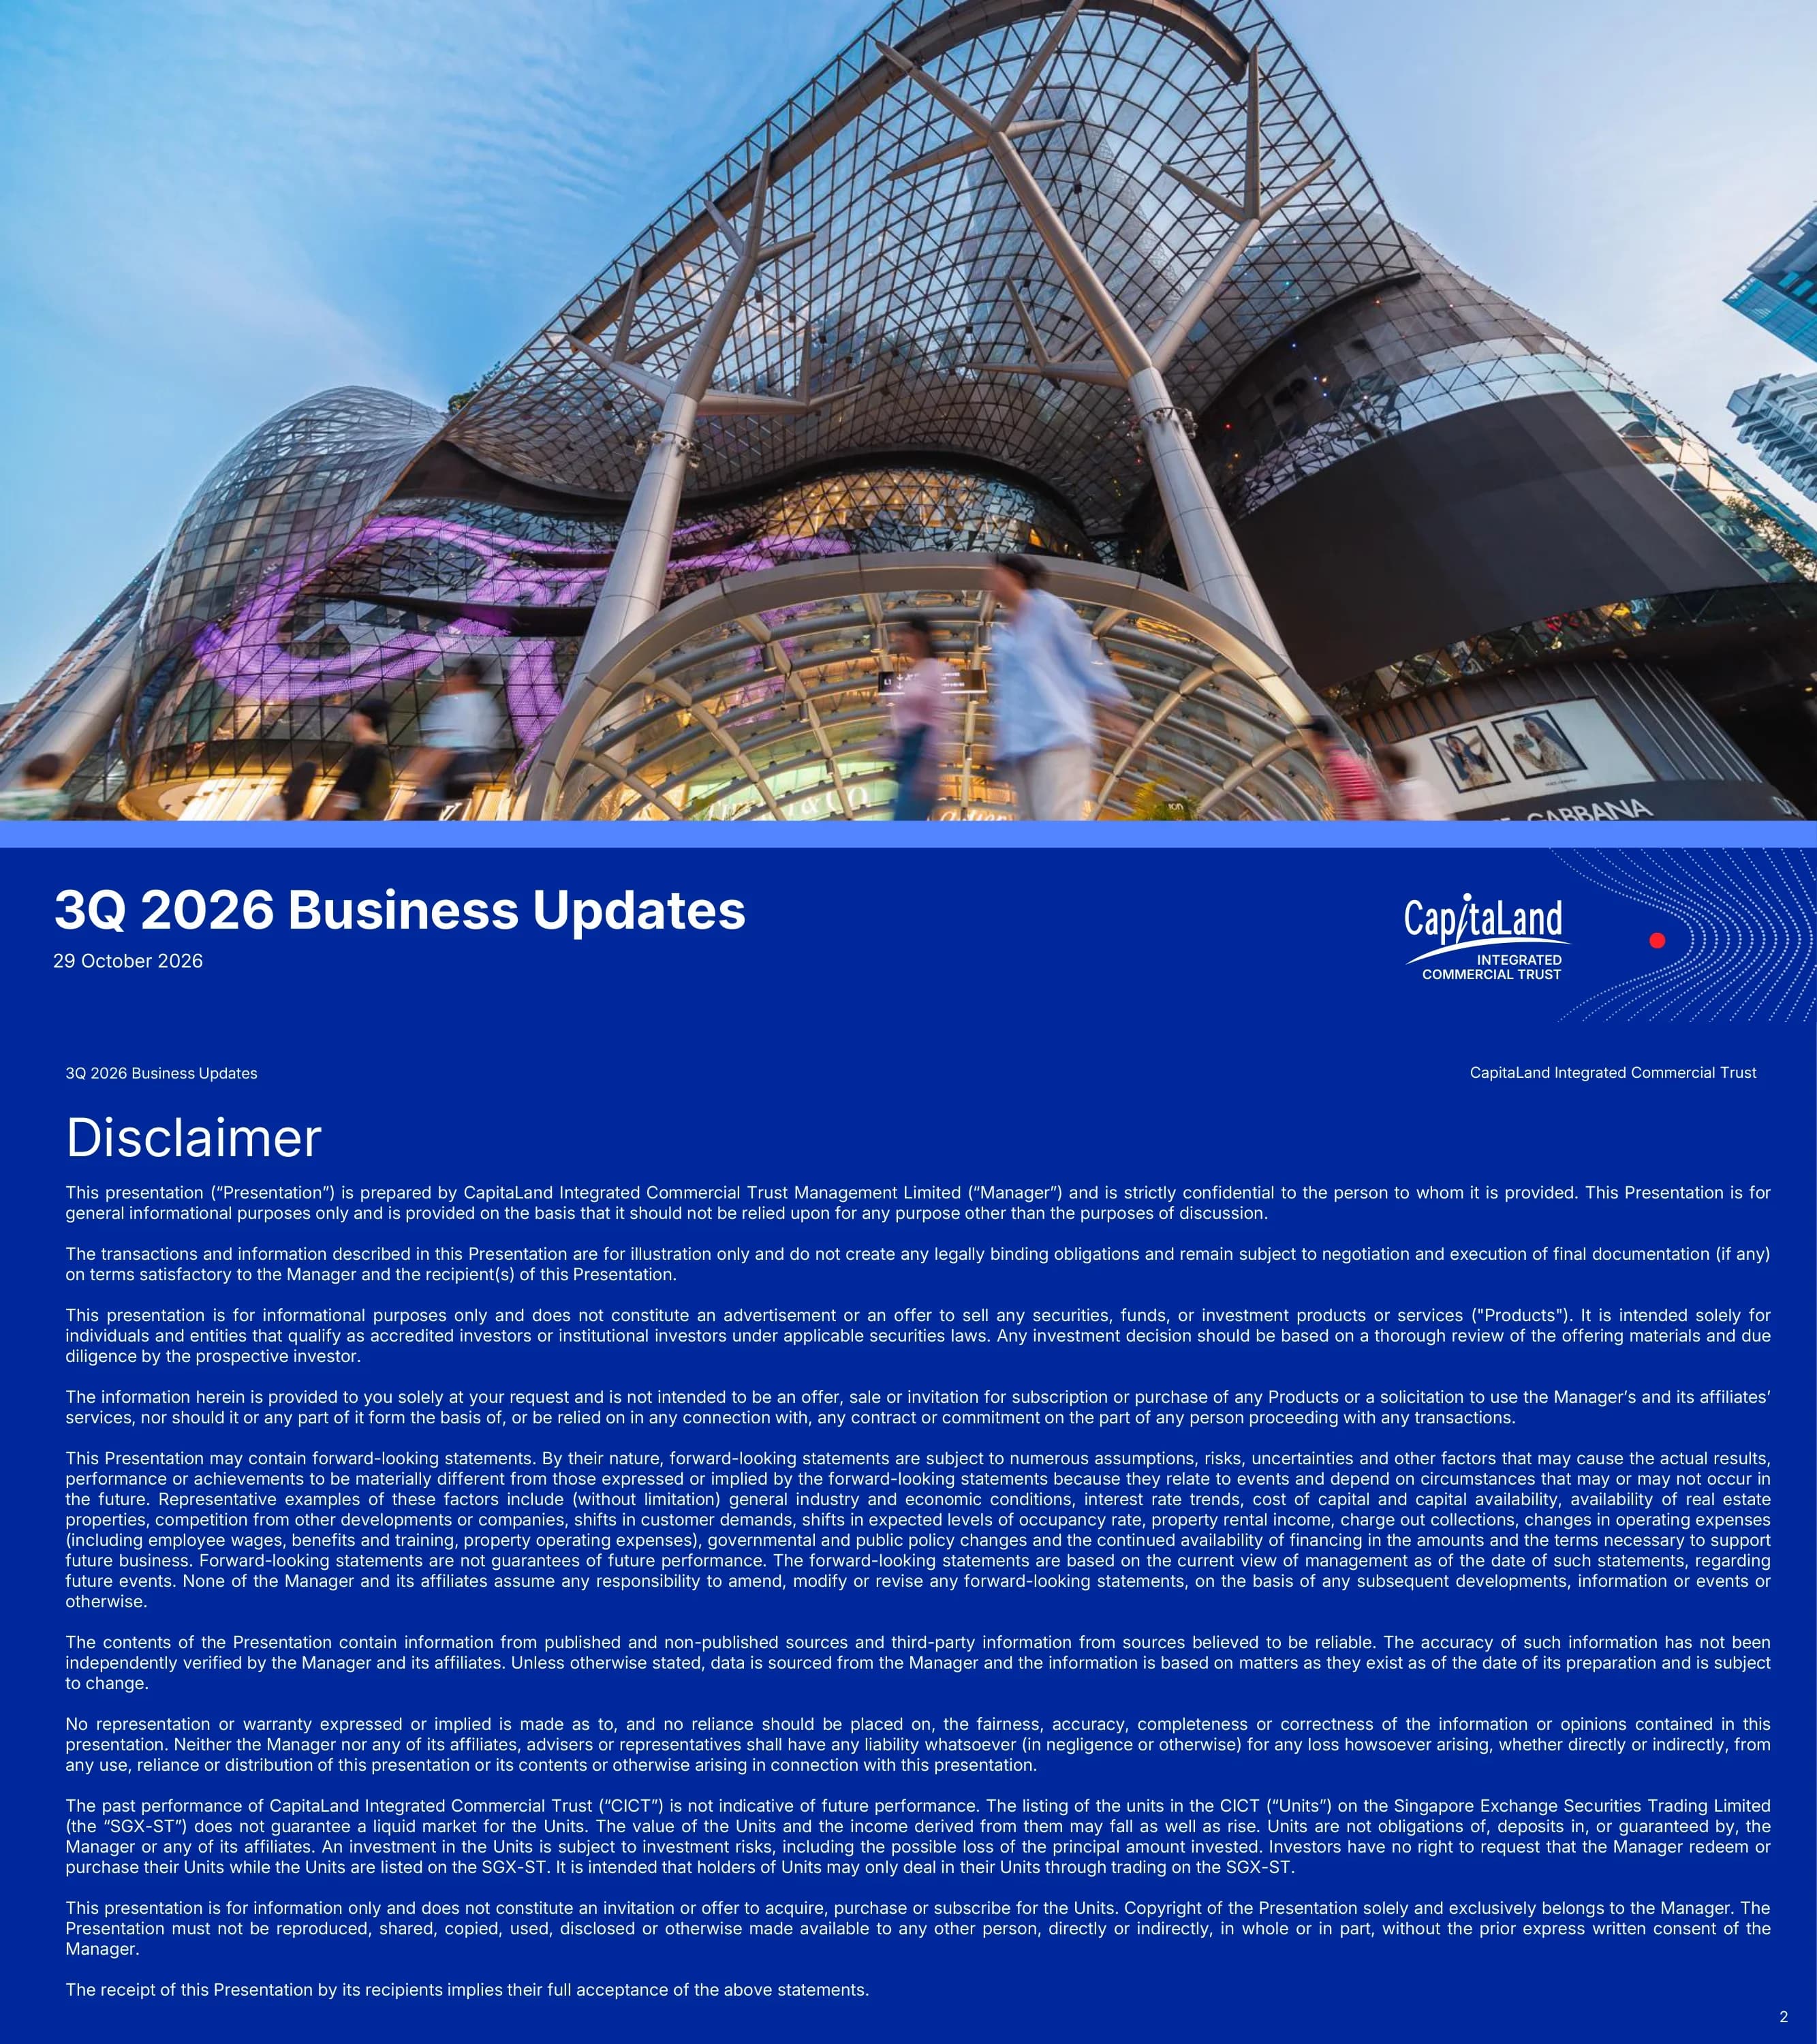
Cover slide of CapitaLand Integrated Commercial Trust (CICT) titled '3Q 2026 Business Updates', dated 29 October 2026.
Full-bleed photograph of the glass-canopied ION Orchard mall in the upper 80%, with a royal-blue title band at the bottom holding the title and date on the left and the CapitaLand Integrated Commercial Trust logo on the right.
Standard legal disclaimer: the presentation is for information only, is not an offer of units, contains forward-looking statements, and past performance is not indicative of future performance. Units are listed on SGX-ST.
Single column of dense justified text on a royal-blue background with a header strip and page number.
Six-part agenda: 01 Highlights, 02 Financials & Capital Management, 03 Portfolio & Asset Type Performance, 04 Focus & Outlook, 05 Sustainability, 06 Market Information.
Left half numbered list with circled outline numerals; right half a tall photograph of the bird sculpture at Raffles City Singapore with a pale gradient fade.
Section divider for the Highlights section.
Pale-blue background with the numeral and title at upper left and a cluster of solid and outlined circles on the right with one red dot.
Headline dashboard for the nine months ended 30 September 2026, including Paragon (acquired 1 Jul 2026) and excluding AST2 (divested 17 Sep 2026). 9M NPI S$965.4 million, up 10.4% YoY; aggregate leverage 39.7%, up 2.3 ppts vs 30 Jun 2026; average cost of debt 2.8%, down 0.1 ppt; S$400 million green notes due 2031 issued at 2.646% on 8 Sep 2026. Portfolio occupancy 96.1% (+0.5 ppts QoQ), retail 97.3%, office 95.4%, integrated developments 96.4%, WALE 3.1 years. Rent reversion: retail +4.6%, office +7.1%. Shopper traffic +2.3% YoY (+0.9% like-for-like), tenant sales psf +2.1% (+2.0% LFL).
Three-column KPI board with blue header tabs: Financials & Capital Management, Operating Metrics (occupancy), Operating Metrics (reversion, traffic, sales), each row a label, large bold figure and arrow-marked change.
Two tables. Asset enhancement initiatives (AEI): Tampines Mall completed 3Q 2026 (~S$24M capex, ~7% ROI); Raffles City Tower upgrading to 4Q 2026; Lot One Shoppers' Mall 1Q 2027 (~S$37M, >7%); Capital Tower 4Q 2027 (~S$25M); Plaza Singapura / The Atrium@Orchard 4Q 2028 (~S$160M, 6-7%). Divestment and development: Asia Square Tower 2 sold for net proceeds ~S$2.45B at 3.0% exit yield, completed 17 Sep 2026; Hougang Central commercial component ~300,000 sq ft NLA, ~S$1.1B development cost, >5% yield on cost, completion 2030/2031, in design and planning.
Two side-by-side tables under section headings with dot markers; blue header rows, status pills in dark blue, light blue and magenta.
About 97% of the AEI space is committed or in advanced negotiation as at 30 Sep 2026, and 16 new brands have been added since launch. Floor-plan zones cover beauty, jewellery and watches, fashion and bags; tenants shown include Sephora, Braun Buffel, CC Primo, GOLDHEART, SK GOLD, Meilleur Moment, Dior Beauty (opening 4Q 2026) and YSL Beauty. A lower strip shows Chanel, Paris Baguette, IM QALB by Pun Im, RUXU & Charlie's Tea and refurbished washrooms completing 1H 2027.
Two stat callout boxes top right, a colour-coded floor plan at left, a 4x2 grid of numbered storefront photos, and a five-photo strip along the bottom.
Section divider for financials and capital management.
Mid-blue background, title at upper left, circles in dark and light blue with a red dot.
Three months ended 30 Sep 2026: gross revenue S$464.5 million (+15.0% YoY) and NPI S$334.9 million (+13.8% YoY), driven by Paragon, Gallileo and CapitaSpring's step-up acquisition, partly offset by the BPP (27 Feb 2026) and AST2 divestments. Retail gross revenue 143.5 vs 151.7, NPI 99.6 vs 108.5; Office gross revenue 151.4 vs 131.3, NPI 111.8 vs 98.2; Integrated Development gross revenue 169.6 vs 120.9, NPI 123.5 vs 87.7 (S$ million, 3Q 2026 vs 3Q 2025).
Two headline banners, then three paired clustered bar charts by portfolio (hatched prior year versus solid current year).
Nine months: gross revenue S$1,311.2 million (+10.0% YoY) and NPI S$965.4 million (+10.4% YoY). Retail gross revenue 435.3 vs 455.4 and NPI 310.2 vs 327.2; Office 465.2 vs 371.6 and NPI 352.8 vs 281.8; Integrated Development 410.7 vs 364.6 and NPI 302.4 vs 265.2 (S$ million, 9M 2026 vs 9M 2025).
Same layout as the previous slide: two headline banners above three paired bar charts per portfolio.
Table as at 30 Sep 2026 vs 30 Jun 2026: aggregate leverage 39.7% vs 37.4%; total borrowings S$11.1 billion vs 9.9 billion; fixed-rate borrowings 76% vs 78%; unencumbered assets 93.1% vs 92.8%; interest coverage ratio 3.8x vs 3.9x; average term to maturity 4.2 vs 4.1 years; average cost of debt 2.8% vs 2.9%; ratings A3 by Moody's and A- by S&P. ICR sensitivity: 3.4x with a 10% EBITDA decline, 2.9x with a 100bps rate increase.
Dark blue slide with a striped two-column comparison table, the current-quarter column highlighted by a dotted frame, and six footnotes.
Stacked bar chart of debt maturities 2026-2035 in S$ million split into MTN, unsecured bank loans, secured bank loans and proportionate ION Orchard borrowings; peak 2028 at 2,137 (18%), 2029 at 1,865 (16%), 2030 at 1,848 (15%), 2031 at 1,858 (16%). Side panel: funding sources MTN 38%, unsecured bank loans 53%, secured 9%; a 1% p.a. rate rise adds an estimated S$26.38 million of interest and cuts DPU by 0.33 cents; sustainability-linked/green loans and bonds outstanding S$8.4 billion, 70.2% of borrowings.
Stacked column chart on the left with percentage labels; right-hand pale-blue sidebar with stacked data blocks.
Section divider with a note that retail and office information covers the respective components of integrated developments unless stated otherwise.
White left half with title and note, right half a grid of blue dots with a red dot breaking the pattern.
Committed occupancy 30 Jun vs 30 Sep 2026: retail 97.7% to 97.3%, office 94.4% to 95.4%, integrated development 95.5% to 96.4%, portfolio 95.6% to 96.1%. WALE (weighted average lease expiry): retail 2.0 years, office 3.0, integrated development 4.4, portfolio 3.1.
Four paired bar columns with a highlighted portfolio column, and a pale-blue WALE band with coloured pills beneath.
Top 10 tenants by gross rental income for Sep 2026: RC Hotels 4.4%, Europaischen Zentralbank 2.0%, GIC 1.6%, Temasek 1.5%, BreadTalk 1.3%, NTUC Enterprise 1.3%, JPMorgan Chase 1.1%, The Work Project 1.1%, Cold Storage Singapore 1.0%, PRADA Singapore 1.0%. Together 16.3%; no tenant above 5%.
Ranked table with rank, tenant, share of GRI and trade sector, and a highlighted total row.
Lease expiry by year as a share of gross rental income: 2026 retail 1.2% / office 1.4%; 2027 retail 19.0% / office 7.1%; 2028 14.9% / 11.0%; 2029 15.2% / 7.1%; 2030 4.9% / 1.6%; 2031 and beyond retail 3.8%, office 8.6%, hospitality 4.2%. Leases in advanced negotiation: 2026 retail 0.7%, office 0.8%; 2027 retail 2.7%, office 3.2%.
Clustered column chart by year with dashed overlays for leases in advanced negotiation and two callout boxes with arrows.
Retail Singapore: new/renewed leases 339,800 sq ft in 1Q, 291,100 in 2Q, 189,600 in 3Q; new leases 17.7%; 9M retention 83.6%. Office Singapore, Germany and Australia: 121,300, 281,900 and 490,000 sq ft; new leases 27.4%; 9M retention 79.1%. Top leasing interest listed for each segment.
Split slide, blue retail half and green office half, each with horizontal bars, a retention figure and three pill tags.
Retail committed occupancy 30 Jun vs 30 Sep 2026: suburban 99.4% to 99.1%, downtown 96.3% to 96.0%, retail portfolio 97.7% to 97.3%, above URA's islandwide Singapore retail occupancy of 93.5%.
Three paired bars with hatched prior quarter and solid current quarter, and four footnotes.
Retail rent reversion (average incoming vs outgoing rents) for 9M 2026: downtown 325 renewals/new leases, 83.7% retention, 8.6% of portfolio, +4.5%; suburban 289, 83.3%, 7.0%, +4.6%; retail portfolio 614, 83.6%, 15.6%, +4.6%. Aim to sustain mid-single-digit reversions.
Table with downtown, suburban and a highlighted retail portfolio row.
Tenant sales psf 9M 2026 vs 9M 2025: portfolio +2.1% (+2.0% LFL), downtown +2.4% (+2.4% LFL), suburban +1.3%. Top trade categories: F&B +1.6% (28.9% of retail GRI), fashion & accessories +1.5% (19.4%), beauty & health +0.8% (13.7%).
Left: three rows of hatched/solid bars with percentage arrows and commentary; right: three category panels.
Eight new-to-portfolio and new-to-market concepts with photos: Osteria Mozza (ION Orchard), Tavola Aperta (The Atrium@Orchard), OJEJE (Raffles City), Goruck (Funan), Yochi (Westgate), Souper Tang (Raffles City), Liora (CQ @ Clarke Quay), Gatten Sushi (ION Orchard).
4x2 photo grid with bold name captions and one-line descriptions on a dark-blue header and footer frame.
Office committed occupancy 30 Jun to 30 Sep 2026: Singapore 96.4% to 97.4%, Germany 85.4% to 86.2%, Australia 94.1% to 97.5%, portfolio 94.4% to 95.4%. Singapore office average rent S$10.98 psf per month (+0.5% YoY; +1.6% excluding AST2 and CSFS areas). Major renewals/new leases include Ericsson at CapitaSky and Justco at Raffles City Tower.
Left paired bars by country; right green panel with a bulleted lease list and a two-line rent chart.
Section divider for focus and outlook.
Deep-blue slide with large navy and light-blue circles and a red dot.
Growth drivers: organic (mid-single-digit reversions, higher occupancy, phased AEI at Tampines Mall 3Q 2026, Lot One 1Q 2027, Plaza Singapura & The Atrium@Orchard 4Q 2028) and inorganic (Paragon acquired 1 Jul 2026, Gallileo AEI handover, CapitaSpring balance 55% acquired 26 Aug 2025). Cost and capital: diversified funding, 70-80% fixed-rate borrowings, Singapore energy costs locked in to Jun 2027.
Rounded panel with three white cards for organic growth, inorganic growth and cost and capital management, each with icons and sub-headings.
Five-pillar strategy to deliver stable distributions and sustainable returns: Strengthening Portfolio, Asset Enhancement, Unlocking Value (divest mature assets and redeploy), Driving Growth, and Capital Management.
Five columns with graded blue icon tiles and bullet lists beneath on a soft blue gradient.
Section divider for sustainability.
Pale-blue background with a halftone dot grid forming a flowing shape and a red dot.
GRESB Real Estate Assessment 2026: Global and Regional Sector Leader (Listed, Diversified Office/Retail), 5-star, score up from 91.7 to 93.5; SIAS Investors' Choice Awards 2026 winner for Corporate Governance (REITs & Business Trust); The Asset Corporate Sustainability Leadership Awards 2026 Platinum. 100% of GFA green-rated: Singapore certifications 86% (BCA Green Mark Platinum 51%), overseas 14%.
Three award cards over a donut chart with a legend of certifications and percentages.
Ten community and shopper-engagement events from April to October 2026, including HPB Get Fit!, Kiehl's skincare masterclass at CapitaSpring, Youth & Family Carnival Mass Walk at Junction 8, Sanrio pop-up at Bugis+, TOUCHpoint@Capital Tower opening and INNERDRIVE 2026 at Plaza Singapura.
Two rows of five photo cards with month tags and captions.
Section divider for market information.
Mid-blue background with navy, white-outline and a large red circle cluster.
Singapore 3Q 2026 GDP +5.4% YoY (advance estimate), 2026 forecast 4.5%-5.5%; MAS core inflation 2.0% (Sep), forecast 1.5%-2.0%; unemployment 2.0%; population 6.21 million. Australia GDP 2.1%, forecast 1.9%, trimmed mean inflation 3.6%, unemployment 4.7%. Germany GDP 1.0%, forecast 1.1%, core inflation 2.4%, unemployment 4.3%.
Three country rows with flags and colour-coded stat cards (blue, pink, green), and source notes.
Singapore private retail net supply and demand 2016-2029F in million sq ft, with forecast average annual gross new supply of 0.5M sq ft (4Q 2026-2029). Prime rents: Orchard Road S$39.05 psf (+1.8% YoY), suburban S$33.05 psf (+1.2% YoY). Average annual net supply 0.4 and demand 0.4 (10-year).
Top column chart, bottom-left rent line chart, bottom-right summary table.
Table of proposed retail projects by completion year, submarket, location and NLA; subtotals 140,600 sq ft (2026), 575,900 (2027), 414,000 (2028), 602,200 (2029), total 1,732,700 sq ft. No new development above 180,000 sq ft.
Dense table grouped by year with subtotal rows and a highlighted total.
Retail sales excluding motor vehicles YTD Aug 2026 S$29.7B, +3.1% YoY; average monthly S$3.7B; online share 18.0% (range 13.3% to 19.5%). Annual comparison 2019-2025. Aug 2026 +1.6% YoY at S$3.8B.
Summary table above a monthly column chart with online-share line.
Tourist arrivals 16.9M in 2025 (+2.3%), 2026 forecast 18.0M; YTD Aug 2026 11.4M, -1.7%; receipts S$32.8B in 2025 (+10.0%). Top five source markets about 55%: China 21%, Indonesia 13%, Australia 7%, Malaysia 7%, India 7%. July-August arrivals 18.6% above January-June average.
Combined column and line chart at left, donut chart of geographies at right.
Singapore Central Area net supply and demand 2016-2029F; forecast average annual gross new supply 0.9M sq ft (4Q 2026-2029). Grade A rents S$12.75 psf, +2.0% QoQ and +4.5% YoY.
Column chart on top, rent line chart and summary table below on green panels.
Proposed office projects for 2027-2029: subtotals 604,800 sq ft (2027), 1,928,500 (2028), 538,500 (2029); total 3,071,800 sq ft, 2,875,300 excluding strata office. No commercial sites in CBD Core on the GLS reserve and confirmed lists.
Table grouped by year with subtotals and a green total band.
Only 13k sq m new supply in the quarter; highest quarterly take-up in 9M 2026; prime rents EUR56.00 per sq m per month (+1.8% QoQ, +2.8% YoY); vacancy 12.3% (+1.1 ppt QoQ); 2026 take-up expected at 400k sq m.
Four icon cards over a combined bar and line chart of supply, demand and vacancy.
Positive leasing demand for the 11th consecutive quarter; no completions, total supply 5.4M sq m; net absorption 17,900 sq m; prime net effective rents +1.7% QoQ and +9.0% YoY to A$875/sqm; vacancy 13.6% (-0.3 ppt QoQ).
Four icon cards over two charts of supply, absorption, vacancy and rent.
Demand turned positive: net absorption 8,600 sq m, highest in 5 years; supply 949K sq m; prime net effective rents +0.1% QoQ, +5.8% YoY at A$523/sqm; vacancy 25.4% (-1.4 ppt QoQ).
Same four-card plus two-chart layout.
Closing slide with investor relations contact details and the cict.com.sg website.
Navy slide with large title, flowing dotted line art with a red dot, logo top left and contact block bottom left.
Definitions of abbreviations used in the deck, including 9M/3Q 2026, AEI, AST2, DPU, GRI, LFL, MTN, NLA, NPI, QoQ, REIT, WALE, YoY and YTD.
Two-column ruled table of abbreviation and meaning.
Preguntas comunes sobre esta diapositiva y el contenido de la presentación subyacente.
It is the CapitaLand Integrated Commercial Trust (CICT) business update for the third quarter and first nine months of 2026, dated 29 October 2026. Its 41 slides cover highlights, financial performance, capital management, portfolio performance across retail, office and integrated developments, outlook and strategy, sustainability and Singapore, Frankfurt and Sydney market data.
3Q 2026 gross revenue was S$464.5 million (up 15.0% year-on-year) and net property income (NPI) S$334.9 million (up 13.8%). For 9M 2026, gross revenue was S$1,311.2 million and NPI S$965.4 million (up 10.4%). S$ means Singapore dollars. Portfolio occupancy was 96.1% and aggregate leverage 39.7%.
Occupancy is the share of lettable space that is leased. Rental reversion compares new rents on renewed or new leases with the rents they replace; the deck reports +4.6% for retail and +7.1% for office over 9M 2026. Gearing is shown as aggregate leverage, debt as a share of assets (39.7% at 30 Sep 2026). DPU is distribution per unit, the cash paid to each unitholder; this update gives DPU sensitivity to rates rather than a DPU figure.
3Q 2026 is the three months ended 30 September 2026 and 9M 2026 is the nine months ended 30 September 2026, as defined in the glossary on slide 41. Figures include Paragon from 1 July 2026 and exclude Asia Square Tower 2, divested on 17 September 2026.
CICT is Singapore's largest REIT and an STI component. It lodged the 3Q 2026 Business Updates presentation with SGX (Singapore Exchange) on 29 October 2026 as an SGX announcement attachment. Singapore REITs on half-yearly reporting publish a business update rather than full financial results for the first and third quarters.
The deck is in English. Here it is available as page images, a PDF and an editable PPTX file.
Yes. It is a useful reference for structuring a REIT or property quarterly update: KPI dashboards, bar charts, lease expiry and debt maturity charts, tenant tables and market slides. The CapitaLand and CICT logos, trademarks, photographs and figures belong to the company and should not be reused as your own.
It covers Paragon, Tampines Mall, Raffles City Singapore, ION Orchard, Plaza Singapura, CapitaSpring and the Asia Square Tower 2 divestment, plus the Hougang Central development. Market slides cover Singapore retail and office rents and supply, tourism, and the Frankfurt, Sydney CBD and North Sydney CBD office markets.

Create Your Own Slides
Turn your ideas into professional presentations in seconds with 2slides AI.
Referencia diseños profesionales, elige tu estilo y genera diapositivas con renderizado de texto perfecto. Impulsado por Nano Banana—comienza a crear tu presentación ahora.
Tu Agente IA para diapositivas. Ahorra tiempo, brilla más rápido con la creación inteligente de presentaciones.


© 2026 2slides. Todos los derechos reservados.