
Forma parte de Ejemplos de presentaciones para inversores · Ejemplos de presentaciones para inversores de la India
Adani Power Q2 FY27 Earnings Presentation (23 October 2026): Adani Power Limited's 36-slide results deck for the quarter and half-year ended 30 September 2026, filed with BSE/NSE. It covers operating and financial snapshots, the Adani portfolio context, the 18,330 MW operating fleet and 23,720 MW locked-in pipeline, revenue and EBITDA bridges, debt profile and credit ratings, capacity expansion progress, ESG and governance, the investment case, and historical P&L and balance sheet annexures. Amounts are in ₹ crore (INR Cr) as written in the deck.
Usa la portada de esta presentación como referencia de estilo para diapositivas creadas con tu propio contenido. O elige cualquier página de abajo para usar su diseño como referencia.
Navegación Rápida
Etiquetas
Compartir las diapositivas
Adani Power Q2 FY27 Earnings Presentation (23 October 2026): Adani Power Limited's 36-slide results deck for the quarter and half-year ended 30 September 2026, filed with BSE/NSE. It covers operating and financial snapshots, the Adani portfolio context, the 18,330 MW operating fleet and 23,720 MW locked-in pipeline, revenue and EBITDA bridges, debt profile and credit ratings, capacity expansion progress, ESG and governance, the investment case, and historical P&L and balance sheet annexures. Amounts are in ₹ crore (INR Cr) as written in the deck.
Vista detallada de cada página de diapositiva, incluyendo diseño, contenido clave y elementos visuales.
Title slide reading 'Adani Power Limited – Earnings Presentation – Q2 FY27 | 23rd October 2026', with the Adani 'Growth With Goodness' tagline.
Full-bleed illustrated artwork (people, power lines, port, wind turbines, factories) with the logo top-left and title block right-aligned in the upper half above a gradient rule.
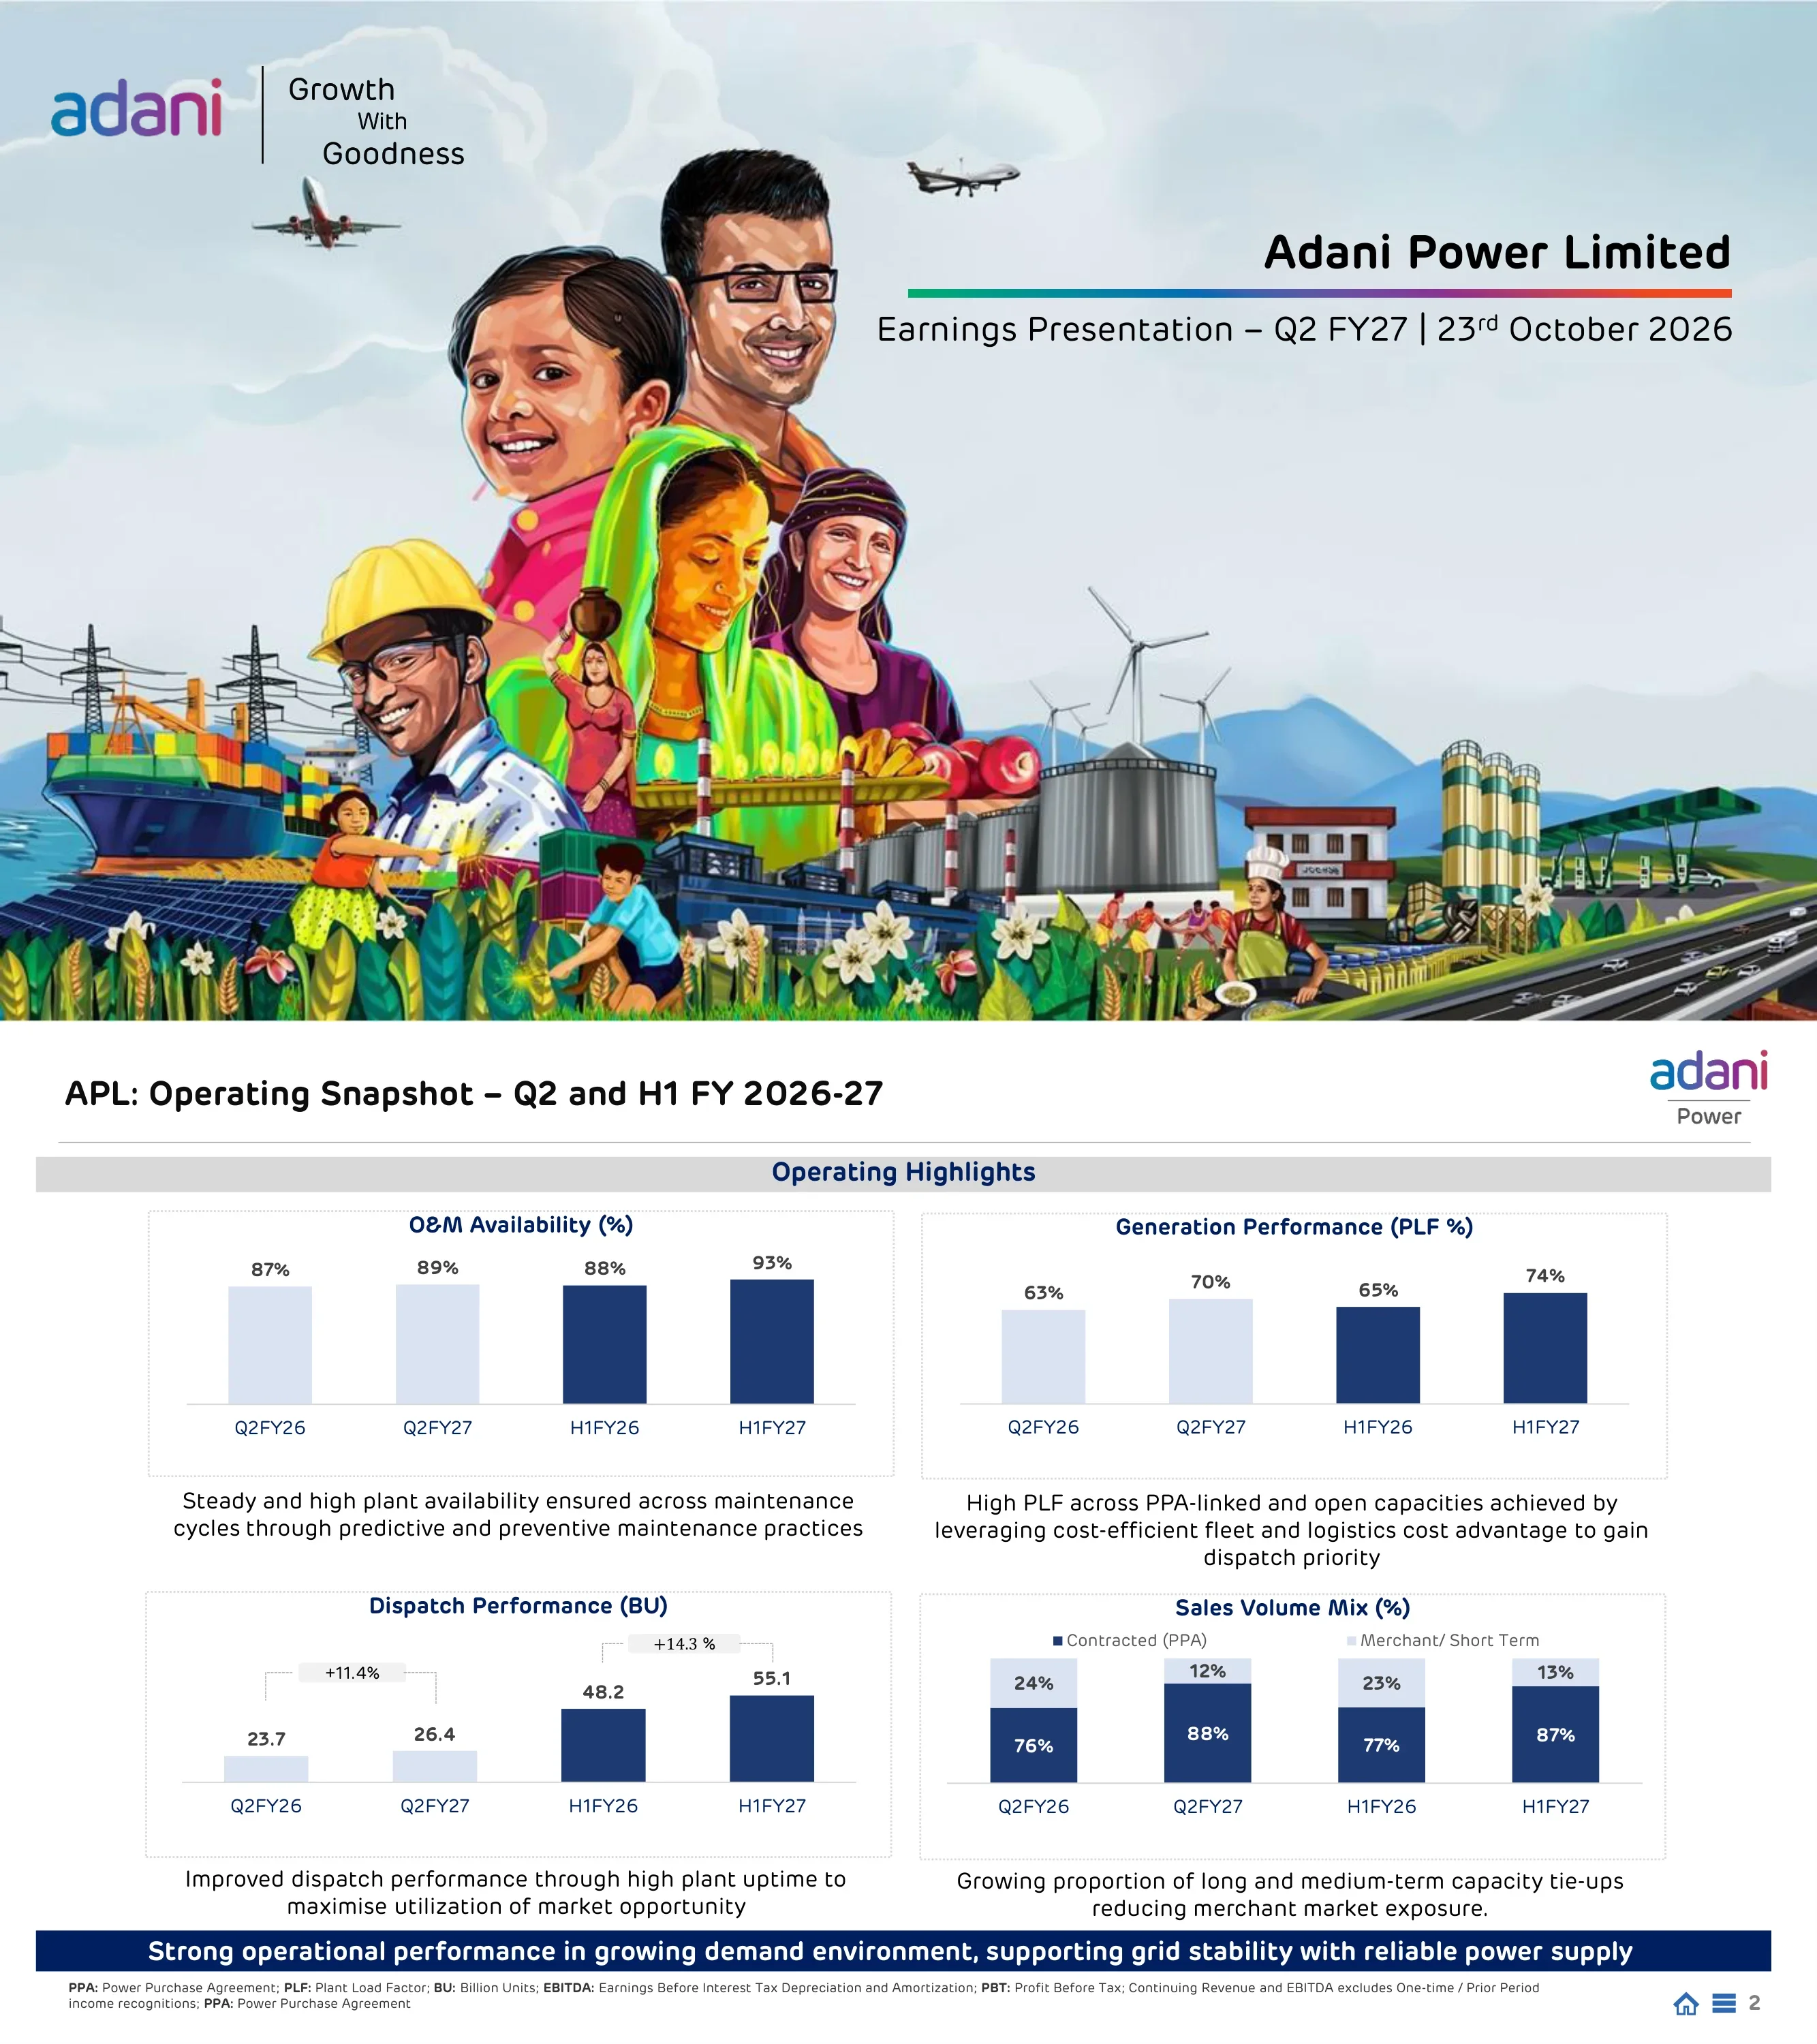
O&M availability rose to 89% in Q2 FY27 (87% Q2 FY26) and 93% in H1; PLF 70% vs 63% (H1 74% vs 65%); dispatch 26.4 BU vs 23.7 BU (+11.4%), H1 55.1 BU vs 48.2 BU (+14.3%); contracted PPA share of sales rose to 88% in Q2 (87% in H1), cutting merchant exposure.
Grey 'Operating Highlights' band over a 2x2 grid of dotted-border chart panels, each with a one-line commentary beneath; navy takeaway banner at the bottom.
Continuing revenue ₹17,528 Cr in Q2 FY27 vs ₹13,639 Cr (+28.5%), H1 ₹35,464 Cr (+27.5%); continuing EBITDA ₹6,321 Cr vs ₹5,333 Cr (+18.5%), H1 ₹13,304 Cr (+20.1%); PAT ₹7,019 Cr vs ₹2,906 Cr, H1 ₹11,886 Cr vs ₹6,212 Cr. Growth driven by 11.4% higher dispatch, PPA tariff Rs 6.4/unit (+12.7%) and merchant realisation Rs 7.2/unit (+33.1%).
Left column of three stacked bar-chart panels (revenue, EBITDA, PAT); right column of three explanatory text blocks aligned to each chart; navy takeaway banner.
Standard forward-looking statements disclaimer covering Adani Power Limited and its subsidiaries, associates and JVs ('Adani Thermal Power Group'), stating the deck is not an offer of securities, including in the United States.
Single full-width justified text block under the slide title.
Seven sections: About Adani Portfolio; About Adani Power Limited (APL); APL Quarterly Performance Highlights; Debt Profile; Progress in Capacity Expansion Projects; ESG Practice at APL; APL: Investment Case.
Right-half numbered list separated by dotted rules, with a large navy 'Contents' heading; left half left white.
Section divider introducing the Adani group portfolio overview.
Large light-grey section number '1' right-aligned above a bold grey section title on a white background.
Group structure chart: flagship incubator AEL (71.97%), energy & utility (AGEL 62.43%, APL 74.96%, AESL 73.39%, ATGL 37.40%), transport & logistics (APSEZ 66.03%, airports, roads), materials (Ambuja Cements 67.29%, ACC 50.05%, Orient 72.66%), and other holdings such as NDTV (69.02%); promoter holdings as of 30 September 2026.
Organisation chart arranged in four vertical category columns with blue gradient company boxes and equity percentages; APL box highlighted with a green border; dense footnotes and a navy banner.
Group EBITDA grew from ₹24,870 Cr in FY19 to ₹94,834 Cr in FY26 (EBITDA CAGR 21%), with cash after tax (FFO) reaching ₹67,995 Cr (72% of EBITDA; FFO CAGR 27%); an India map plots sites of AEL, APSEZ, AGEL, ATGL, AESL, APL and Ambuja; core infra platform serves a 375 Mn userbase.
Two halves: left stacked area chart (tax paid, finance cost paid, FFO) with CAGR labels; right India dot map with company legend and a blue gradient '375 Mn userbase' tile.
Group operating model from development (Adani Infra, Cemindia Projects, PSP Projects) to operations (AIMSL) to consumers, with flagship examples (Mundra port, Mundra–Mohindergarh HVDC line, Khavda renewable cluster, ENOC), capital management principles, and long-term debt mix shifting from March 2016 (55%/31%/14%) to a diversified Mar'26 mix across PSU banks, private banks, USD bonds, DII, global banks, NBFCs and capex LC.
Matrix table with rows (activity, performance, capital management, enabler) and columns (development, operations, consumers); photo strip in the performance row; two donut charts for debt mix.
Section divider introducing the company overview.
Large pale section number '2' with bold grey section title on white.
India map of 18 GW operating plants (e.g. Mundra 4,620 MW, Tiroda 3,300 MW) plus 24 GW locked-in and 3 GW proposed for a 45 GW target; asset metrics (18,330 MW, 13 assets; 23,720 MW locked-in across 13 projects by FY32; 95%+ PPAs tied up; 14,640 MW new PPAs); H1 FY27 revenue ₹39,273 Cr (+36%), EBITDA ₹17,112 Cr (+41%), continuing EBITDA ₹13,304 Cr (+20%), PAT ₹11,886 Cr (+91%), net debt ₹45,846 Cr, net debt to continuing EBITDA 1.91x, RoCE 22.1%, RoE 27.0% (TTM).
Left: India map with plant callouts on both sides and a legend formula (operating + locked-in + proposed = target); right: two columns of shadowed KPI cards for asset details and H1 FY27 vs FY26 metrics.
Operating capacity 18,330 MW (14 assets; 59% organic, 95% under PPA) plus locked-in 23,720 MW (13 projects; 100% organic, 94% ultra-supercritical, 62% PPA tied so far) equals target 42,050 MW across 18 assets (57% ultra-supercritical); ongoing thermal PPA bids exceed 16 GW.
Three equal panels joined by '+' and '=' symbols, each with a header stat block and horizontal 100% stacked bars for asset type, technology and PPA tie-ups.
State table of population, per-capita GDP and power use (India average 1,460 kWh); Vision 2047 energy demand 6,400 BU, peak 708 GW, installed 2,100 GW; 97 GW additional coal capacity needed by FY35, of which APL's 23.7 GW pipeline is about 30%; capacity mix 559 GW (Sept '26) to 997 GW (FY32E); state discoms awarded 22,220 MW of thermal PPAs, 15,265 MW to APL; 16,660 MW of bids ongoing.
Three columns: left state data table with check-mark bullets; centre stat boxes and two pie charts; right PPA award stats and a state-by-state award table.
Section divider introducing the quarterly results section.
Large pale section number '3' with bold grey title on white.
Operations: Letter of Award from Uttarakhand Power Corporation for a 25-year 1,320 MW PSA (1,234 MW net); APL named successful resolution applicant for GVK Energy (330 MW Alaknanda hydro plant); amalgamation of 10 wholly owned subsidiaries; shareholders' agreement with Druk Green Power for the 770 MW Chamkharchhu hydro project in Bhutan (49:51); CARE Ratings and India Ratings upgrades to AA+/Stable. ESG: water use 2.28 m³/MWh inland (35% below the 3.50 limit), S&P Global CSA score 71/100, NSE Sustainability ESG score 66.
Two stacked sections, each with a navy label block on the left and a light-grey panel of bold topic labels with arrow-led descriptions on the right.
Base-load capacity expansion to 45 GW by FY 2031-32 via 23.7 GW of thermal projects (estimated capex ₹2 trillion) plus 3 GW more; 5 GW hydro collaboration in Bhutan with DGPC (570 MW Wangchhu, 770 MW Chamkharchhu-I); Adani Atomic Energy Ltd. set up to target 10 GW of nuclear capacity by 2035, with sites identified.
Three stacked grey cards with blue headings and arrow bullets on the left; matching column of line-art illustrations (thermal plant, hydro dam, nuclear plant) on the right.
Quarterly P&L table: sales volume 26,385 MU (+11.5%); continuing operating revenue ₹17,014 Cr; total continuing revenue ₹17,528 Cr; one-time prior period income ₹2,422 Cr; reported revenue ₹19,951 Cr (+39.44%); fuel cost ₹10,229 Cr; continuing EBITDA ₹6,321 Cr; reported EBITDA ₹8,743 Cr; finance cost ₹760 Cr; PBT ₹6,792 Cr; PAT ₹7,019 Cr (+141.51%), with H1 and FY26 columns. Notes: PPA dispatch 23.2 BU vs 18 BU, merchant 3.2 BU vs 5.6 BU.
Full-width financial table with grey-shaded % change columns and a vertical rule before FY26; three square bullets of commentary below.
Reported total revenues from ₹27,842 Cr (FY20) to ₹57,865 Cr (FY26) and ₹39,273 Cr in H1 FY27; reported PAT from -₹2,275 Cr (FY20) to ₹12,971 Cr (FY26) and ₹11,886 Cr in H1 FY27; reported EBITDA stacked into continuing and one-time (continuing EBITDA FY22–FY26 CAGR 24%); senior term debt/equity falling from 5.32x (Mar-20) to 0.62x (Sep-26).
2x2 grid of column charts separated by dotted lines, with the H1 FY27 / Sep-26 bar in each chart enclosed in a dashed highlight box.
Q2 bridge: reported ₹14,308 Cr less one-time ₹669 Cr gives continuing ₹13,639 Cr; +₹1,507 Cr volume, +₹2,400 Cr rate, -₹19 Cr other income to ₹17,528 Cr continuing, +₹2,422 Cr one-time to ₹19,951 Cr reported. H1 bridge: ₹28,881 Cr to ₹27,807 Cr continuing, +₹3,822 Cr volume, +₹3,934 Cr rate, -₹98 Cr, to ₹35,464 Cr and ₹39,273 Cr reported.
Two horizontal waterfall charts stacked vertically, separated by a dotted line, with a navy takeaway banner at the bottom.
Q2 bridge: continuing EBITDA ₹5,333 Cr plus ₹1,507 Cr volume and ₹2,400 Cr rate, less ₹19 Cr other income, ₹659 Cr fuel volume and ₹2,355 Cr fuel price, plus ₹112 Cr lower opex, to ₹6,321 Cr continuing and ₹8,743 Cr reported after ₹2,422 Cr one-time. H1: ₹11,076 Cr to ₹13,304 Cr continuing (fuel volume -₹2,210 Cr, fuel price -₹3,024 Cr, opex -₹197 Cr) and ₹17,112 Cr reported.
Two stacked 12-step waterfall charts with category labels beneath, navy banner at bottom.
Section divider introducing debt and capital structure.
Large pale section number '4' with bold grey title on white.
As of 30 September 2026: senior secured loans ₹48,889 Cr, working capital loans ₹12,703 Cr, total gross debt ₹61,860 Cr, cash ₹16,014 Cr, net debt ₹45,846 Cr (₹2.50 Cr/MW), net fixed assets ₹1,14,070 Cr (2.49x net debt), TTM continuing EBITDA ₹24,029 Cr and net debt/continuing EBITDA 1.91x (2.12x at March 2026), compared with March 2024–2026.
Full-width four-period table with bold subtotal rows; key ratio rows enclosed in a dashed box; navy banner beneath.
Rating track record: 9 notches of upgrades in 7 years, coverage expanded to four agencies; by August 2026 CareEdge and India Ratings at AA+/Stable, CRISIL and ICRA at AA/Stable. Net debt to continuing EBITDA fell from 9.75x (FY19, net debt ₹45,957 Cr, EBITDA ₹4,715 Cr) to 1.91x (Sep'26 TTM, net debt ₹45,846 Cr, EBITDA ₹24,029 Cr).
Top-left gradient '7 years / 9 notches' tile beside a rating table with agency logos; bottom-left combo chart; right column of key rating highlights and three before/after stat card pairs.
Section divider introducing project execution updates.
Large pale section number '5' with bold grey title on white.
Strategic advantages: 60% brownfield, 63% near-pithead, 100% land available, 100% BTG ordered (22.4 GW of BTG sets). Project status table for 12 projects (e.g. Korba Ph-II 1,320 MW, Mahan Ph-II 1,600 MW, Raipur Ph-II & III 3,200 MW, Pirpainti 2,400 MW, Chapar 3,200 MW) totalling 23,720 MW with 100% land and equipment, 87% environmental clearance and 14,460 MW of PPAs signed.
Left: four stat cards above three derisked-execution text panels; right: project status matrix with green check marks, 'In progress' and 'Bids ongoing' cells and a totals row.
Capacity tie-up waterfall from 18,330 MW installed through PPAs won from May '20 to Oct '26 (Uttarakhand 1,320 MW) and 9,080 MW in progress to a 42,050 MW target; expansion timeline adding 1,320 MW (FY27) to 5,600 MW (FY32); upcoming PPA bids of 16,660 MW (Uttar Pradesh 4,000, Gujarat 4,000, West Bengal 3,860, Rajasthan 3,200, Andhra Pradesh 1,600); states have awarded 20.6 GW since FY 2024-25, of which APL won 13.9 GW.
Left: two waterfall charts (tie-ups and expansion timeline); right: upcoming bids table and a 'Promising Demand Outlook' bullet card.
Construction photos from Mahan Phase-II (2x800 MW), Raipur Phase-II (2x800 MW), Raigarh Phase-II (2x800 MW) and Korba Phase-II (2x660 MW), showing boilers, main power house, control rooms, chimney work and feed water heater insulation.
Four columns, each with a navy project header and three captioned photographs stacked vertically.
Section divider introducing ESG.
Large pale section number '6' with bold grey title on white.
Material topics and targets: GHG intensity reduction to 0.84 tCO2e/MWh by FY27 (0.86 in FY26), single-use-plastic-free certification for all 13 operating locations, zero health and safety injuries; water intensity 2.28 m³/MWh inland and 2.18 all plants, zero liquid discharge, 1.82 million CSR beneficiaries; ratings: S&P Global CSA 71/100, NSE 66, Sustainalytics 31.7, FTSE Russell 4.3/5, CareEdge ESG 80/100, CDP B.
Four-column table (material topic, target, key initiatives, UN SDGs) with green icons, a dense bullet column and a grid of UN SDG tiles; green 'Updated' tag top-right.
Committee table (5 statutory, 6 non-statutory committees; 100% of statutory committees chaired by independent directors), governance pathway (ID tenure, management ownership, third-party RPT review, ID training), and board profiles: independent directors Sangeeta Singh, Manmohan Srivastava, Shailesh Haribhakti, Narendra Nath Misra; non-independent Gautam Adani (Chairman), Rajesh Adani, Anil Sardana (MD), Shersingh Khyalia (Whole-time Director and CEO).
Left: committee check-mark table with percentage stats and a governance card; right: two rows of four circular black-and-white portraits with names and expertise.
Section divider introducing the investment case.
Large pale section number '7' with bold grey title on white.
Six pillars: coal critical for base load; efficient diversified portfolio (18.33 GW across 9 states, 7.5 GW stressed assets turned around); operational excellence (90%+ availability, 40% EBITDA margin); locked-in growth (100% land and BTG for 23.7 GW, 60% brownfield); massive addressable market (97 GW needed by 2035, two-part tariffs); robust capital structure funded largely by internal accruals. Conclusion: market leader in base-load power with industry-leading return on capital.
Six navy label blocks on the left paired with bullet panels; right column with a summary statement card and a 'locked-in growth + market + derisked PPA' equation card.
Closing slide.
White slide with bold navy 'Thank You' right-aligned in the lower half.
Divider introducing the historical financial annexures.
White slide with grey 'Annexures' title and subtitle right-aligned in the lower half.
FY22–FY26 and H1 FY27 operating metrics (effective capacity 12,450 to 18,150 MW, PLF 74% in H1 FY27, PPA realisation ₹6.06/kWh, merchant ₹7.12/kWh) and P&L (total income ₹31,686 Cr to ₹57,865 Cr, EBITDA ₹23,431 Cr in FY26, PAT ₹12,971 Cr in FY26; H1 FY27 EBITDA ₹17,112 Cr, margin 44%, PAT ₹11,886 Cr, EPS ₹6.08) with FY22–26 CAGRs; Q2 FY27 insights: revenue from operations ₹19,439 Cr, EBITDA ₹8,743 Cr, PAT ₹7,019 Cr.
Wide multi-year table on the left with blue sub-section labels and red negative CAGRs; right sidebar of large 'Q2 FY27 Insights' figures.
Balance sheet March 2022 to 30 September 2026: gross fixed assets incl. CWIP ₹1,52,705 Cr (CWIP ₹45,539 Cr), total assets ₹1,65,640 Cr, cash ₹16,014 Cr, total equity ₹78,377 Cr, long-term borrowings ₹49,158 Cr, short-term ₹12,703 Cr; RoA 18.7%, RoCE 22.1%, RoE 27.0% (Sep '26 TTM).
Wide six-period balance sheet table on the left; right sidebar of key insight figures for fixed assets, cash and return ratios.
Preguntas comunes sobre esta diapositiva y el contenido de la presentación subyacente.
It is Adani Power Limited's 36-slide results presentation dated 23 October 2026, covering the quarter and half-year ended 30 September 2026. It was filed with BSE/NSE alongside the company's results and includes operating and financial snapshots, revenue and EBITDA bridges, the debt profile, capacity expansion progress, ESG, governance and historical financials.
Continuing revenue was ₹17,528 crore (+28.5% YoY) and continuing EBITDA ₹6,321 crore (+18.5%). Including ₹2,422 crore of one-time prior period income, reported revenue was ₹19,951 crore and reported EBITDA ₹8,743 crore. Profit after tax was ₹7,019 crore versus ₹2,906 crore a year earlier.
Indian companies follow an April–March fiscal year, so FY27 runs from April 2026 to March 2027. Q2 FY27 is July to September 2026, and H1 FY27 is April to September 2026.
Adani Power separates one-time or prior period income (such as realisation of past dues from customers) from its ongoing business. 'Continuing' revenue and EBITDA exclude those one-time items; 'reported' figures include them. The revenue and EBITDA bridges on slides 19–20 show both.
A crore is an Indian unit equal to 10 million. ₹17,528 Cr therefore means ₹175.28 billion. The deck also uses Indian digit grouping, so 1,14,070 is 114,070 crore.
Yes. The page offers the original PDF and an editable PPTX that was converted from the PDF. The PPTX is a machine conversion rather than the company's original source file, so fonts, charts and alignment may need some cleanup before reuse.
The 2x2 KPI chart grid (slide 2), the waterfall bridges (slides 19–20), the capacity equation panels (slide 12), the project status matrix with check marks (slide 25) and the dense financial tables (slides 17, 22, 35, 36) are good references for an earnings deck.
The deck targets 45 GW of base-load capacity by FY 2031-32 through 23.7 GW of thermal projects with estimated capex of ₹2 trillion plus 3 GW more, a 5 GW hydro collaboration in Bhutan with Druk Green Power, and a nuclear subsidiary (Adani Atomic Energy Ltd.) targeting 10 GW by 2035.

Create Your Own Slides
Turn your ideas into professional presentations in seconds with 2slides AI.
Referencia diseños profesionales, elige tu estilo y genera diapositivas con renderizado de texto perfecto. Impulsado por Nano Banana—comienza a crear tu presentación ahora.
Tu Agente IA para diapositivas. Ahorra tiempo, brilla más rápido con la creación inteligente de presentaciones.


© 2026 2slides. Todos los derechos reservados.