
Teil von Investorenpräsentationen als Beispiel · Beispiele für indische Investorenpräsentationen
UPL Q2 FY27 Earnings Presentation: UPL Limited's 55-slide investor presentation of consolidated financial results and business update for Q2 and H1 FY27 (quarter ended 30 September 2026), dated 2 November 2026 and filed with BSE/NSE. Q2 FY27 revenue was ₹11,860 crore (down 1% YoY), EBITDA rose 5% to ₹2,312 crore at a 19.5% margin (+120 bps, the eighth straight quarter of margin and EBITDA improvement), and operational PATMI rose 3% to ₹422 crore. H1 FY27 revenue was ₹22,041 crore (+4%) with EBITDA of ₹3,812 crore (+9%). Net debt stood at US$2,993 million (2.9x net debt/EBITDA on a TTM basis), and FY27 guidance is 7–11% revenue growth and 10–14% EBITDA growth. Indian fiscal year FY27 runs April 2026 to March 2027, so Q2 FY27 covers July–September 2026.
Nutzt das Titelbild dieser Präsentation als Stilvorlage für Folien aus eigenen Inhalten. Alternativ eine beliebige Seite unten wählen und ihr Layout als Vorlage nehmen.
Schnellnavigation
Tags
Folien teilen
UPL Q2 FY27 Earnings Presentation: UPL Limited's 55-slide investor presentation of consolidated financial results and business update for Q2 and H1 FY27 (quarter ended 30 September 2026), dated 2 November 2026 and filed with BSE/NSE. Q2 FY27 revenue was ₹11,860 crore (down 1% YoY), EBITDA rose 5% to ₹2,312 crore at a 19.5% margin (+120 bps, the eighth straight quarter of margin and EBITDA improvement), and operational PATMI rose 3% to ₹422 crore. H1 FY27 revenue was ₹22,041 crore (+4%) with EBITDA of ₹3,812 crore (+9%). Net debt stood at US$2,993 million (2.9x net debt/EBITDA on a TTM basis), and FY27 guidance is 7–11% revenue growth and 10–14% EBITDA growth. Indian fiscal year FY27 runs April 2026 to March 2027, so Q2 FY27 covers July–September 2026.
Detaillierte Ansicht jeder Folien-Seite, einschließlich Layout, wichtigem Inhalt und visuellen Elementen.
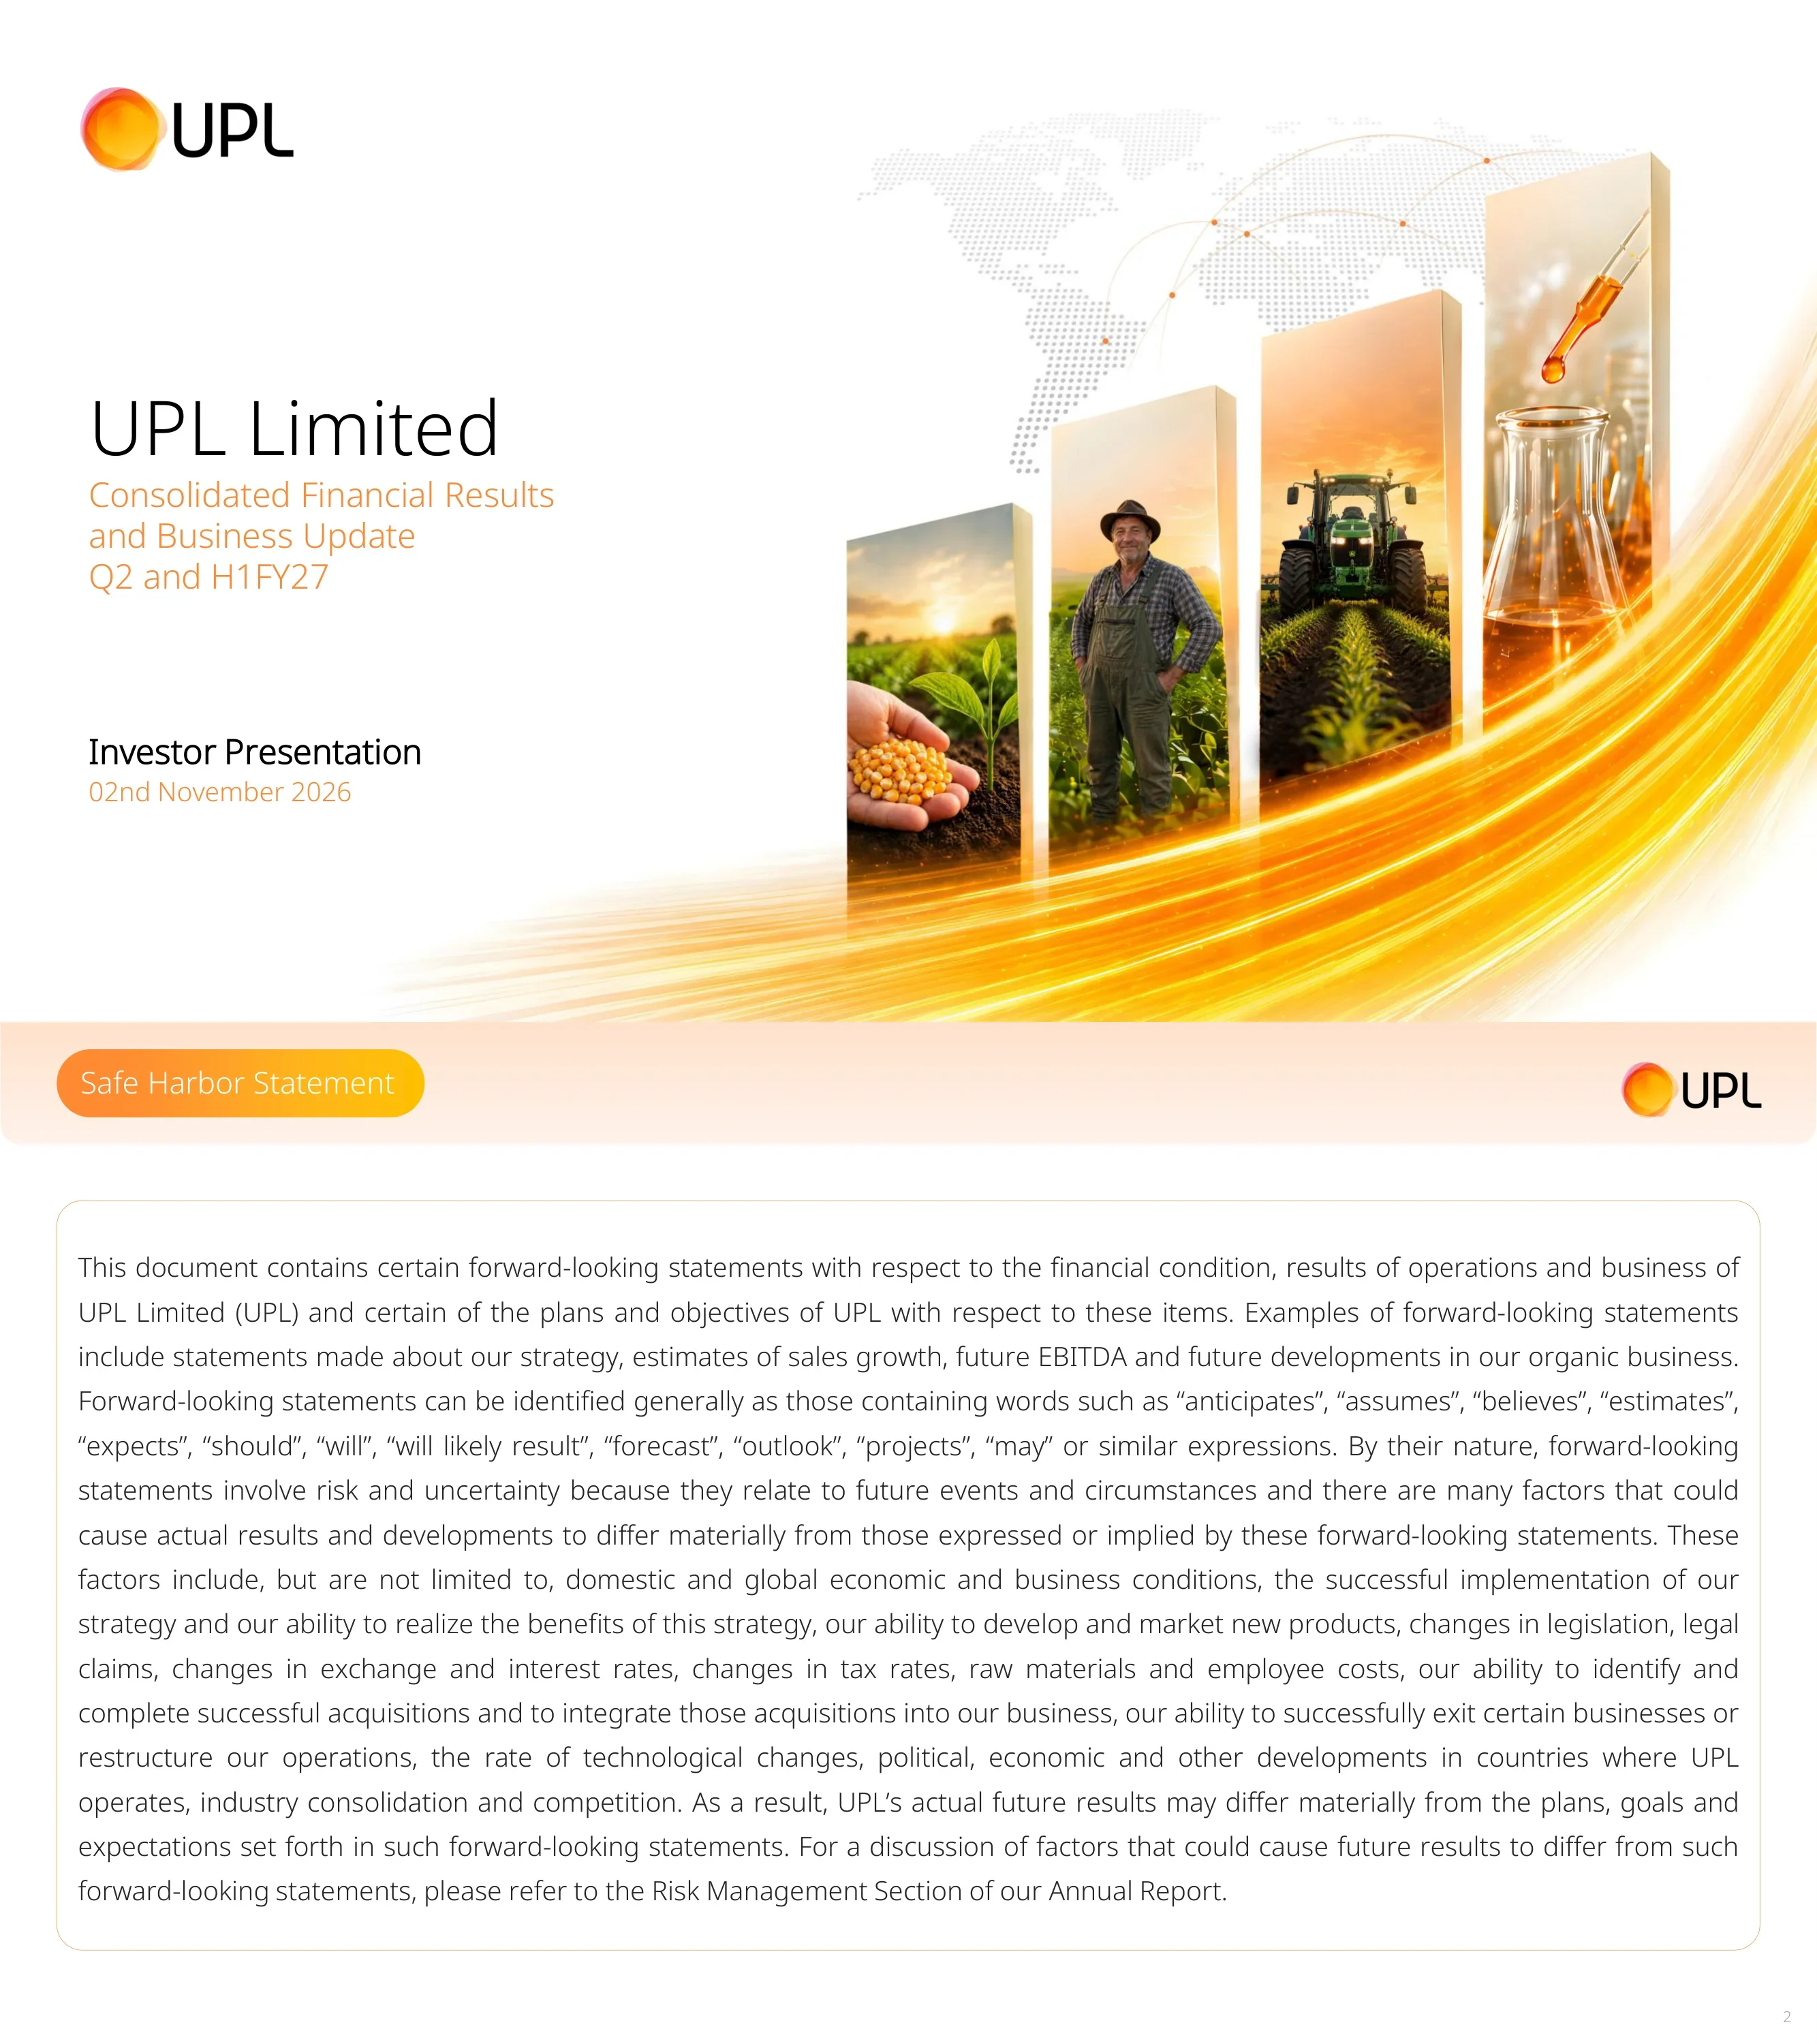
Cover slide: UPL Limited, Consolidated Financial Results and Business Update for Q2 and H1 FY27, Investor Presentation dated 2 November 2026.
Left-aligned title block with company name, orange subtitle and date; right side shows four rising photo panels over a dotted world map with an orange light swoosh.
Standard forward-looking statements disclaimer covering strategy, sales growth and EBITDA estimates, and risks such as economic conditions, legislation, exchange and interest rates, raw material costs, acquisitions and competition; refers readers to the Risk Management section of the Annual Report.
Orange pill header, single rounded text box with justified paragraph.
Presenters: Bikash Prasad (Group CFO, UPL Limited), with senior management Sameer Tandon (Divisional President APAC, Africa & Europe, UPL Corp), Ashish Dobhal (Divisional President Americas, UPL Corp), Raj Tiwari (CEO, SUPERFORM), Bhupen (CEO, Advanta) and Ravi Cherukuri (CEO, UPL SAS).
One featured presenter card on top and five smaller pill cards below, each with business name, person name, role and headshot.
Agenda: I. Financial and Business Segment (macro and corporate updates, Q2/H1 performance, P&L and balance sheet analysis, business updates for SUPERFORM, UPL Corp/UPL SAS and Advanta), II. FY27 Guidance, III. Others (group strategy and ESG, board and leadership), and a glossary, with page ranges.
Hierarchical table of contents with orange and italic sub-items, right-hand navy page-number tabs, decorative orange blob on the left.
Group scale: outreach to >140 countries, #5 in global agchem and #10 in global seeds, leading biosolutions player, ranked #1 agchem company in ESG (DJSI); 43 crop protection and 32 seed processing sites, 57 crop protection and 39 seed R&D centres; >30% of agchem portfolio IP-protected, >22,000 product registrations, >3,600 patents, ~16% agchem innovation rate and ~20% seeds innovation index.
Three-row icon grid (Global Footprint, Manufacturing, Innovation) with large white KPI numbers over a dark crop-field photo.
Four platforms anchored in moats: UPL Corp (global crop protection; IP, brands, registrations, 27 planned new molecules; #1 global post-patent company), UPL SAS (India crop protection; strong brands, pan-India distribution, digital-first; leading player in India), SUPERFORM (AI and specialty chemicals manufacturing; 50+ years in hazardous chemistries, 1,000+ industrial customers in 12 industries; largest Indian manufacturer for key chemistries), Advanta (50+ years germplasm R&D, 900+ hybrids, 79 patents in 50 countries; #2 post-harvest and #10 seeds).
Org-tree connector into four dark columns of stacked attribute cards, ending in coloured outcome tiles; refinery-at-sunset background.
Section divider opening the macro and corporate update section.
Large orange title on dotted grid background with a circular-cropped tractor photo on the right.
Five macro themes: continuing geopolitical volatility, El Niño impact on planting and output, US tariff uncertainty, stress on farm economics, and rising commodity prices setting up better farm economics. Bloomberg charts (US$/bu, Apr'22–Sep'26) show soybean up ~30% from 10.1 (Sep'25) to 13.2 (Sep'26), wheat up ~35% from 5.2 to 7.0 and corn up ~25% from 4.2 to 5.3.
Numbered 01–05 theme row on top; three side-by-side line charts with navy headers and callout bubbles below.
Eight consecutive quarters of YoY improvement in contribution margin, EBITDA margin and EBITDA: Q2 FY27 contribution margin 42.9% vs 41.9%, EBITDA margin 19.5% vs 18.3%, EBITDA ₹2,312 crore vs ₹2,205 crore; back to Q3 FY25 when EBITDA was ₹2,163 crore vs ₹416 crore. Q4 FY26 EBITDA margin of 21.9% excludes one-off group provisions.
Green-header data table with CY, LY and Change columns for three metrics, green up-triangles in shaded change columns, dark leaf background.
Advanta agreed to acquire 99.98% of Misr Hytech Seed International (Egypt) for ~US$110 million; S&P revised UPL Corp outlook to Positive and affirmed BB (14 Aug 2026), CRISIL revised UPL Ltd outlook to Stable and reaffirmed AA+/A1+ (2 Sep 2026); prepayment of a US$500 million term loan maturing December 2026 with US$400 million refinanced to FY32.
Three numbered navy pill labels on the left (Acquisition, Credit outlook, Refinancing) with chevrons pointing to text on the right, separated by dashed lines.
Section divider for the performance summary.
Orange title on dot grid with circular-cropped photo of hands holding seeds.
Q2 FY27: revenue ₹11,860 crore (-1%; volume -10%, price flat, FX +9%), contribution ₹5,087 crore (+1%, 42.9% margin, +100 bps), EBITDA ₹2,312 crore (+5%, 19.5%, +120 bps), operational PATMI ₹422 crore (+3%). H1 FY27: revenue ₹22,041 crore (+4%), contribution ₹9,693 crore (+7%, 44.0%), EBITDA ₹3,812 crore (+9%, 17.3%), op. PATMI ₹441 crore (+33%). Sep'26: NWC 145 days vs 118 and US$2.2 billion (up US$445 million), net debt US$2,993 million (up US$312 million YoY), net debt/EBITDA 2.9x vs 2.7x (TTM).
KPI dashboard grid: period labels on the left, navy header pills for each metric, large blue headline figures with grey sub-values.
Section divider for the profit and loss analysis.
Orange title on dot grid with circular-cropped laboratory test-tube photo.
Q2 FY27 vs Q2 FY26 (₹ crore): revenue 11,860 vs 12,019 (-1%), contribution 5,087 vs 5,041, SG&A 2,775 vs 2,836 (-2%), EBITDA 2,312 vs 2,205 (+5%), D&A 818, net finance costs 612 vs 518 (+18%), PBT 615 vs 784 (-22%), PAT 452 vs 612 (-26%), PATMI 421 vs 553 (-24%), operational PATMI 422 vs 411 (+3%). H1 FY27: revenue 22,041 (+4%), EBITDA 3,812 (+9%, 17.3% margin), PBT 506, PATMI 431 (-7%), operational PATMI 441 vs 332 (+33%).
Full-width financial table with orange-shaded Q2 FY27 column and blue-shaded H1 FY27 column; green dashed boxes highlight revenue, EBITDA and operational PATMI changes.
Q2 revenue (₹ crore, FY26 to FY27): UPL Ltd 12,019 to 11,860 (-1%), UPL Corp 8,625 to 7,972 (-8%), UPL SAS 911 to 921 (+1%), Advanta 1,669 to 1,875 (+12%), SUPERFORM AI 2,100 to 2,532 (+21%), SUPERFORM SSC 699 to 1,047 (+50%). H1: group +4%, Corp -2%, SAS +1%, Advanta +18%, AI +15%, SSC +39%. Commentary cites drought in Europe and weak LATAM demand for Corp, dry spells for SAS, sunflower/sorghum/corn growth for Advanta and price pass-through and CMO lubricants for SUPERFORM.
Two paired-bar charts (Q2 and H1) on the left grouped by platform with YoY labels; right panel lists drivers per platform with coloured platform names.
Q2 waterfall from ₹12,019 crore to ₹11,860 crore: LATAM -480, North America +172, Europe -162, India -151, RoW +462. Q2 FY27 regional revenue: LATAM 5,214 (-8%), NAM 1,079 (+19%), Europe 1,209 (-12%), India 1,509 (-9%), RoW 2,849 (+19%). H1 bridge from 21,235 to 22,041 with India +5% and RoW +14%. Drivers: Brazil rains hit fungicides, NAM new brand launches, Europe heatwave, India dry spells offset by hyperscale brands and specialty chemicals.
Two waterfall charts stacked vertically with regional revenue rows beneath; region commentary panel on the right.
Q2 EBITDA (₹ crore): UPL Ltd 2,312 (+5%, 19% margin), UPL Corp 1,083 (-14%, 14%), UPL SAS 214 (+3%, 23%), Advanta 510 (+19%, 27%), SUPERFORM AI 254 (-5%, 10%), SSC 197 (+73%, 19%). H1: group 3,812 (+9%), Corp 1,615 (-2%), SAS 553 (+20%), Advanta 868 (+21%), AI 481 (-2%), SSC 328 (+47%). Drivers: Corp mix and cost rationalisation, SAS pricing and brand mix, Advanta corn and sunflower, AI lower volumes, SSC price increases.
Same paired-bar layout as revenue slide with an EBITDA% row under each chart and platform commentary on the right.
Q2 FY27 operational PATMI rose ₹11 crore to ₹422 crore: from 411, EBITDA +107, D&A -47, net finance cost -94, FX/hedging -12, other income +100, tax +10, associates/JVs -78, NCI +27. H1 bridge from 332 to 441 with EBITDA +305 and associates -180. Drivers: finance and FX costs higher on FX translation, associate losses in Brazilian AI/JVs, lower minority profit share.
Two side-by-side waterfall bridges (Q2 and H1) with abbreviation legend; four-column driver strip with lightbulb icon below.
Section divider for balance sheet analysis.
Orange title on dot grid with circular-cropped seed photo.
Uses of capital (₹ crore, Sep'25 / Mar'26 / Sep'26): fixed capital 43,652 / 45,891 / 46,429, working capital 15,463 / 8,119 / 20,961, cash 4,760 / 6,720 / 4,030, total 67,732 / 64,845 / 75,658. Sources: equity 34,824, NCI 6,594, short-term debt 21,789 (from 11,353), long-term debt 10,926 (from 17,209). In US$ terms vs Sep'25, working capital +445 million, cash -115 million, short-term debt +995 million and long-term debt -798 million.
Uses/sources table with blue-highlighted Sep'26 column and US$ change column with red dashed boxes and brackets; two takeaway bullets on the right.
At Sep'26, ₹75,658 crore of sources (short-term debt and leases 22,311, long-term debt and leases 11,929, equity incl. NCI 41,418) fund fixed capital incl. ROU 47,914, working capital 20,961, cash 4,030 and others 2,753; long-term assets are funded by long-term capital and ~26% of working capital is funded by long-term sources.
Two stacked bar columns (Sources vs Uses) in shades of blue with dashed connector lines and a central callout.
Sep'25 to Sep'26: inventory ₹16,193 crore to ₹20,165 crore (DIO 124 to 140), receivables ₹19,022 crore to ₹21,642 crore (DSO 146 to 150), payables ₹19,751 crore to ₹20,846 crore (DPO 151 to 145), NWC ₹15,463 crore to ₹20,961 crore (118 to 145 days). Drivers: lower crop protection volumes, H2 seasonal build-up, input costs, shipping delays, FX translation and tight liquidity. Non-recourse factoring ₹4,623 crore (US$482 million) at Sep'26 vs ₹4,911 crore (US$553 million).
Four comparison panels (inventory, receivables, payables, NWC) each with value row and two-bar days chart; driver strip below.
Line chart (Sep'23 to Mar'27E) shows net debt tracking total working capital, rising with H1 inventory build-up and falling as inventory is liquidated; the gap is structural debt, US$760 million at Mar'26 and US$806 million at Sep'26. Net debt rose from US$1,616 million to US$2,993 million (+1,377), of which seasonal working capital was 2,187 vs 856; structural debt/EBITDA flat at 0.7x.
Left: dual-line chart with shaded fiscal-year bands, green structural-debt labels and FY27E representative range; right: stacked mini bars and a US$ million table.
Gross debt ₹32,715 crore (US$3,414 million), cash ₹4,030 crore, net debt ₹28,684 crore (US$2,993 million) at Sep'26 vs ₹23,802 crore a year earlier; currency-adjusted net debt ₹26,576 crore. Net debt/EBITDA 2.9x (2.7x Sep'25, 1.6x Mar'26), net debt/equity 0.7x. Repayment schedule (US$ million): FY27 500 proposed for refinancing to FY32 (400 sustainability-linked loan), FY28 500 term loan + 276 bonds, FY29 400, FY31 449 bonds. USD/INR moved from 88.79 to 95.84.
Two tables (₹ crore and US$ million) side by side with red dashed highlight on leverage row; debt maturity bar chart lower right.
Q2 FY27 (₹ crore): EBITDA plus non-cash items 1,919, working capital change -5,275, net operating cash flow -3,064, tax paid -219, capex -319, investments -84, FCFF -3,686, FCFE -4,224; FCFE adjusted for seasonal working capital 1,051 vs 1,688. H1 FY27: working capital -13,108, FCFE -12,600, adjusted FCFE 508 vs 1,733, lower on planned investments and a one-time tax benefit in Q2 FY26.
Cash flow table with Q2 and H1 columns, shaded H1 FY27 column, red dashed boxes on key changes and a yellow-highlighted adjusted FCFE row.
Section divider for the manufacturing platform, SUPERFORM, with tab navigation to Manufacturing, Crop Protection (UPL Corp, UPL SAS) and Seeds & Post-Harvest (Advanta, Decco).
Centred bold title with letter-spaced kicker and purple underline; three tab cards at the bottom with the active tab filled purple; purple left edge bar.
Moats: complex chemistry expertise (50+ years, backward integration, diverse applications), integrated cost leadership (built from rock phosphate, natural gas, ammonia and sulphur; captive demand) and long-term customer partnerships (CMO partner of choice for 20+ years). Outcome: supply continuity, cost control, demand visibility, margin resilience and faster scale-up. Key chemistries are phosphorus, cyanide, phosgene and sulphur, serving 12 end markets from agrochemicals and pharma to battery chemicals and oil & gas.
Three numbered moat rows with bullets, equals sign leading to a purple Resilient Player checklist; bottom grid of chemistry photo circles and end-market icon tiles.
Tailwinds include India's talent and cost base, China+1, government import substitution, regulatory shift to phosphorus-based flame retardants and battery-chemical demand. Priorities: deepen integration (only Indian end-to-end phosphorus producer), triple cyanation capacity, scale new applications (flame retardants, battery chemicals, nutraceuticals, pharma intermediates), and new contract-manufacturing partnerships; plus a large bio-ethanol plant and the Tru Nature home-care brand.
Four-column framework: tailwinds list, numbered strategic priorities with initiatives, and a purple expected-outcomes panel; alternate avenues strip and purple tagline bar at the bottom.
Six projects: lubricant additives at Jhagadia (commissioned Q1 FY27, peak revenue ₹300+ crore), captive solar at Patan (part-commissioned, Q3 FY27, ₹60+ crore cost savings), phosgene value chain at Dahej (commissioning, Q3 FY27, ₹500+ crore), phosphorus value chain in Odisha (under construction, Q3 FY28, ₹700+ crore), cyanide value chain at Dahej to 3x capacity (Q3 FY28, ₹600+ crore) and bio-ethanol at Jhagadia (95% engineering complete, Q4 FY27, ₹1,200+ crore).
Six vertical project cards, each with purple header, site photo with location tag, description, status pill, target date and peak revenue bars.
Q2 FY27 (₹ crore): revenue 3,579 vs 2,799 (+28%), contribution 792 (+13%, margin 22.1%, -290 bps on cost-plus contracts), EBITDA 451 (+19%, 12.6%), EBIT 323 (+39%, 9.0%, +70 bps). H1 FY27: revenue 6,498 (+21%), EBITDA 809 (+13%), EBIT 545 (+30%). Revenue drivers: volume +2%, price +26%; specialty chemicals share rose from 25% to 29%.
Performance table with purple-shaded Q2 and blue-shaded H1 columns; three-column Q2 drivers strip with lightbulb icon.
H1 revenue ₹6,498 crore split into AI ₹4,602 crore (+15%) and SSC ₹1,896 crore (+39%); EBIT ₹545 crore split into AI ₹314 crore (+13%, 6.8% margin, -10 bps) and SSC ₹231 crore (+62%, 12.2% margin, +170 bps). AI H1 volume -6%, price +21%; SSC volume +18%, price +21%. EBIT is presented as the better metric for an asset-heavy manufacturer.
Two donut charts (Revenue, EBIT) with totals in the centre, YoY triangles and a margin mini-table; bullet commentary under each.
Section divider for crop protection, covering UPL Corp (international) and UPL SAS (India).
Centred title with blue-to-green gradient underline and active blue-green tab card; matching gradient left edge.
Proprietary technology plus strong backward-integrated manufacturing plus registration-led distribution, described as unique at scale. Five-step path from grower problem to defended position: grower-led ideation (field teams in ~140 countries), reimagine and combine actives, speed to market (registrations across ~130 countries), positions in chosen niches, and hard-to-replicate first launches and process patents; enabled by formulation technology, biosolutions, OpenAg partnerships and diversification.
Equation banner across the top, farmer photo left, five-step chevron process with descriptions, and an Enabled-by panel with four icons.
27 new molecules and 17 solution platforms in development: 7 in Phase 2 proof of concept, 12 in Phase 3 dossier and submission, 6 launch-ready. Risk-adjusted peak sales ~US$4.4 billion (80% differentiated, 20% post-patent) with US$1.5 billion of sales expected in FY30; innovation rate 15% FY25, 16% FY26, >20% FY30E. NPP biosolutions is a top-5 global leader at ~10% of the business, with 22 sites, 6 research platforms and 10 new technologies in a market growing from US$14 billion to US$22 billion (2024–2029E).
Three-column Pipeline/Progress/Value grid with navy-accented boxes, stacked bar and innovation-rate bar chart; green NPP band and grey takeaway banner; agronomist photo on the right.
Q2 FY27 (₹ crore, proforma): revenue 7,972 vs 8,625 (-8%; volume -16%, price -2%, FX +10%), contribution 2,705 (-11%, margin 33.9%), SG&A 1,622 (-8%), EBITDA 1,083 (-14%, 13.6% margin), EBIT 542 (-29%). H1 FY27: revenue 14,345 (-2%), contribution margin 35.8% (+90 bps), EBITDA 1,615 (-2%, 11.3% flat). Volume decline led by Brazil, LATAM and weather in Europe; higher input costs partly offset by SG&A discipline.
Blue-themed performance table with shaded current columns; three-part Q2 drivers strip.
Q2 revenue bridge from ₹8,625 crore to ₹7,972 crore: Latin America -644, NAM +110, Europe -213, RoW +226; Q2 revenue LATAM 4,240, NAM 852, Europe 1,027, RoW 1,934. H1 bridge from 14,582 to 14,345 (LATAM 6,506, NAM 2,147, Europe 2,451, RoW 3,225). Drivers: El Niño and Brazil fungicide decline, NAM growth from new products such as Sonic Boom and Elevate, European heatwave, RoW strength in South Africa and Asia Pacific.
Two waterfall charts side by side with regional revenue row beneath; four-column regional drivers strip.
India's most connected agri network: 5,000+ field staff, 25,000+ dealers, 300,000 indirect retailers and 30 lakh+ farmers on digital platforms; 60 depots, >90% of agri districts and crops covered, 340+ B2B clients and 2 go-to-market brands. Portfolio priorities are hyperscaling launches, efficient generics and digital marketing; innovation rate reached 26% in FY26 from 19% in FY24.
Left green pyramid of network tiers with icon KPIs; right numbered portfolio list and grey highlight box with large 26% figure.
Revenue 2-year CAGR +6% (FY24–FY26); contribution margin up 1,300 bps from 19.2% to 32.2%; EBITDA ₹133 crore (FY24), ₹441 crore (FY25) and ₹548 crore (FY26), a 100%+ 2-year CAGR; EBITDA margin up 1,240 bps from 4.7% to 17.1%. Drivers: new launch scale-up, focused brands and better mix.
Four KPI boxes with green top rules including a small EBITDA bar chart; key drivers column; farmer-with-phone photo on the right.
India crop protection only, excluding Nurture (₹ crore): Q2 FY27 revenue 921 vs 911 (+1%; volume -8%, price +9%), contribution margin 35.6%, EBITDA 214 (+3%, 23.2%), EBIT 203. H1 FY27 revenue 2,061 (+1%), contribution margin 38.9% (+520 bps), EBITDA 553 (+20%, 26.8%, +430 bps), EBIT 532 (+21%). Hyperscale volume growth was offset by seasonal headwinds; margins driven by price realisation and mix.
Green-themed performance table with green and blue shaded current columns; Q2 drivers strip.
Section divider for the seeds and post-harvest platform, Advanta Enterprises (Advanta seeds and Decco).
Centred title with navy underline, active navy tab card and navy left edge.
Advanta is the 10th largest global seed company by FY25 revenue, with a ~20% innovation index, seed distribution in 74 countries through 4,000+ dealers, 27 million farmers reached, 900+ hybrids, 21 breeding crops plus 19 in-licensed, 50+ years of germplasm R&D and 39 R&D facilities with 343 researchers. Decco is the 2nd largest global post-harvest solutions provider: 90-year legacy, 40+ countries, 1,700+ customers and 7 production sites. Data sourced from Advanta's January 2026 DRHP.
Left: two rows of four KPI cards (top numeric, bottom with photos); right: Decco column with fruit photo and stacked KPI cards.
Focus segments and brands: field corn (EthoMax, Vertix), sorghum (Empyr, Aphix, Igrowth, Vertix; first IMI herbicide-tolerant sorghum), sunflower and canola (Alta, Hyola; ultra-high oleic), vegetables and fresh corn (Advanta Golden Seeds). Positions include #1 field corn in Latin America, #1 sorghum in Argentina (75–77%) and Australia (66–70%), #1 okra globally and in India (25–30%) and #1 sweet/baby corn in Thailand (70–80%). IP spans patents in up to 35 countries; 32 seed processing facilities, 7 post-harvest facilities and 20,000 contract growers.
Matrix with vertical row labels (focus segments, brands, market positions) across four crop photo columns; right column for IP icons and production stats.
Advanta revenue grew from ₹4,292 crore (FY23) to ₹6,837 crore (FY26), a 17% CAGR; EBITDA from ₹984 crore (22.9%) to ₹1,725 crore (25.2%), a 21% CAGR. Growth strategies: monetise a pipeline of 8,000+ hybrids, expand core market leadership, unlock new geographies and crops, scale post-harvest solutions and pursue tuck-in M&A.
Two bar charts (revenue and EBITDA with margin bubbles and CAGR arrows) on the left; five strategy rows with icons on the right.
Q2 FY27 (₹ crore, restated for Decco): revenue 1,875 vs 1,669 (+12%; volume -1%, price +3%, FX +10%), contribution margin 58.8% (+110 bps), EBITDA 510 (+19%, 27.2%, +150 bps), EBIT 429 (+18%). H1 FY27: revenue 3,629 (+18%), EBITDA 868 (+21%, 23.9%), EBIT 714 (+20%). Led by corn in Argentina, LATAM and Indonesia, sunflower and grain sorghum, and post-harvest growth.
Navy-themed performance table with blue-shaded current columns; Q2 drivers strip.
Q2 bridge from ₹1,669 crore to ₹1,875 crore: Americas +205, Asia/Africa -60, Australia +47, Europe +13 (Q2 revenue Americas 1,088, Asia/Africa 578, Australia 146, Europe 63). H1 bridge from 3,065 to 3,629 with Americas +283 and Asia/Africa +222. India and Thailand were hit by El Niño and monsoon delays; Australia grew on field corn and forages. The slide title itself contains the typo 'Austrailia'.
Two waterfall charts side by side with regional revenue row; four-column regional drivers strip.
Section divider for full-year guidance.
Orange title on dot grid with circular-cropped tractor photo.
FY27 guidance: revenue growth 7–11% (FY26: 4–8%) and EBITDA growth 10–14% (FY26 initial: 10–14%). Assumptions: no further adverse weather including El Niño and no major escalation in West Asia disrupting logistics and input prices. Strategic priorities remain margins, PATMI, deleveraging and returns.
Guidance comparison table with green header cells on a dark cracked-leaf texture; translucent assumptions panel on the right and grey tagline banner.
Transition slide stating that financial performance is underpinned by a clear long-term strategy and a commitment to sustainability-linked value creation.
Full-bleed landscape photo (mountains and meadow) with large italic white quote overlaid.
Strategy framed as a tree: four pillars (improve quality of earnings, simplify and sharpen focus, drive profitable growth, strengthen financials through deleveraging and capital discipline) around a resilient core; roots are governance and ethics, global scale, portfolio and innovation, integrated manufacturing and deep customer relationships.
Central tree illustration with four coloured callout boxes and icons; five-column navy roots table and italic tagline at the bottom.
Environment: 55% lower water intensity and 55% lower waste-disposal intensity vs FY2019–20, 39% lower carbon intensity, 46% renewable electricity, 1.6% groundwater dependency. Social: 5.29 lakh+ mangrove saplings, 1,28,350 safety training hours, LTIFR 0.45, 57 R&D centres, 12,000+ employees, ~3% of revenue in R&D. Governance: #1 bio-solutions and #5 agrochemical company, 64% sustainable sourcing, 36% revenue from differentiated and sustainable solutions, 16,000+ registered products. Recognitions: SBTi, DJSI World, UNGC, Responsible Care, FTSE4Good.
Three ESG columns (green, navy, orange headers) each with six icon KPI tiles; row of certification logo cards at the bottom.
Transition statement that financial and non-financial performance is governed by an experienced board and global leadership team.
Large grey italic quote on white with a tea-plantation hills illustration across the lower half.
Board of directors (as of 30 Sep 2026): Jaidev R. Shroff (Chairman and Group CEO), Vikram R. Shroff (Vice-Chairman and Co-CEO), Raj Tiwari (Whole-Time Director, also CEO of SUPERFORM), independent directors Naina Lal Kidwai, Usha Monari, M. V. Bhanumathi and S. K. Mohanty, lead independent director Suresh Kumar and non-executive director Hardeep Singh, with committee badges. Leadership team: Bikash Prasad (Group CFO), Sandeep Deshmukh (Company Secretary), Sanjay Singh (CHRO), Sameer Tandon, Ashish Dobhal, Ravi Cherukuri, Rajan Gajaria (Vice Chairman, Advanta) and Bhupen Dubey (CEO, Advanta).
Left 3x3 photo grid of directors with numbered committee badges and legend; right leadership grid grouped by UPL Ltd, Crop Protection and Seeds & Post-harvest.
Each platform has its own board under chairman Jai Shroff: UPL Corporation Ltd (13 directors, 53% independent, 36 years average independent-director experience), UPL Sustainable Agri Solutions Ltd (7, 29%, 34 years), Advanta Enterprises Ltd (12, 50%, 31 years) and SUPERFORM (7, 29%, 31 years).
Comparison table with colour-coded platform headers, grey chairman band and large light-grey figures.
Definitions of abbreviations used in the deck, including AI (active ingredient), DIO/DSO/DPO, FCFE/FCFF, NPP (Natural Plant Protection biologicals), NWC, Op PATMI (PATMI adjusted for exceptional items), P/V/F (price, volume, FX variances), SSC (super specialty chemicals sold externally) and TTM.
Two-pair column glossary table with navy header and light-blue abbreviation cells.
Closing slide with QR codes for the FY26 Annual Report, FY26 Sustainability Report, FY25 CSR Report and FY26 Sustainability Factsheet, and an investor relations contact.
Left column with logo, Thank You title, row of four labelled QR codes and contact line; right side repeats the cover's photo-bar collage and orange swoosh.
Häufige Fragen zu dieser Folie und dem zugrunde liegenden Präsentationsinhalt.
It is UPL Limited's 55-slide investor presentation for Q2 and H1 FY27 (quarter ended 30 September 2026), dated 2 November 2026. It covers the macro backdrop, corporate updates, a performance dashboard, P&L, platform- and region-wise revenue and EBITDA, balance sheet, working capital, net debt, cash flow, business updates for SUPERFORM, UPL Corp, UPL SAS and Advanta, FY27 guidance, ESG and governance.
Yes. It is UPL's own investor presentation, filed with the BSE and NSE as an exchange disclosure on 2 November 2026. The exchange cover letter has been removed, so the file starts at the presentation cover.
Q2 FY27 revenue was ₹11,860 crore (down 1% YoY), EBITDA rose 5% to ₹2,312 crore with a 19.5% margin (+120 bps), and operational PATMI rose 3% to ₹422 crore. For H1 FY27, revenue was ₹22,041 crore (+4%) and EBITDA ₹3,812 crore (+9%). Net debt was US$2,993 million, or 2.9x net debt to TTM EBITDA.
UPL follows the Indian April–March fiscal year, so FY27 runs from April 2026 to March 2027. Q2 FY27 covers July to September 2026, and H1 FY27 covers April to September 2026.
UPL guides to 7–11% revenue growth and 10–14% EBITDA growth for FY27. This assumes no further adverse weather, including El Niño, and no major escalation in West Asia disrupting logistics and input prices.
Good starting points are the performance dashboard (slide 12), the P&L table with highlighted columns (slide 14), the region-wise waterfalls (slides 16, 36 and 45), the operational PATMI bridge (slide 18), the sources-and-uses stacked bars (slide 21), the structural vs seasonal debt chart (slide 23) and the guidance table (slide 47).
Yes. The original PDF is available on this page, and every slide can be previewed as an image. For an editable version, you can recreate the layouts or use 2Slides to build a similar earnings deck from your own data.
Most figures are in ₹ crore (Indian rupees, 1 crore = 10 million). Net debt, working capital changes and debt maturities are also shown in US$ million or billion, as the company presents them. The deck notes USD/INR moved from 88.79 at 30 September 2025 to 95.84 at 30 September 2026.
Original exchange filing of this investor presentation, dated 2 November 2026.

Create Your Own Slides
Turn your ideas into professional presentations in seconds with 2slides AI.
Referenzieren Sie professionelle Designs, wählen Sie Ihren Stil und generieren Sie Folien mit perfekter Textdarstellung. Angetrieben von Nano Banana—beginnen Sie jetzt mit der Erstellung Ihrer Präsentation.
Ihr KI-Agent für Folien. Sparen Sie Zeit, glänzen Sie schneller mit intelligenter Präsentationserstellung.


© 2026 2slides. Alle Rechte vorbehalten.