
Teil von Investorenpräsentationen als Beispiel · Beispiele für Investorenpräsentationen aus der Halbleiterbranche
United Microelectronics Corporation (UMC) Q3 2026 Earnings Presentation (3Q26 Financial Review), investor conference of October 28, 2026, covering the quarter ended September 30, 2026. The English version of the slides filed on Taiwan's Market Observation Post System (MOPS) for the investor conference (法說會).
Nutzt das Titelbild dieser Präsentation als Stilvorlage für Folien aus eigenen Inhalten. Alternativ eine beliebige Seite unten wählen und ihr Layout als Vorlage nehmen.
Schnellnavigation
Tags
Folien teilen
United Microelectronics Corporation (UMC) Q3 2026 Earnings Presentation (3Q26 Financial Review), investor conference of October 28, 2026, covering the quarter ended September 30, 2026. The English version of the slides filed on Taiwan's Market Observation Post System (MOPS) for the investor conference (法說會).
Detaillierte Ansicht jeder Folien-Seite, einschließlich Layout, wichtigem Inhalt und visuellen Elementen.
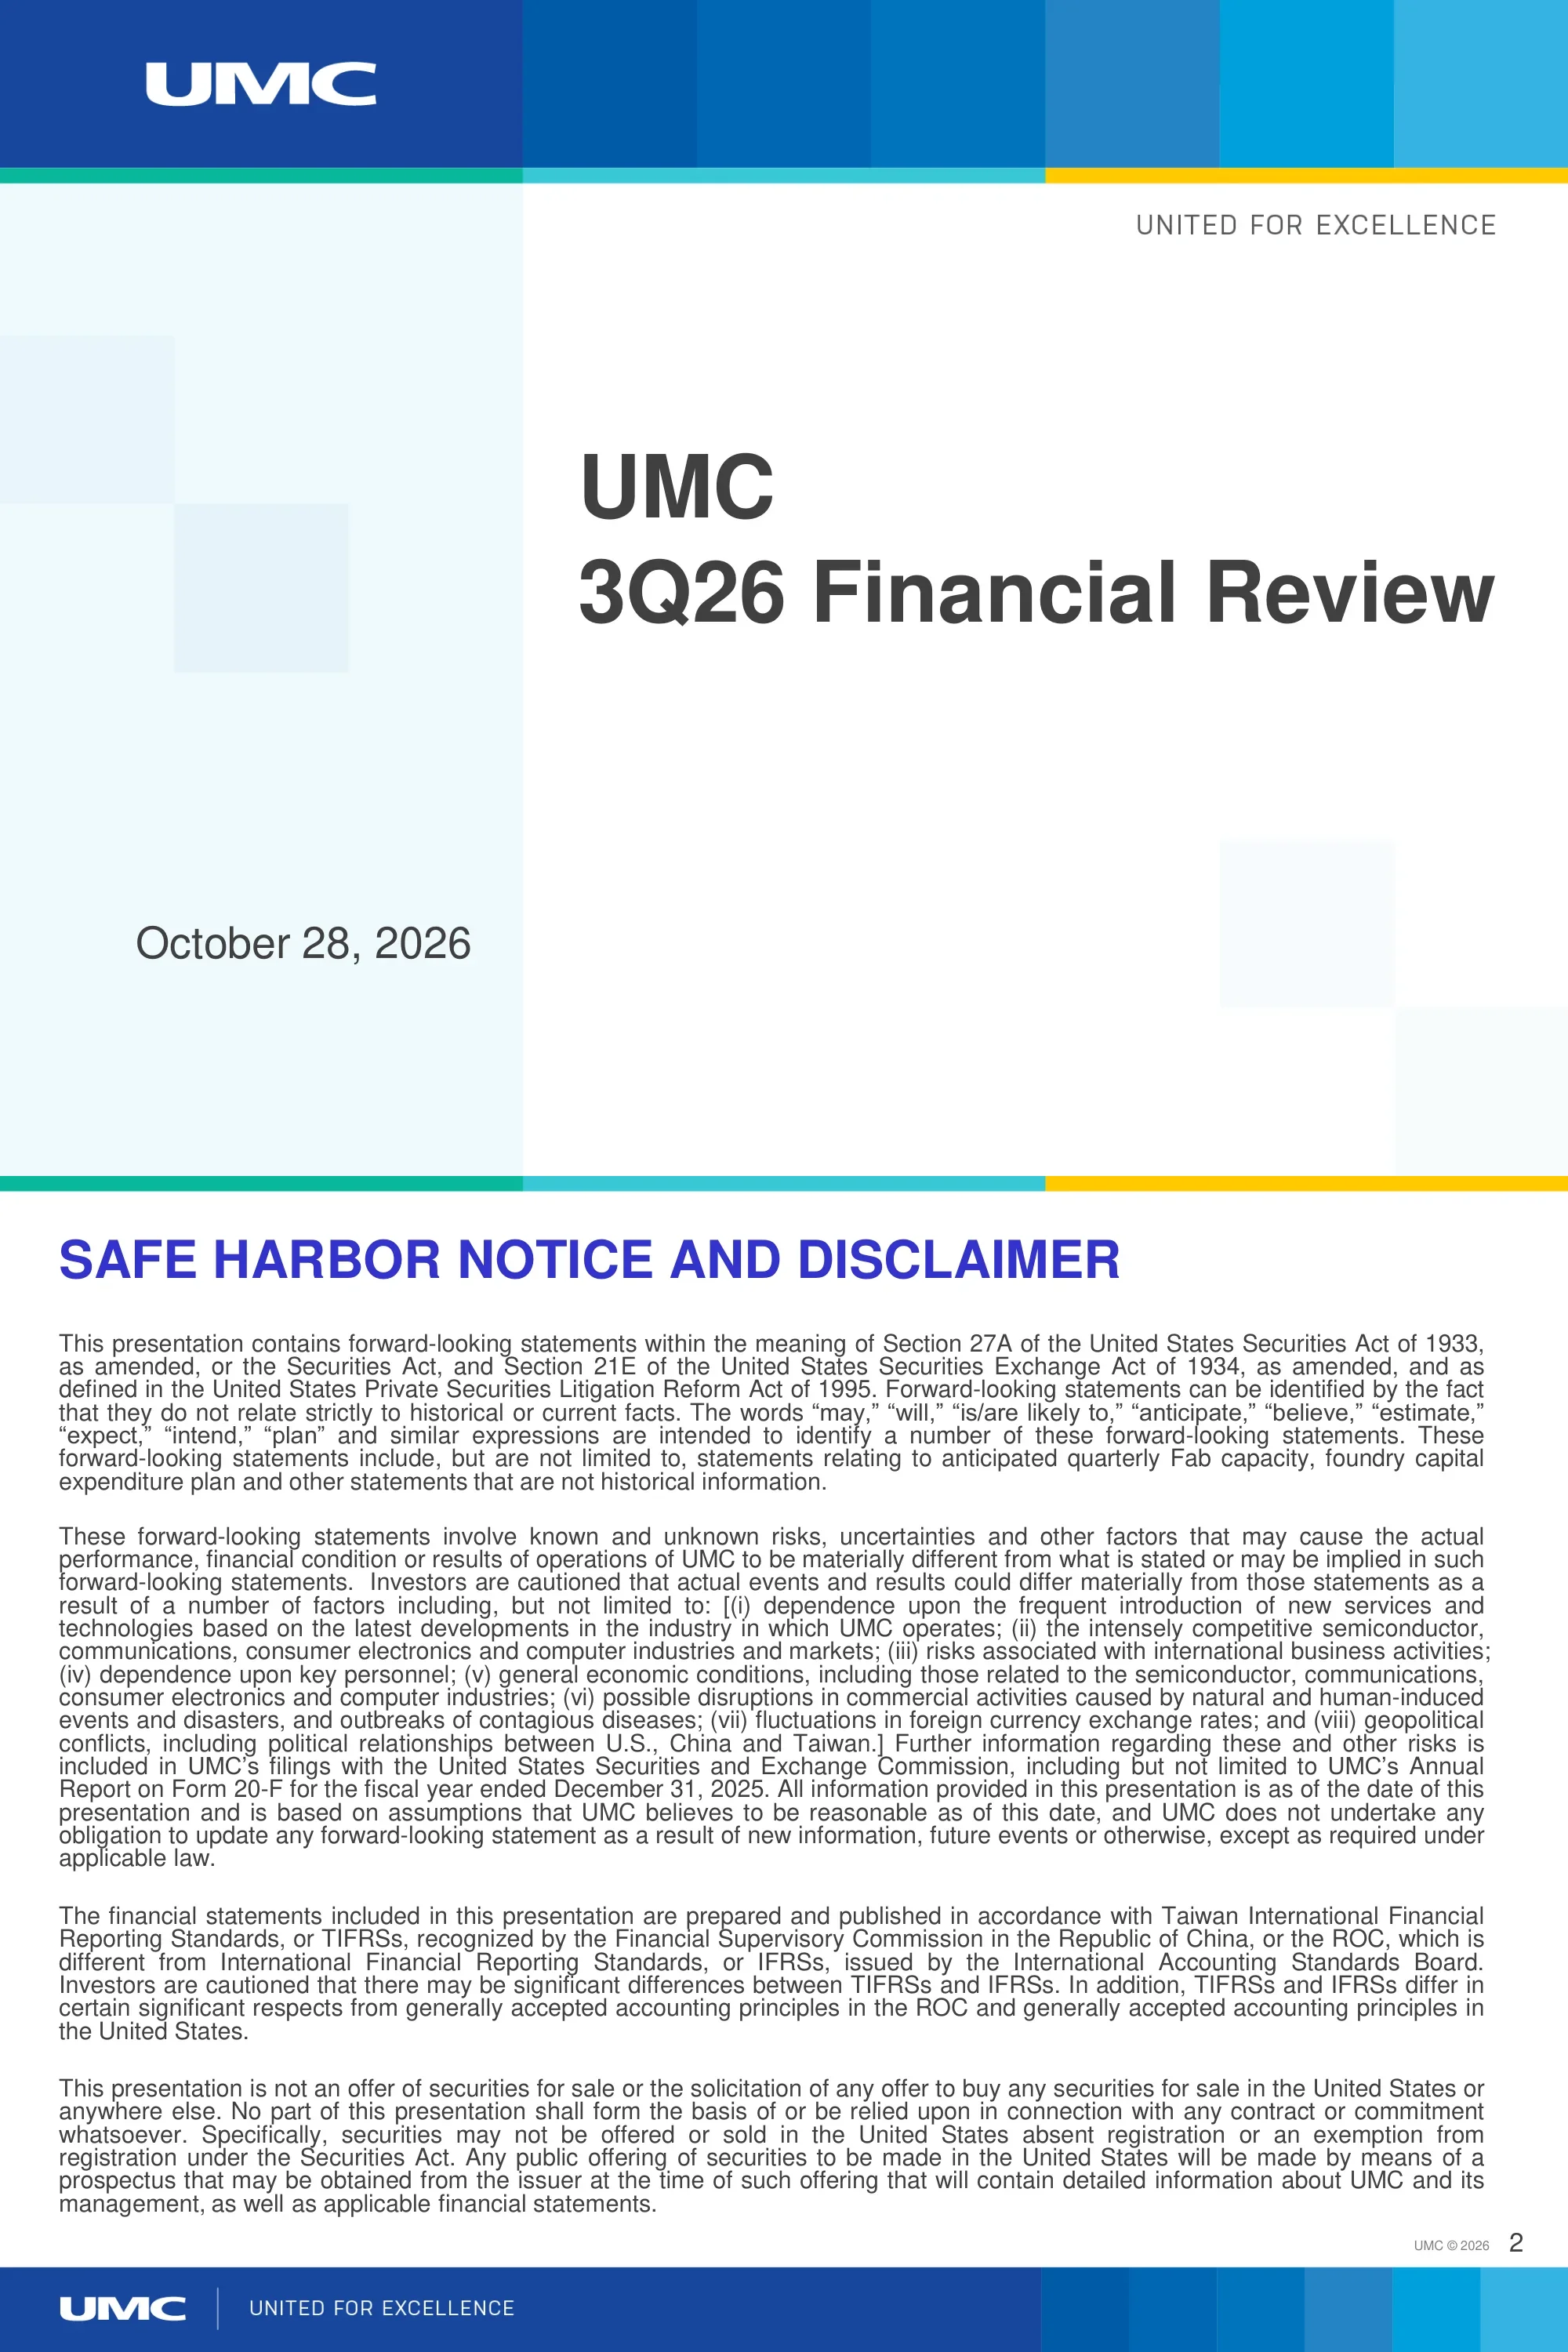
Title slide reading 'UMC 3Q26 Financial Review' dated October 28, 2026, with the tagline 'United for Excellence'.
Blue banner with the white UMC logo and a row of blue gradient squares across the top, a teal, cyan and yellow accent line below, left-aligned title and date on a light panel with faint squares.
Four paragraphs of text: forward-looking statements under Section 27A of the US Securities Act of 1933 and Section 21E of the Exchange Act of 1934, the risk factors that could cause actual results to differ, a note that the financials follow Taiwan-IFRSs (TIFRSs) which differ from IFRSs and US GAAP, and a statement that the presentation is not an offer of securities.
Blue heading in capitals above four justified text blocks, standard footer band with UMC logo and page number.
Table in NT$ million for 3Q26 (Sep.), 2Q26 (Jun.) and 3Q25 (Sep.). Operating revenues: 74,239 / 68,733 / 59,127. Net income attributable to shareholders of the parent: 16,434 / 42,260 / 14,982. EPS (NTD): 1.32 / 3.39 / 1.20. Cash and cash equivalents: 142,617 / 124,706 / 104,217. Total assets: 675,786 / 665,973 / 555,395. Total liabilities: 204,906 / 222,049 / 194,195. Total equity: 470,880 / 443,924 / 361,200. Foundry segment wafer shipments (thousand 12-inch wafer equivalents): 1,212 / 1,129 / 1,000. Utilization: 92% / 85% / 78%.
Three-column numeric table with horizontal rules separating income, balance sheet and foundry operating groups.
3Q26 versus 2Q26 in NT$ million with percent of revenue. Operating revenues 74,239 vs 68,733 (+8.0%). Gross profit 25,205 (34.0%) vs 22,323 (32.5%), +12.9%. Operating expenses (7,272) vs (7,906). Net other operating income and expenses 710 vs 533. Operating income 18,643 (25.1%) vs 14,950 (21.8%), +24.7%. Net non-operating income and expenses 1,268 vs 30,236 (-95.8%). Income tax expense (3,522) vs (2,962). Net income 16,389 vs 42,224 (-61.2%). Net income attributable to shareholders of the parent 16,434 vs 42,260. EPS NT$1.32 vs NT$3.39; EPADS US$0.206 vs US$0.537. Notes: 12,461 million and 12,475 million shares used for EPS; exchange rates USD/NTD 31.99 and 31.59; sums may not equal totals due to rounding.
Six-column income statement table (3Q26, %, 2Q26, %, change %) with row rules and a three-line notes block at the bottom.
January to September 2026 versus 2025 in NT$ million. Operating revenues 204,010 vs 175,744 (+16.1%). Gross profit 65,346 (32.0%) vs 49,948 (28.4%), +30.8%. Operating expenses (22,276) vs (19,563). Operating income 44,869 (22.0%) vs 31,723 (18.0%), +41.4%. Net non-operating income and expenses 36,872 vs 2,421. Income tax expense (7,011) vs (2,609). Net income 74,730 vs 31,535 (+137.0%). Net income attributable to shareholders of the parent 74,865 vs 31,661 (+136.5%). EPS NT$6.00 vs NT$2.54; EPADS US$0.945 vs US$0.417. Notes: 12,476 million and 12,485 million shares; USD/NTD 31.74 and 30.47.
Same six-column income statement layout as the previous slide with nine-month periods and a notes block.
Balance sheet items at September 30, 2026 in NT$ million: cash and cash equivalents 142,617; funds and investments 153,475; property, plant and equipment 253,203; total assets 675,786; current liabilities 72,968; long-term credit / bonds 61,491; total equity 470,880.
Single two-column list table with dotted row separators and large type.
Line chart of foundry average selling price per 12-inch wafer equivalent in USD from 3Q25 to 3Q26. The line stays close to US$2,000 throughout (axis marks at 0, 1,000 and 2,000), with a slight dip around 1Q26 and no data labels.
Single boxed line chart with quarters on the x-axis and USD on the y-axis.
Two pie charts. 3Q26: Asia 67%, North America 22%, Europe 8%, Japan 3%. 2Q26: Asia 66%, North America 22%, Europe 8%, Japan 4%.
Two side-by-side pie charts titled by quarter with outside labels.
Two pie charts. 3Q26: Fabless 86%, IDM 14%. 2Q26: Fabless 85%, IDM 15%.
Two side-by-side two-segment pie charts with the IDM slice separated.
Two pie charts. 3Q26: Communication 39%, Consumer 32%, Computer 13%, Others 16%. 2Q26: Communication 39%, Consumer 32%, Computer 13%, Others 16%, identical to 3Q26.
Two side-by-side four-segment pie charts with labels around the circles.
Two pie charts by process node. 3Q26: 22/28nm 35%, 40nm 16%, 65nm 19%, 90nm 6%, 0.11/0.13um 9%, 0.15/0.18um 10%, 0.25/0.35um 4%, 0.5um and above 1%, 14nm and below 0%; callout: 40nm and below 51%. 2Q26: 22/28nm 37%, 40nm 15%, 65nm 18%, 90nm 7%, 0.11/0.13um 8%, 0.15/0.18um 10%, 0.25/0.35um 4%, 0.5um and above 1%, 14nm and below 0%; callout: 40nm and below 52%.
Two side-by-side multi-segment pie charts with a yellow callout box for the 40nm-and-below share.
Capacity table in thousands of wafers for 1Q26, 2Q26, 3Q26 and 4Q26E by fab: WTK (6-inch) 78/80/80/80; 8A 212/215/215/215; 8C 123/125/125/125; 8D 116/118/118/118; 8E 129/131/131/131; 8F 144/146/146/146; 8S 115/117/117/117; 8N 246/250/250/250; 12A (12-inch) 402/409/409/409; 12i 169/172/192/204; 12X 93/95/95/95; 12M 117/119/119/119. Total (12-inch equivalent): 1,283 / 1,305 / 1,325 / 1,337.
Table with fab names and wafer sizes in the left columns, four quarter columns, the 3Q26 column highlighted in light blue and a total row.
2026 capital expenditure plan of 2.0 billion USD in total, split 10% to 8-inch and 90% to 12-inch.
Minimal three-column table with a mostly empty lower half.
Closing slide: for more information regarding UMC, www.umc.com; for all inquiries, suggestions and comments, ir@umc.com.
Centered text on a light panel with a blue gradient square band and UMC logo at the bottom.
Häufige Fragen zu dieser Folie und dem zugrunde liegenden Präsentationsinhalt.
It is UMC's 3Q26 Financial Review, presented at the investor conference on October 28, 2026. It has 14 slides: safe harbor notice, operating results summary, quarter-over-quarter and nine-month income statements, balance sheet highlights, foundry ASP trend, sales breakdowns by geography, customer type, application and technology, quarterly capacity and the 2026 capital expenditure plan.
As the deck states them, operating revenues were NT$74,239 million (NT$ = New Taiwan dollars), up 8.0% from 2Q26. Gross profit was NT$25,205 million (34.0% of revenue), operating income was NT$18,643 million, and EPS was NT$1.32. Wafer shipments were 1,212 thousand 12-inch equivalents with 92% utilization.
Calendar quarters. 3Q26 is the quarter ended September 30, 2026, 2Q26 ended June 30, 2026 and 3Q25 ended September 30, 2025. The nine-month slide compares January to September 2026 with January to September 2025. Amounts are in NT$ million unless noted.
It is the English version of the slides UMC filed on Taiwan's Market Observation Post System (MOPS, 公開資訊觀測站) for its investor conference (法說會), which every TWSE-listed company must hold and file. A Chinese version is filed as well.
By geography: Asia 67%, North America 22%, Europe 8%, Japan 3%. By customer type: Fabless 86%, IDM 14%. By application: Communication 39%, Consumer 32%, Computer 13%, Others 16%. By technology, 22/28nm was 35% and 40nm and below was 51% of foundry sales.
The deck shows a 2026 capex plan of 2.0 billion USD, with 10% for 8-inch and 90% for 12-inch capacity. Total quarterly capacity is shown rising from 1,325 thousand wafers in 3Q26 to 1,337 thousand (12-inch equivalent) in 4Q26E.
The deck is available as page images and a PDF, and an editable PPTX is attached to this gallery entry.
Yes. The table-heavy earnings layout and paired pie charts are a useful reference for your own quarterly results presentation. The UMC logo, trademarks and all figures belong to UMC and should not be reused as your own.

Create Your Own Slides
Turn your ideas into professional presentations in seconds with 2slides AI.
Referenzieren Sie professionelle Designs, wählen Sie Ihren Stil und generieren Sie Folien mit perfekter Textdarstellung. Angetrieben von Nano Banana—beginnen Sie jetzt mit der Erstellung Ihrer Präsentation.
Ihr KI-Agent für Folien. Sparen Sie Zeit, glänzen Sie schneller mit intelligenter Präsentationserstellung.


© 2026 2slides. Alle Rechte vorbehalten.