
Teil von Investorenpräsentationen als Beispiel · Beispiele für japanische Investorenpräsentationen
Tosoh Corporation's H1 FY2026 earnings presentation (Q2 of the fiscal year ending March 2027, covering April-September 2026), dated November 5, 2026. This is a Japanese-language deck (決算説明会資料) published on TDnet, the Tokyo Stock Exchange's timely disclosure system. It reports H1 net sales of ¥579.7 billion (5,797 億円, +805) and operating income of ¥49.4 billion (494 億円, +46), walks through the first results under Tosoh's new Chain / Advanced segment structure, and raises the full-year FY2026 forecast to net sales of 12,000 億円 and operating income of 1,090 億円. All figures are in units of ¥100 million (億円) as written by the company.
Nutzt das Titelbild dieser Präsentation als Stilvorlage für Folien aus eigenen Inhalten. Alternativ eine beliebige Seite unten wählen und ihr Layout als Vorlage nehmen.
Schnellnavigation
Tags
Folien teilen
Tosoh Corporation's H1 FY2026 earnings presentation (Q2 of the fiscal year ending March 2027, covering April-September 2026), dated November 5, 2026. This is a Japanese-language deck (決算説明会資料) published on TDnet, the Tokyo Stock Exchange's timely disclosure system. It reports H1 net sales of ¥579.7 billion (5,797 億円, +805) and operating income of ¥49.4 billion (494 億円, +46), walks through the first results under Tosoh's new Chain / Advanced segment structure, and raises the full-year FY2026 forecast to net sales of 12,000 億円 and operating income of 1,090 億円. All figures are in units of ¥100 million (億円) as written by the company.
Detaillierte Ansicht jeder Folien-Seite, einschließlich Layout, wichtigem Inhalt und visuellen Elementen.
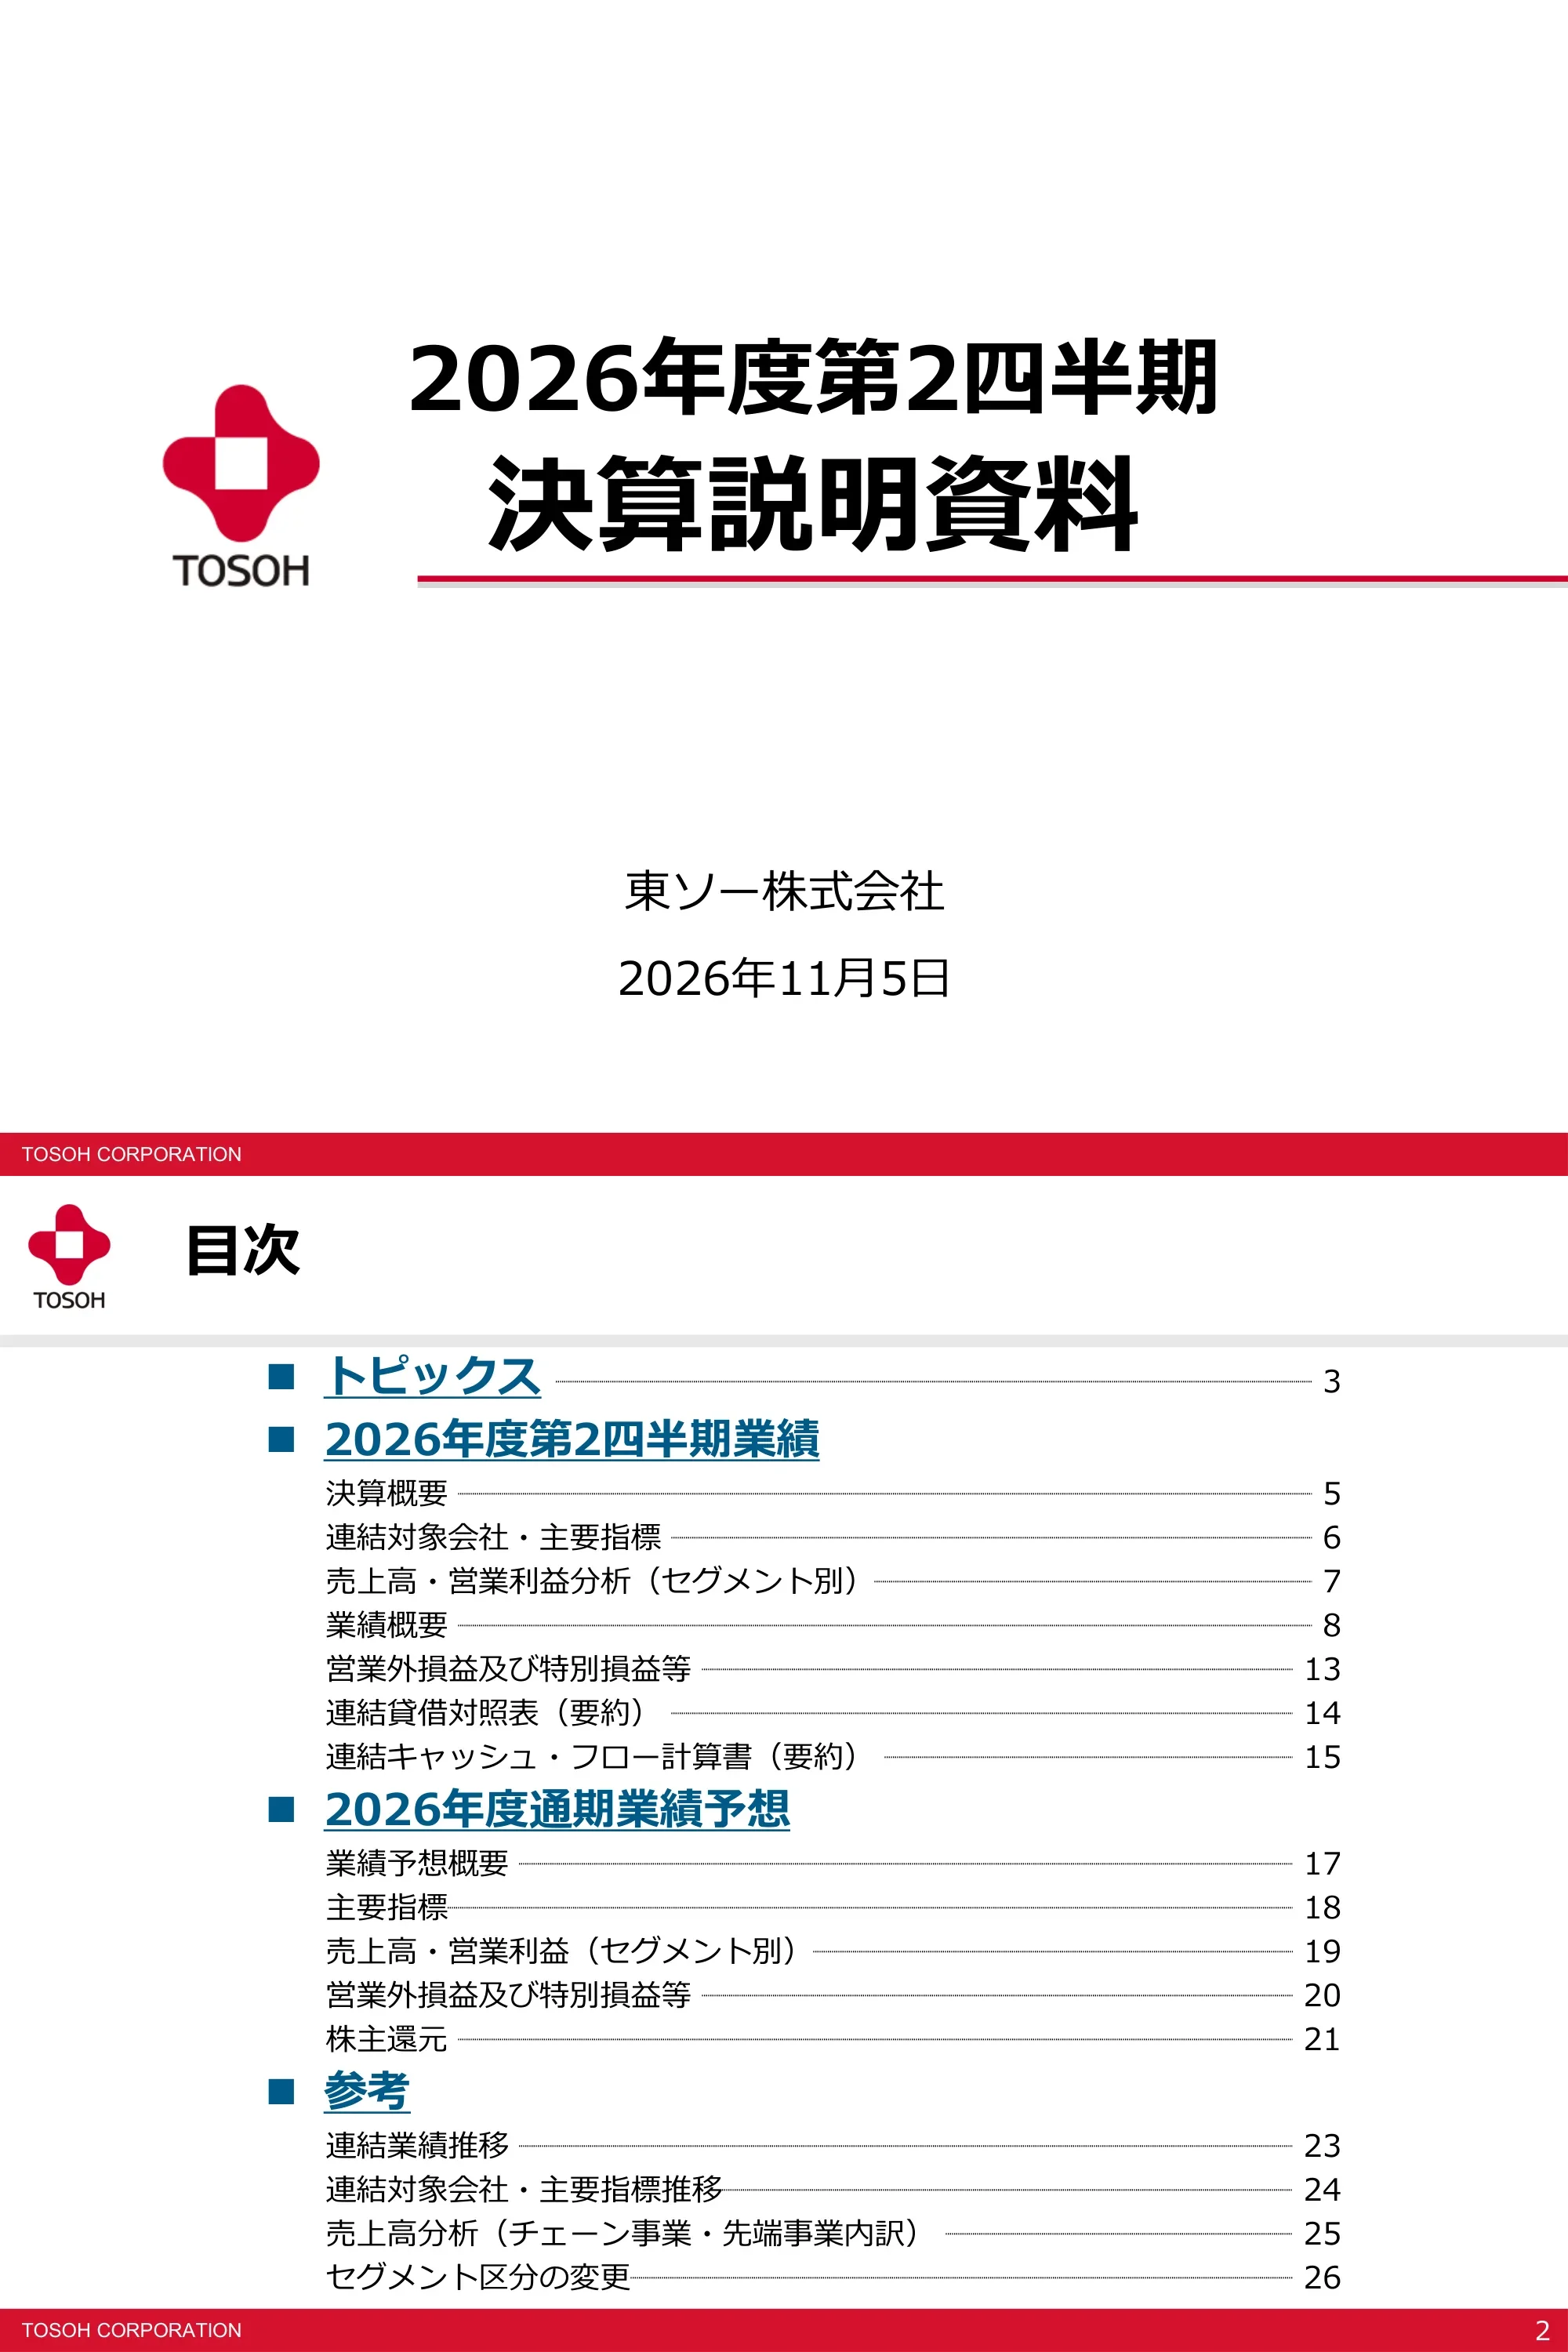
Title page of Tosoh Corporation's (東ソー株式会社) presentation of results for the second quarter of FY2026, dated November 5, 2026. FY2026 is Tosoh's fiscal year from April 2026 to March 2027, so the cumulative period covered is April-September 2026 (H1).
Centered two-line bold Japanese title with the red-and-white Tosoh cross logo on the left, a red horizontal rule under the title, and the company name and date centered below; red footer band reading TOSOH CORPORATION.
Agenda in four parts: Topics (p.3); FY2026 Q2 results - overview (p.5), consolidated companies and key indicators (p.6), sales and operating income analysis by segment (p.7), segment results (p.8), non-operating and extraordinary items (p.13), summary balance sheet (p.14), summary cash flow statement (p.15); FY2026 full-year forecast - overview (p.17), key indicators (p.18), sales and operating income by segment (p.19), non-operating and extraordinary items (p.20), shareholder returns (p.21); Reference - consolidated results trend (p.23), consolidated companies and indicators trend (p.24), sales breakdown of Chain and Advanced businesses (p.25), and segment classification change (p.26).
Single-column list with blue underlined section headings, indented sub-items and dotted leader lines to right-aligned page numbers.
Timeline of recent and planned capacity moves: May 2026 - new biomass power plant; May 2026 - capacity increase for separation and purification media (chromatography resins); September 2026 - capacity increase for HDI derivatives; Spring 2027 (planned) - new crude MDI splitter in Vietnam; Spring 2027 (planned) - further capacity increase for separation and purification media; Spring 2030 (planned) - capacity increase for chloroprene rubber.
Two-column bulleted list on a white background: date on the left, event description on the right, six rows.
Section break introducing the first-half FY2026 actual results.
Single large bold Japanese heading centered on a blank slide with the logo top-left and red footer.
H1 FY2026 versus H1 FY2025, in 億円: net sales 5,797 vs 4,991 (+805), driven by higher naphtha and overseas product prices amid tension in the Middle East, a weaker yen, and higher shipments of advanced materials; operating income 494 vs 447 (+46), helped by improved inventory valuation and advanced-materials shipments but hurt by worse terms of trade (raw material and fuel costs rose faster than selling prices); ordinary income 492 vs 457 (+34); profit attributable to owners of parent 268 vs 74 (+194), mainly because impairment losses on fixed assets fell sharply. Assumptions: JPY/USD 159.5 (146.0), JPY/EUR 184.4 (168.1), domestic naphtha 107,450 円/KL (64,750), benzene US$1,023/t (727), PVC US$795/t (663), VCM US$673/t (528), liquid caustic soda US$416/t (447, down 31), monomeric MDI US$2,203/t (1,748), polymeric MDI US$2,135/t (1,783).
Upper table of four P&L lines with prior-year, current-year (highlighted teal) and change columns plus a grey commentary column; lower table of FX rates and market prices with units.
Scope unchanged year on year: 89 consolidated subsidiaries, 15 equity-method affiliates, 104 companies in total. Key indicators H1 FY2026 vs H1 FY2025 (億円): capital expenditure 438 (382, +56); depreciation 251 (229, +22); R&D 117 (112, +5); interest-bearing debt including lease obligations 2,685 (1,786, +900); net financial income △9 (0); equity ratio 57.0% (62.3%, down 5.3 points); employees 15,142 (14,944, +198).
Two stacked tables with red-bar sub-headings: a company count table with an empty breakdown column, and a key indicators table with prior, current and change columns; footnote on lease obligations.
Sales bridge (億円, H1 FY2025 to H1 FY2026, with volume, price and of-which-FX effects): Chain business 3,008 to 3,514 (+506; volume △31, price +536, FX +128) - Basic Materials 2,238 to 2,619 (+381) and Value-Added Materials 770 to 895 (+125); Advanced business 1,725 to 1,994 (+269; volume +196, price +73, FX +97) - Bioscience 322 to 340, Advanced Materials 578 to 712, Water Treatment Engineering 824 to 942; Other 259 to 289; total 4,991 to 5,797 (+805; volume +178, price +627, FX +225). Operating income bridge (volume, terms of trade, fixed costs and other): Chain 103 to 120 (Basic Materials △11 to △24; Value-Added Materials 113 to 144); Advanced 318 to 338 (Bioscience 104 to 113; Advanced Materials 38 to 73; Water Treatment 176 to 153); Other 27 to 36; total 447 to 494 (+46; volume +28, terms of trade △65, fixed costs and other +83). Footnote: FY2025 figures were restated for the new segment structure and differ partly from reference figures published on November 4, 2025 and May 13, 2026.
Two dense variance tables stacked vertically, each with a merged header (sales or operating income / change factors), segment rows with indented sub-segments, and a bold total row.
Basic Materials sales 2,619 億円 (2,238, +381; volume △78, price +459). Operating loss △24 億円 versus △11 (change △14; volume △8, terms of trade △93, fixed costs and other +87). Commentary: ethylene, propylene and cumene shipments fell due to scheduled maintenance at the Yokkaichi ethylene plant and output cuts to match naphtha and propylene demand; ethylene and propylene prices rose with naphtha; polyethylene shipments rose on pre-buying linked to the Middle East situation and firm HDPE sales for semiconductor uses; caustic soda output fell on raw-material procurement concerns, with purchased product used to meet export contracts and export prices lower; VCM shipments fell; PVC export shipments fell; overseas PVC product prices rose; cement shipments were flat with higher domestic prices; MDI shipments rose because of a smaller scheduled overhaul at the Nanyo complex, and prices rose. Operating income fell as worse terms of trade and lower shipments of in-house caustic soda and propylene outweighed improved inventory valuation.
Left: summary table plus two waterfall charts (sales bridge and operating income bridge). Right: grey text panels with bulleted sales commentary and an operating income explanation.
Value-Added Materials sales 895 億円 (770, +125; volume +47, price +77). Operating income 144 億円 (113, +30; volume +8, terms of trade △7, fixed costs and other +29). Chloroprene rubber shipments to Asia rose and prices increased on higher raw material costs and FX; HDI-based curing agents grew on promotion ahead of a new line and on higher overseas prices; ethyleneamines saw stronger inquiries amid Middle East tension, with higher shipments to China and the US and FX-driven price gains. Profit rose on ethyleneamine volumes and better inventory valuation.
Same template as page 8: summary table and two waterfall charts on the left, commentary panels on the right.
Bioscience sales 340 億円 (322, +18; volume △9, price +26). Operating income 113 億円 (104, +9; volume △9, terms of trade +28, fixed costs and other △10). Instrument-related products saw lower shipments of liquid chromatography packing materials in Europe; diagnostics shipments of in-vitro diagnostic reagents rose in Japan and the US but fell in China, and reagents for automated HbA1c (glycated hemoglobin) analyzers grew in Europe and Japan. Profit improved on FX and product mix despite lower chromatography media shipments.
Standard segment template: table, sales waterfall and operating income waterfall on the left; two commentary boxes on the right.
Advanced Materials sales 712 億円 (578, +134; volume +120, price +14). Operating income 73 億円 (38, +35; volume +51, terms of trade +7, fixed costs and other △22). High-silica zeolite shipments rose for automotive exhaust and environmental uses in Japan and for automotive and petrochemical catalysts in Asia and North America; zirconia grew in decorative and European dental uses; quartz glass for semiconductors rose in Japan and East Asia on strong AI demand, offsetting lower North American shipments; sputtering targets grew overseas for semiconductors; electrolytic manganese dioxide for dry-cell batteries rose in Japan and Asia but fell overall on weaker Europe. Profit nearly doubled on quartz glass and zirconia volumes despite higher fixed costs.
Standard segment template with table, two waterfall charts and right-hand commentary panels.
Water Treatment Engineering sales 942 億円 (824, +118; volume +85, price +33). Operating income 153 億円 (176, △23, all volume). Sales stayed high in Taiwan on continued large semiconductor-related orders, large projects progressed in the US and China, and equipment-ownership services and maintenance solutions did well; profit fell because a high-margin plant project booked a year earlier did not recur, plus higher personnel and IT costs. Other: sales 289 億円 (259, +31; volume +12, price +18), operating income 36 億円 (27, +9), with transport and warehousing, construction and repair, inspection and analysis, and information processing all growing.
Two summary tables stacked on the left (Water Treatment Engineering above, Other below), each paired with a grey commentary box on the right; no charts.
Bridge from operating income to net income, H1 FY2026 vs H1 FY2025 (億円): operating income 494 (447); net financial income △9 (0); foreign exchange loss △22 (△6); equity-method income 15 (12); other 13 (3); non-operating total △2 (10); ordinary income 492 (457). Extraordinary items: gain on sale of investment securities 13 (24); loss on disposal of fixed assets △21 (△9); impairment loss 0 (△193); other 0 (1); extraordinary total △8 (△176, improvement of 169). Income taxes △155 (△143); profit attributable to non-controlling interests △61 (△64); profit attributable to owners of parent 268 (74, +194).
Single full-width table with bold subtotal rows and indented detail rows; prior, current (teal) and change columns.
March 31, 2026 vs September 30, 2026 (億円): total assets 14,090 to 14,978 (+889); cash and deposits 1,796 to 1,589 (△207); notes and accounts receivable and other 2,906 to 3,367 (+462); inventories 2,435 to 2,655 (+221); other current assets 844 to 878; tangible and intangible fixed assets 4,383 to 4,585 (+202); investment securities 806 to 902; other investments 920 to 1,002. Liabilities 4,898 to 5,524 (+626): payables 1,089 to 1,361; interest-bearing debt 2,351 to 2,685 (+334); provisions and other 1,459 to 1,478. Net assets 9,191 to 9,454 (+262): capital stock 552; capital surplus 445 to 446; retained earnings and other 7,666 to 7,884; treasury stock △344 to △342; non-controlling interests 873 to 915. Assets rose on receivables, fixed assets and inventories; liabilities on payables and short-term borrowings; net assets on interim net income.
Side-by-side asset and liability/net-asset tables with matching columns, a lease footnote, and a grey commentary box at the bottom.
H1 FY2026 vs H1 FY2025 (億円): operating cash flow 154 (570, △416) - pretax income 484 (281), depreciation 258 (238), income taxes △191 (△98), other △398 (149); investing cash flow △493 (△352); free cash flow △339 (218, △557); financing cash flow 105 (△270) - borrowings 288 (△28), dividends △154 (△159), other △29 (△83). FX translation 19 (△5); net change in cash △215 (△57); cash and equivalents from 1,766 at the start to 1,551 at period end (prior year 1,388 to 1,331). Operating cash flow fell as receivables and inventories rose and tax payments increased; investing outflow grew with capex; financing turned positive on short-term borrowings.
Left: cash flow table grouped by operating, investing and financing. Right: waterfall chart from opening cash 1,766 through operating +154, investing △493, financing +105 and other +19 to closing 1,551. Grey commentary strip at the bottom.
Section break introducing the full-year FY2026 forecast (April 2026 to March 2027).
Centered bold heading on an otherwise blank slide.
FY2026 forecast vs FY2025 actual and vs the previous forecast published August 4, 2026 (億円): net sales 12,000 (FY2025 10,199, +1,801; previous 11,700, +300); operating income 1,090 (955, +135; previous 1,050, +40); ordinary income 1,070 (1,068, +2; unchanged); profit attributable to owners of parent 590 (416, +174; unchanged). Assumptions: JPY/USD 157.2 (previous 159.9), JPY/EUR 180.7 (185.1), naphtha 103,225 円/KL (90,625), benzene US$1,000-1,100/t (800-900), PVC 800-900 (750-850), VCM 600-700 (550-650), caustic soda 350-420 (350-450), monomeric MDI 2,100-2,250 (1,900-2,050), polymeric MDI 2,050-2,200 (1,900-2,050). Reasons: sales raised as the Middle East situation is not expected to settle and naphtha and product prices stay higher than assumed; operating income raised on inventory valuation gains in Basic Materials and recovering semiconductor demand in Advanced Materials; ordinary and net income held because the revised FX assumption worsens FX gains/losses.
Main forecast table with FY2025, FY2026 forecast (teal) and change, plus a separate right-hand block for the previous forecast and change versus it; assumptions table below; grey commentary box at the bottom.
FY2026 forecast vs FY2025 (億円): capital expenditure 830 (727, +103); depreciation 520 (462, +58); R&D 250 (230, +20); interest-bearing debt including leases 2,990 (2,351, +639); net financial income △17 (△3); equity ratio 55.0% (59.0%, down 4.0 points); employees 15,300 (14,850, +450).
Single centered table with three data columns and a lease footnote.
FY2026 forecast vs FY2025 (億円), sales / operating income: Chain business 7,254 / 249 (6,051 / 258); Basic Materials 5,467 / △4 (4,501 / 1); Value-Added Materials 1,787 / 254 (1,550 / 257); Advanced business 4,145 / 783 (3,604 / 638); Bioscience 730 / 218 (682 / 193); Advanced Materials 1,415 / 163 (1,153 / 64); Water Treatment Engineering 2,000 / 403 (1,769 / 381); Other 601 / 57 (544 / 59); total 12,000 / 1,090 (10,199 / 955). H1/H2 split: sales 5,797 / 6,203 and operating income 494 / 596, with Basic Materials moving from △24 in H1 to +20 in H2 and Water Treatment from 153 to 250. Commentary: Basic and Value-Added Materials see higher sales on prices and a weak yen but lower profit on terms of trade and fixed costs; Bioscience grows on steady shipments and FX; Advanced Materials improves on quartz glass recovery with semiconductor demand and higher high-silica zeolite shipments; Water Treatment grows on semiconductor plant projects and solutions. Restatement footnote as on page 7.
Wide table with full-year sales and operating income blocks on the left and an H1/H2 split block on the right; grey commentary panel underneath with bracketed segment headings.
FY2026 forecast vs FY2025 (億円): operating income 1,090 (955); net financial income △17 (△3); FX gains/losses △38 (66, change △104); equity-method income 26 (26); other 9 (23); non-operating total △20 (112); ordinary income 1,070 (1,068). Gain on sale of investment securities 22 (39); loss on sale of investment securities 0 (△2); loss on disposal of fixed assets △28 (△17); impairment 0 (△196); other 0 (1); extraordinary total △6 (△174). Income taxes △298 (△319); non-controlling interests △176 (△158); profit attributable to owners of parent 590 (416, +174).
Single full-width bridge table with bold subtotals, matching the page 13 format.
Policy for FY2025-FY2027: a 50% total payout ratio as the baseline, paying an annual dividend of at least ¥100 per share and buying back shares to lift total payout to 50% if the dividend payout is below 50%; plus additional buybacks of 500 億円 over three years. Dividends per share: FY2024 ¥100 (¥50 interim + ¥50 year-end), FY2025 ¥100, FY2026 forecast ¥100 (unchanged from the August 4, 2026 forecast). EPS: FY2024 ¥182.13, FY2025 ¥132.40, FY2026 forecast ¥191.61 (previous ¥191.63). Dividend payout ratio: 54.9%, 75.5%, 52.2%. FY2026 buyback of up to 250 億円 (250 億円 already completed in FY2025).
Policy text box at the top, dividend/EPS/payout table in the middle with a separate reference column for the previous forecast, and a highlights box at the bottom.
Section break introducing the reference appendix.
Single centered bold heading on a blank slide.
Five-year trend (億円), FY2022 / FY2023 / FY2024 / FY2025 / FY2026 forecast: net sales 10,644 / 10,056 / 10,634 / 10,199 / 12,000; operating income 746 / 798 / 989 / 955 / 1,090; ordinary income 900 / 959 / 1,030 / 1,068 / 1,070; net income attributable to owners 503 / 573 / 580 / 416 / 590. JPY/USD 135.5 / 144.6 / 152.6 / 150.7 / 157.2; JPY/EUR 141.0 / 156.8 / 163.9 / 174.6 / 180.7; naphtha 76,625 / 69,100 / 75,650 / 65,200 / 103,225 円/KL; benzene US$994 / 914 / 953 / 737 / 1,000-1,100; PVC 965 / 777 / 745 / 637 / 800-900; VCM 835 / 643 / 595 / 493 / 600-700; caustic soda 636 / 412 / 479 / 430 / 350-420; monomeric MDI 2,260 / 2,012 / 1,930 / 1,754 / 2,100-2,250; polymeric MDI 2,074 / 1,668 / 1,893 / 1,637 / 2,050-2,200.
Wide multi-year table with P&L rows on top and market assumption rows below; FY2026 forecast column highlighted teal.
Consolidated subsidiaries FY2022-FY2025 and H1 FY2026: 95, 93, 91, 89, 89; equity-method affiliates 14, 14, 14, 15, 15; total 109, 107, 105, 104, 104. Key indicators FY2022 / FY2023 / FY2024 / FY2025 / FY2026 forecast (億円): capex 792 / 614 / 812 / 727 / 830; depreciation 406 / 427 / 457 / 462 / 520; R&D 214 / 220 / 221 / 230 / 250; interest-bearing debt 1,830 / 1,831 / 1,858 / 2,351 / 2,990; net financial income 12 / 5 / 1 / △3 / △17; equity ratio 61.9% / 61.6% / 62.3% / 59.0% / 55.0%; employees 14,266 / 14,394 / 14,813 / 14,850 / 15,300.
Two stacked multi-year tables with red-bar sub-headings and a lease footnote.
H1 sales by product group (億円, H1 FY2025 to H1 FY2026; volume / price / of which FX): Chain business 3,008 to 3,514 - olefins 520 to 620 (△87 / +186 / 9); polymers 450 to 543 (5 / 88 / 15); chemicals 959 to 1,049 (△22 / 112 / 40); urethane 655 to 846 (79 / 113 / 37); cement 56 to 59 (0 / 4 / 1); organic chemicals 369 to 397 (△6 / 34 / 26). Advanced business 1,725 to 1,994 - Bioscience 322 to 340; Advanced Materials 578 to 712; Water Treatment Engineering 824 to 942. Other 259 to 289. Total 4,991 to 5,797 (volume 178, price 627, FX 225). Restatement footnote as on page 7.
Single detailed variance table with product-group sub-rows under each business and a bold total row.
Mapping from the old to the new segment structure. Up to FY2025: Petrochemical (olefins, polymers, functional polymers), Chlor-Alkali (chemicals, urethane, functional urethane, cement), Specialty (organic chemicals, bioscience, advanced materials) and Engineering (water treatment engineering, construction and repair), grouped as commodity, specialty and engineering businesses. From FY2026: Basic Materials (olefins, polymers, chemicals, urethane, cement) and Value-Added Materials (functional polymers, functional urethane, organic chemicals) together form the Chain business; Bioscience, Advanced Materials and Water Treatment Engineering each become their own segment and together form the Advanced business.
Two side-by-side segment tables (before and after) connected by a large teal arrow, with bracket lines on each side linking sub-units to business groupings.
Cautionary statement: the plans in this material are forecasts based on information available at the time, and actual results may differ materially due to domestic and overseas economic conditions and other unpredictable factors.
Bold heading followed by a short paragraph of large text, centered on a blank slide.
Häufige Fragen zu dieser Folie und dem zugrunde liegenden Präsentationsinhalt.
The original is a Japanese-language results presentation (決算説明会資料) published by Tosoh Corporation (東ソー, TSE code 4042) on TDnet, the Tokyo Stock Exchange's timely disclosure system, on November 5, 2026. The page-by-page summary here is written in English, with yen amounts kept in the company's own units.
Tosoh's fiscal year runs from April to March, so FY2026 is April 2026 to March 2027. The deck's cover calls it the second quarter of FY2026 (2026年度第2四半期), and the figures are cumulative for April-September 2026, compared with April-September 2025.
億円 is ¥100 million. So net sales of 5,797 億円 are about ¥579.7 billion, and operating income of 494 億円 is about ¥49.4 billion. The △ symbol marks a negative number.
Net sales were 5,797 億円 (up 805), operating income 494 億円 (up 46), ordinary income 492 億円 (up 34) and profit attributable to owners of parent 268 億円 (up 194). Higher naphtha-linked selling prices and a weaker yen lifted sales. Net income jumped mainly because the prior year carried 193 億円 of impairment losses.
Yes. Compared with the August 4, 2026 forecast, net sales were raised from 11,700 to 12,000 億円 and operating income from 1,050 to 1,090 億円. Ordinary income (1,070 億円) and net income (590 億円) were left unchanged because a revised FX assumption worsens expected foreign exchange gains and losses.
From FY2026 Tosoh reports a Chain business (Basic Materials, Value-Added Materials) and an Advanced business (Bioscience, Advanced Materials, Water Treatment Engineering), plus Other. Page 26 maps the old Petrochemical, Chlor-Alkali, Specialty and Engineering segments onto the new structure, and FY2025 comparatives are restated.
Advanced Materials operating income rose from 38 to 73 億円 as quartz glass shipments for semiconductors increased in Japan and East Asia on AI demand and sputtering target shipments grew overseas. Water Treatment Engineering also benefits from large semiconductor-related plant projects, especially in Taiwan.
For FY2025-FY2027 Tosoh targets a 50% total payout ratio with a minimum annual dividend of ¥100 per share, topped up with buybacks, plus 500 億円 of additional buybacks over three years. The FY2026 dividend forecast is ¥100 per share, with a buyback of up to 250 億円 planned.
Original Japanese-language presentation filed on TDnet on November 5, 2026.

Create Your Own Slides
Turn your ideas into professional presentations in seconds with 2slides AI.
Referenzieren Sie professionelle Designs, wählen Sie Ihren Stil und generieren Sie Folien mit perfekter Textdarstellung. Angetrieben von Nano Banana—beginnen Sie jetzt mit der Erstellung Ihrer Präsentation.
Ihr KI-Agent für Folien. Sparen Sie Zeit, glänzen Sie schneller mit intelligenter Präsentationserstellung.


© 2026 2slides. Alle Rechte vorbehalten.