
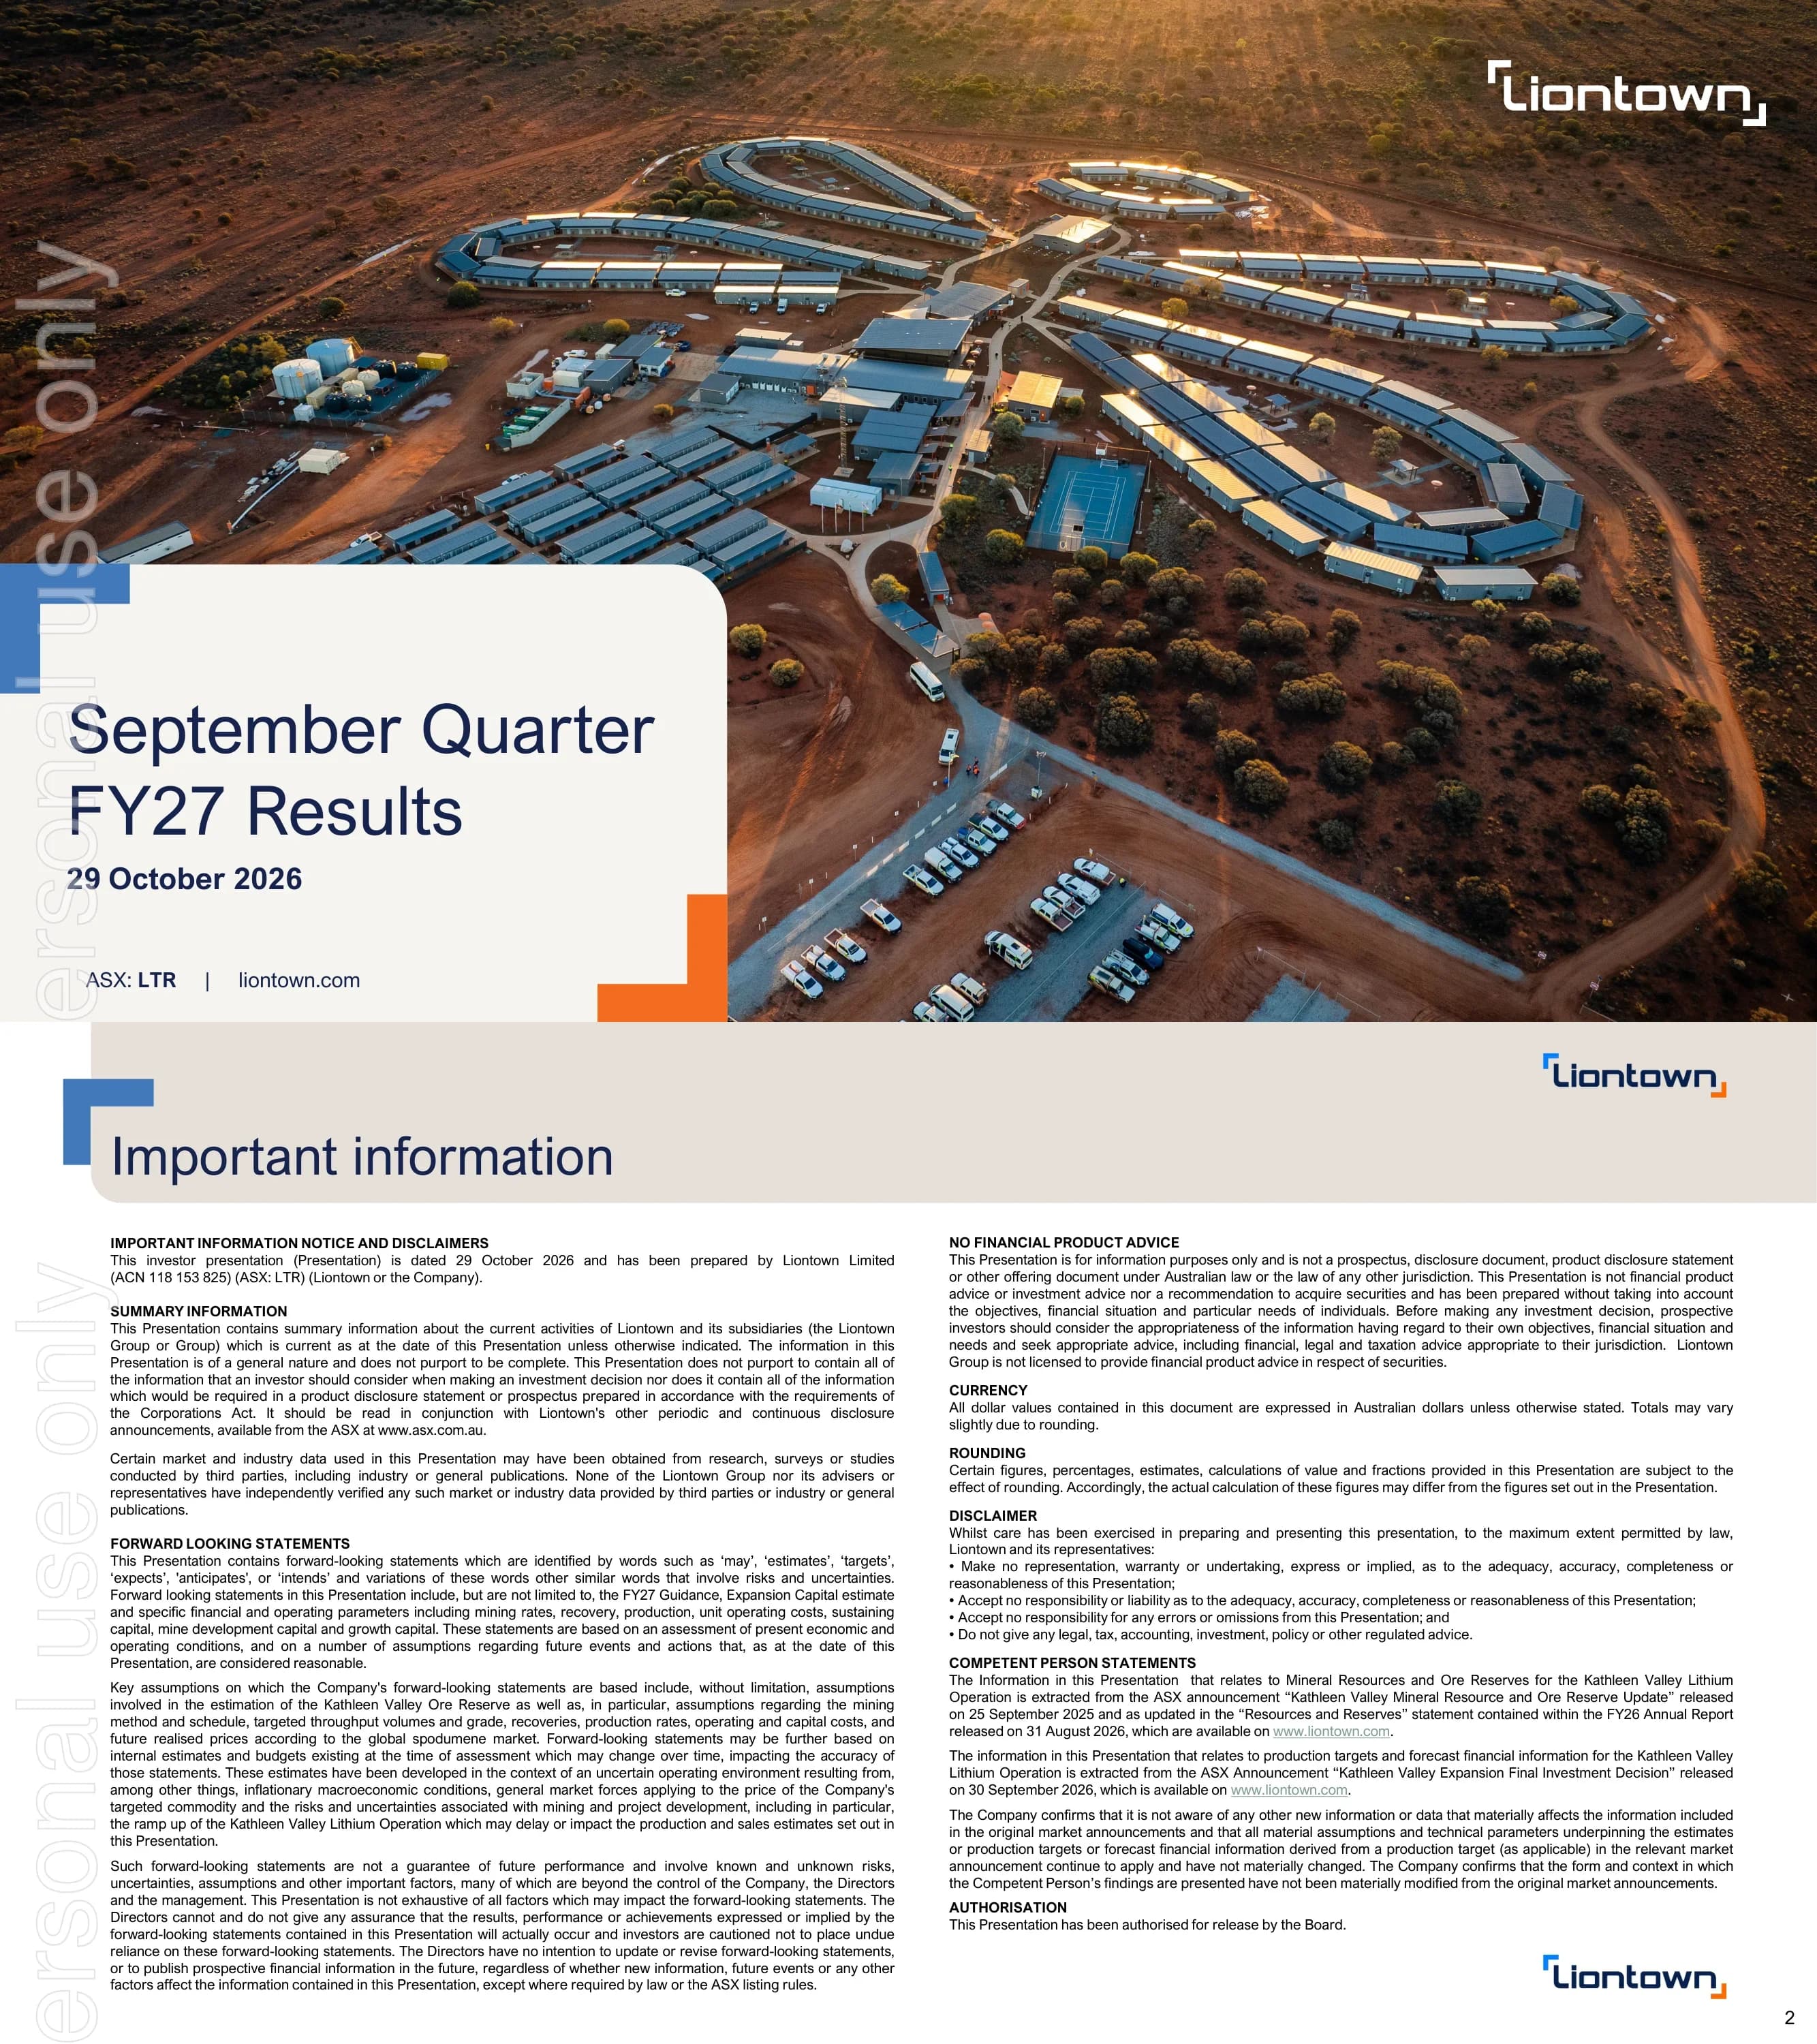
Liontown Resources (ASX: LTR) September Quarter FY27 (Q1 FY2027) results presentation, dated 29 October 2026 and lodged with the ASX: underground ramp-up at the Kathleen Valley lithium operation in Western Australia, the approved Kathleen Valley Expansion Final Investment Decision, the Centenario lithium brine farm-in in Argentina, quarterly cash flow and financial metrics, debt capacity, lithium market outlook and restated FY27 guidance. All dollar values are Australian dollars (A$) unless stated otherwise.
Nutzt das Titelbild dieser Präsentation als Stilvorlage für Folien aus eigenen Inhalten. Alternativ eine beliebige Seite unten wählen und ihr Layout als Vorlage nehmen.
Schnellnavigation
Tags
Folien teilen
Liontown Resources (ASX: LTR) September Quarter FY27 (Q1 FY2027) results presentation, dated 29 October 2026 and lodged with the ASX: underground ramp-up at the Kathleen Valley lithium operation in Western Australia, the approved Kathleen Valley Expansion Final Investment Decision, the Centenario lithium brine farm-in in Argentina, quarterly cash flow and financial metrics, debt capacity, lithium market outlook and restated FY27 guidance. All dollar values are Australian dollars (A$) unless stated otherwise.
Detaillierte Ansicht jeder Folien-Seite, einschließlich Layout, wichtigem Inhalt und visuellen Elementen.
Cover slide titled 'September Quarter FY27 Results', dated 29 October 2026, with 'ASX: LTR | liontown.com' and the Liontown logo over an aerial sunset photograph of the Kathleen Valley accommodation village.
Full-bleed aerial photograph with a rounded off-white title panel in the lower-left corner, blue and orange corner-bracket accents and the logo top right; a faint vertical 'For personal use only' ASX watermark runs down the left edge (it appears on every page).
Disclaimer page: presentation prepared by Liontown Limited (ACN 118 153 825), covering summary information, forward-looking statements (FY27 guidance, Expansion Capital estimate), no financial product advice, currency (all dollar values in Australian dollars unless otherwise stated), rounding, disclaimer, Competent Person statements referencing the 25 September 2025 Mineral Resource and Ore Reserve update, the FY26 Annual Report of 31 August 2026 and the 30 September 2026 'Kathleen Valley Expansion Final Investment Decision' announcement, and Board authorisation.
Beige header band with title, two dense justified text columns with bold uppercase sub-headings.
Three-pillar overview. Ramp-up: underground ramp-up on track at 1.6 Mtpa annualised in Q1 FY27, ~1.9 in Q2 FY27 and 2.8 by end FY27 (2.8 Mtpa mine production rate exiting June 2027), with Q2 expecting 450-500 kt of underground ore. KV Full Potential: Expansion FID approved, early works moving into execution, two ore bodies operating independently. Growth: Centenario brine farm-in and Buldania studies advancing. Banner: $502m cash on hand and underlying operating cash flow of $69m (statutory operating cash flow $47m).
Three columns with large coloured pillar headings (blue, navy, orange), each with a visual (bar chart, thumbnail of the FID deck cover, world map) and a bold takeaway; orange-highlighted cash banner across the bottom.
Six KPI tiles under 'Our planned investment in development will now deliver the production ramp up': Development 4,021 metres advanced (up 21% vs 3,316 m); Production 78.0 kdmt (ROM stockpiles 81 kt on hand); Sales 82.6 kdmt (inventory 16.2 kdmt); Unit cost A$1,259/dmt sold FOB (FY27 guidance A$1,050-1,250); Realised price US$1,966/dmt SC6e CIF (Fastmarkets average US$2,105/t); Operating cash flow A$46.6m (quarter-end cash $502m). Commentary explains development was prioritised and higher unit costs reflect lower volumes.
Dark navy full-background slide with six vertical columns, each with an orange line icon, label, large white number, unit and comparison line; narrative paragraph and footnote at the bottom.
'Safety remains our highest priority': LTIFR 0.98 (Q4 FY26: 1.00), TRIFR 14.16 (Q4 FY26: 10.99), safety observations 5.07 per 1,000 hours rolling annual (Q4 FY26: 4.74) and 71% average renewable energy penetration (Q4 FY26: 71%). A safety culture programme is underway while strengthening critical risk management.
2x2 grid of light-grey metric cards with orange icons on the left; photograph of a worker walking beneath wind turbines on the right.
Section break for the Ramp-up pillar with the statement 'Safely ramp-up Kathleen Valley to 2.8 Mtpa'.
White left area with beige caption bar overlapping a large rounded-corner photo on the right; section tracker 'Ramp-up / KV Full Potential / Growth' top left with Ramp-up highlighted.
Underground development tracking to plan with a record 4,021 metres in Q1. Quarterly development profile (m): FY25 1,869 / 1,902 / 1,849 / 1,682; FY26 1,824 / 2,142 / 2,455 / 3,316; Q1 FY27 4,021 (+21%). A 3D mine-development model shows activity timing from the Mount Mann boxcut, colour-coded Q3 FY26, Q4 FY26 and Q1 FY27.
Left: column chart with grey bars and the latest quarter in orange plus a +21% call-out; right: 3D isometric development schematic with a colour legend.
More access points, work areas and equipment lift run rate from 1.5 Mtpa at end FY26 to 2.8 Mtpa at end FY27. Work areas: unlock 7 new mine levels, lower levels with access to ~2-5 Mt of ore per level, multiple work areas per level, 95% increase in total material moved (FY26 2.0 Mt to FY27f 3.9 Mt); work areas go from 4 (end FY26) to 14 (Q1 FY27, +10) and 14 (end FY27). Equipment: jumbos 4 + 2 added toward 7, production drills 4 toward 7, loaders 6 + 2 toward 12, trucks 7 + 3 toward 15; total fleet 21 to 28 (+7) to 41 (+13).
Bookended by a beige 1.5 Mtpa bar (left) and a navy 2.8 Mtpa bar (right); two grey panels in the middle with bullets, stacked horizontal bars and step charts, green marking units added in Q1.
Underground mining producing to plan at ~1.6 Mtpa annualised and stepping up to ~1.9 Mtpa in Q2. Quarterly underground production (kt): FY25 19 / 32 / 53 / 110; FY26 225 / 308 / 402 / 356; Q1 FY27 389; Q2F 450-500. Bullets: 388,568 tonnes of underground ore mined, up 9% on the June Quarter at 1.4% Li2O; ~1.6 Mtpa run rate in line with guidance; record 4,021 m development, up 21%; development opening new mining fronts. Footnote explains the ~1.5 Mtpa planned rate through Q4 FY26 and Q1 FY27.
Column chart on the left (grey bars, orange current quarter, light-blue dashed forecast bar with range marker) and a bullet list on the right separated by a vertical divider with an arrow.
Plant performing as designed. Driver tree for the September Quarter: availability 94% x utilisation 90% x rate 76% gives ore processed of 508 kdmt at 1.3% Li2O; multiplied by recovery of 60% gives 78 kdmt of concentrate at 5.1% Li2O. Availability was the best quarter to date (up from 92%); utilisation and rate moderated during open-pit stockpile drawdown, reducing ore processed by 21%; recovery below the June Quarter's 63%; concentrate production of 77,982 dmt; guidance maintained.
Left: multiplicative driver-tree diagram with beige input boxes and navy result boxes connected by lines; right: five bold-led bullets.
Section break for the KV Full Potential pillar.
Same divider template: beige caption bar overlapping a rounded photo, section tracker with 'KV Full Potential' highlighted.
Staged $389 million investment (real 2026 dollars) adds capacity incrementally from 2.8 Mtpa to 4.2 Mtpa and lifts concentrate production by more than 50% to ~780 kdmt per annum (5-year average FY30-FY34 on an SC5.4 basis). Visuals: Kathleen Valley mine layout, ball mill installation location and debottlenecking pumps and piping. Highlights: two ore bodies operate independently; capital intensity of A$1,619/dmt, described as the lowest of recent brownfield expansion announcements; costs expected to improve to $840-920/dmt; ~2.5-year payback and ~400 full-time jobs. Dense footnotes define the basis of each figure.
Two-line headline with orange highlights, three engineering images in a row, then four grey highlight cards and a block of footnotes.
Four site photos (project facilities used for pre-start, progress in Kathleen's Corner Underground, Mine Services Area taking shape, ball mill pinion ready for shipment) and bullets: owner's team mobilised; long-lead equipment in manufacture with the ball mill on track for delivery to site in Q3 FY27; engineering and procurement underway across mining, processing and non-process infrastructure; on track for first ore from Kathleen's Corner Underground in Q1 FY28 and completion of the Expansion by the end of Q2 FY29.
2x2 photo grid with captions on the left, bullet list on the right separated by a vertical divider.
Section break for the Growth pillar.
Divider template with the 'Growth' tab highlighted in orange.
Expanding globally with a staged entry into lithium brine. Binding farm-in with NEXT Lithium Corp, staged to earn up to 100% of the Centenario lithium brine project in Salta Province, Argentina; initial consideration of US$15 million (US$5 million cash and shares valued at US$10 million); Phase 1: US$15 million of project expenditure over 24 months to earn a 49% interest; capital discipline built in with phased spend; drilling expected to start in early 2027.
Tenement map on the left (Centenario in orange, neighbouring Pastos Grande, Pozuelos and Centenario Ratones blocks in blue/navy with legend) and transaction bullets on the right.
Section break introducing the financial results.
Divider template with beige caption bar and rounded photo.
Q1 FY27 cash-flow waterfall in A$m: cash 30 Jun 2026 $561; receipts from customers $193; interest receipts $6; production and other operating costs ($130); offtake settlement ($22); sustaining capex ($14); growth capex ($68); interest, principal and leases ($23); FX $0; cash 30 Sep 2026 $502. Operating +$47m (underlying +$69m), investing ($82)m, financing ($23)m, net cash flow $(58)m. Growth capex comprised $23m ramp-up, $38m optimisation and 4.2 Mtpa expansion and $7m Centenario; scheduled Ford and LISP principal repayments began ($13m). Footnote explains the offtake settlement related to a $21.6 million FY26 accrual.
Wide waterfall chart grouped into operating, investing and financing bands with navy start/end bars, green inflows and salmon outflows; bullet commentary on the right.
Stronger pricing partly offset by higher unit costs on reduced volumes. Q1 FY27 vs Q4 FY26: revenue $199m vs $235m (-15%); average realised price US$1,966 vs 1,880/dmt SC6e (+5%) and A$2,400 vs 2,182/dmt sold (+10%); unit operating cost (FOB) A$1,259 vs 995/dmt sold (27% higher); cash balance $502m vs $561m (-10%). Commentary: shipments reflected scheduled maintenance and weather at Geraldton; total costs held broadly flat at ~$104m.
Blue-header financial table with quarter-on-quarter change columns on the left; grouped bullet commentary on the right.
Net cash position maintained with low gearing. Net (debt)/cash in A$m: Jun 25 (566), Dec 25 (449), Jun 26 192, Sep 26 146. Gross debt gearing 55%, 52%, 20%, 19% and net debt gearing 49%, 37%, then 0 over the same dates. Illustrative borrowing capacity: existing debt $356m; at 2x Debt/EBITDA total $630m (headroom 274), at 3x $945m (headroom 589), assuming FY27 Visible Alpha consensus EBITDA of ~A$315m.
Three charts side by side: positive/negative column chart, two-line gearing chart (solid and dashed), stacked leverage-capacity columns.
Section break introducing the lithium market outlook.
Divider template with centred caption bar.
Lithium market balance forecasts in tonnes LCE from a range of six broker forecasts. 2026: range +97k to (404k), average (121k), market size 2.0 Mt LCE. 2027: range +193k to (132k), average +28k, market size 2.4 Mt LCE. Commentary: outlook finely balanced for CY26 and CY27; average deficit of 121 kt in CY26 (~6% of supply) and surplus of 28 kt in CY27 (~1.2%) against ~400 kt LCE of net new supply; low Chinese inventories and restocking could tighten the market. Sources: Barrenjoey, JP Morgan, Macquarie, Goldman Sachs, UBS and Deutsche Bank (September-October 2026).
Floating range-bar chart with average markers on the left, bullets on the right, source note below.
FY27 guidance: concentrate production 390-440 kdmt (at 5.1% grade, allowing for planned shutdowns and expansion tie-in downtime), unit operating cost A$1,050-1,250/dmt sold FOB, total capital expenditure $435-495 million.
Panoramic photo of the open pit and tailings facility across the slide with three translucent white guidance cards showing large orange ranges.
Ramp-up on plan and stepping up: 389 kt ore mined (up 9%), record 4,021 m developed, ~1.9 Mtpa targeted in Q2, 2.8 Mtpa by end FY27. FID expansion approved, building for resilience: $389m expansion capital, concentrate production up more than 50% to ~780 ktpa from FY30, first ore targeted Q1 FY28. Growth: Centenario farm-in completed, capital staged to results, Phase 1 drilling designed, Buldania advancing.
Three-column recap mirroring page 3 with blue, navy and orange pillar headings and boxed subtitles above bullet lists.
Appendix divider.
Full-bleed underground tunnel photo with a beige caption bar and blue/orange bracket accents.
Q1 FY27 physicals (Q2-Q4 blank, YTD equals Q1): underground development 4,021 m; underground ore mined 388,568 t at 1.4%; ore processed 508,143 t at 1.3% feed grade; plant availability 94%; lithia recovery 60%; ROM stockpile 81,449 t; concentrate inventory 16,223 dmt; concentrate production 77,982 dmt; concentrate sales 82,561 dmt; lithia grade shipped 5.2% Li2O; tantalite concentrate production 138 dmt.
Four stacked blue-header tables (Mining, Processing, Inventory, Production & Sales) with quarterly and shaded YTD columns.
Kathleen Valley Mineral Resource at 30 June 2026 (0.6% Li2O underground cut-off): Measured 14 Mt at 1.32%, Indicated 106 Mt at 1.36%, Inferred 26 Mt at 1.24%, stockpiles 0.3 Mt; total 147 Mt at 1.33% Li2O and 130 ppm Ta2O5. Ore Reserves at 30 June 2026: stockpiles Proved 0.3 Mt at 1.02%; open pit 0.0; underground Proved 5.4 Mt at 1.30% and Probable 63.1 Mt at 1.32%; total 68.8 Mt at 1.32% Li2O and 118 ppm Ta2O5. Notes give cut-off grades and pricing assumptions.
Two blue-header resource and reserve tables stacked vertically with small-print notes beneath each.
Closing contact slide naming the Investor Relations contact, the West Perth head-office address, general phone and email, and social media handles.
Beige rounded panel with contact text on the left, large photograph of a worker leaning on a yellow handrail beneath a conveyor on the right.
Häufige Fragen zu dieser Folie und dem zugrunde liegenden Präsentationsinhalt.
It is Liontown Resources' 27-page September Quarter FY27 results presentation dated 29 October 2026 and lodged with the ASX (ticker LTR). It covers the Kathleen Valley underground ramp-up, the approved Kathleen Valley Expansion, the Centenario brine farm-in in Argentina, quarterly cash flow and financial metrics, the lithium market outlook and restated FY27 guidance.
Liontown uses the Australian financial year running July to June, so FY27 covers July 2026 to June 2027 and the September Quarter (Q1 FY27) covers July to September 2026. Dollar figures in the deck are Australian dollars (A$) unless marked US$.
According to the slides: a record 4,021 metres of underground development (up 21% on 3,316 m), 388,568 tonnes of underground ore mined at 1.4% Li2O, 77,982 dmt of concentrate produced, 82,561 dmt sold, a realised price of US$1,966/dmt SC6e and a unit operating cost of A$1,259/dmt sold FOB.
A staged $389 million investment (real 2026 dollars) that builds capacity from 2.8 Mtpa to 4.2 Mtpa and lifts concentrate production by more than 50% to ~780 kdmt per annum (5-year average FY30-FY34), with a stated capital intensity of A$1,619/dmt, an expected ~2.5-year payback, first ore from Kathleen's Corner Underground targeted for Q1 FY28 and completion by the end of Q2 FY29.
Page 22 restates FY27 guidance as 390-440 kdmt of concentrate production, a unit operating cost of A$1,050-1,250/dmt sold FOB and total capital expenditure of $435-495 million, inclusive of the updated expansion capital.
Cash was $502m at 30 September 2026, down from $561m, with a net cash position of A$146m, gross debt gearing of 19% and net debt gearing of 0. An illustrative chart shows borrowing headroom of 274 at 2x and 589 at 3x Debt/EBITDA on existing debt of $356m (A$m).
Yes. The gallery page offers the original PDF and an editable PPTX converted from it, useful as a reference for a mining or resources quarterly results deck. The PPTX is a machine conversion, so check fonts and charts before reuse; the content itself belongs to Liontown and is shown for reference.
The presentation was lodged with the Australian Securities Exchange (ASX) as a company announcement by Liontown Limited (ASX: LTR) and is also available from the company's website, liontown.com.
Company website with ASX announcements, quarterly reports and presentations

Create Your Own Slides
Turn your ideas into professional presentations in seconds with 2slides AI.
Referenzieren Sie professionelle Designs, wählen Sie Ihren Stil und generieren Sie Folien mit perfekter Textdarstellung. Angetrieben von Nano Banana—beginnen Sie jetzt mit der Erstellung Ihrer Präsentation.
Ihr KI-Agent für Folien. Sparen Sie Zeit, glänzen Sie schneller mit intelligenter Präsentationserstellung.


© 2026 2slides. Alle Rechte vorbehalten.