
Teil von Investorenpräsentationen als Beispiel · Beispiele für japanische Investorenpräsentationen
Komatsu H1 FY2026 Earnings Presentation (April–September 2026): Komatsu's Japanese-language results briefing deck (2026年度 第2四半期 決算説明会資料) for the second quarter and first half of the fiscal year ending March 2027, published on TDnet, the Tokyo Stock Exchange timely-disclosure system. First-half revenue rose 14.1% to ¥2,158.6 billion (¥21,586 億円), operating profit rose 3.5% to ¥286.6 billion and net income rose 9.2% to ¥191.9 billion; the full-year forecast was raised to revenue of ¥4.45 trillion, operating profit of ¥585.0 billion and net income of ¥382.0 billion.
Nutzt das Titelbild dieser Präsentation als Stilvorlage für Folien aus eigenen Inhalten. Alternativ eine beliebige Seite unten wählen und ihr Layout als Vorlage nehmen.
Schnellnavigation
Tags
Folien teilen
Komatsu H1 FY2026 Earnings Presentation (April–September 2026): Komatsu's Japanese-language results briefing deck (2026年度 第2四半期 決算説明会資料) for the second quarter and first half of the fiscal year ending March 2027, published on TDnet, the Tokyo Stock Exchange timely-disclosure system. First-half revenue rose 14.1% to ¥2,158.6 billion (¥21,586 億円), operating profit rose 3.5% to ¥286.6 billion and net income rose 9.2% to ¥191.9 billion; the full-year forecast was raised to revenue of ¥4.45 trillion, operating profit of ¥585.0 billion and net income of ¥382.0 billion.
Detaillierte Ansicht jeder Folien-Seite, einschließlich Layout, wichtigem Inhalt und visuellen Elementen.
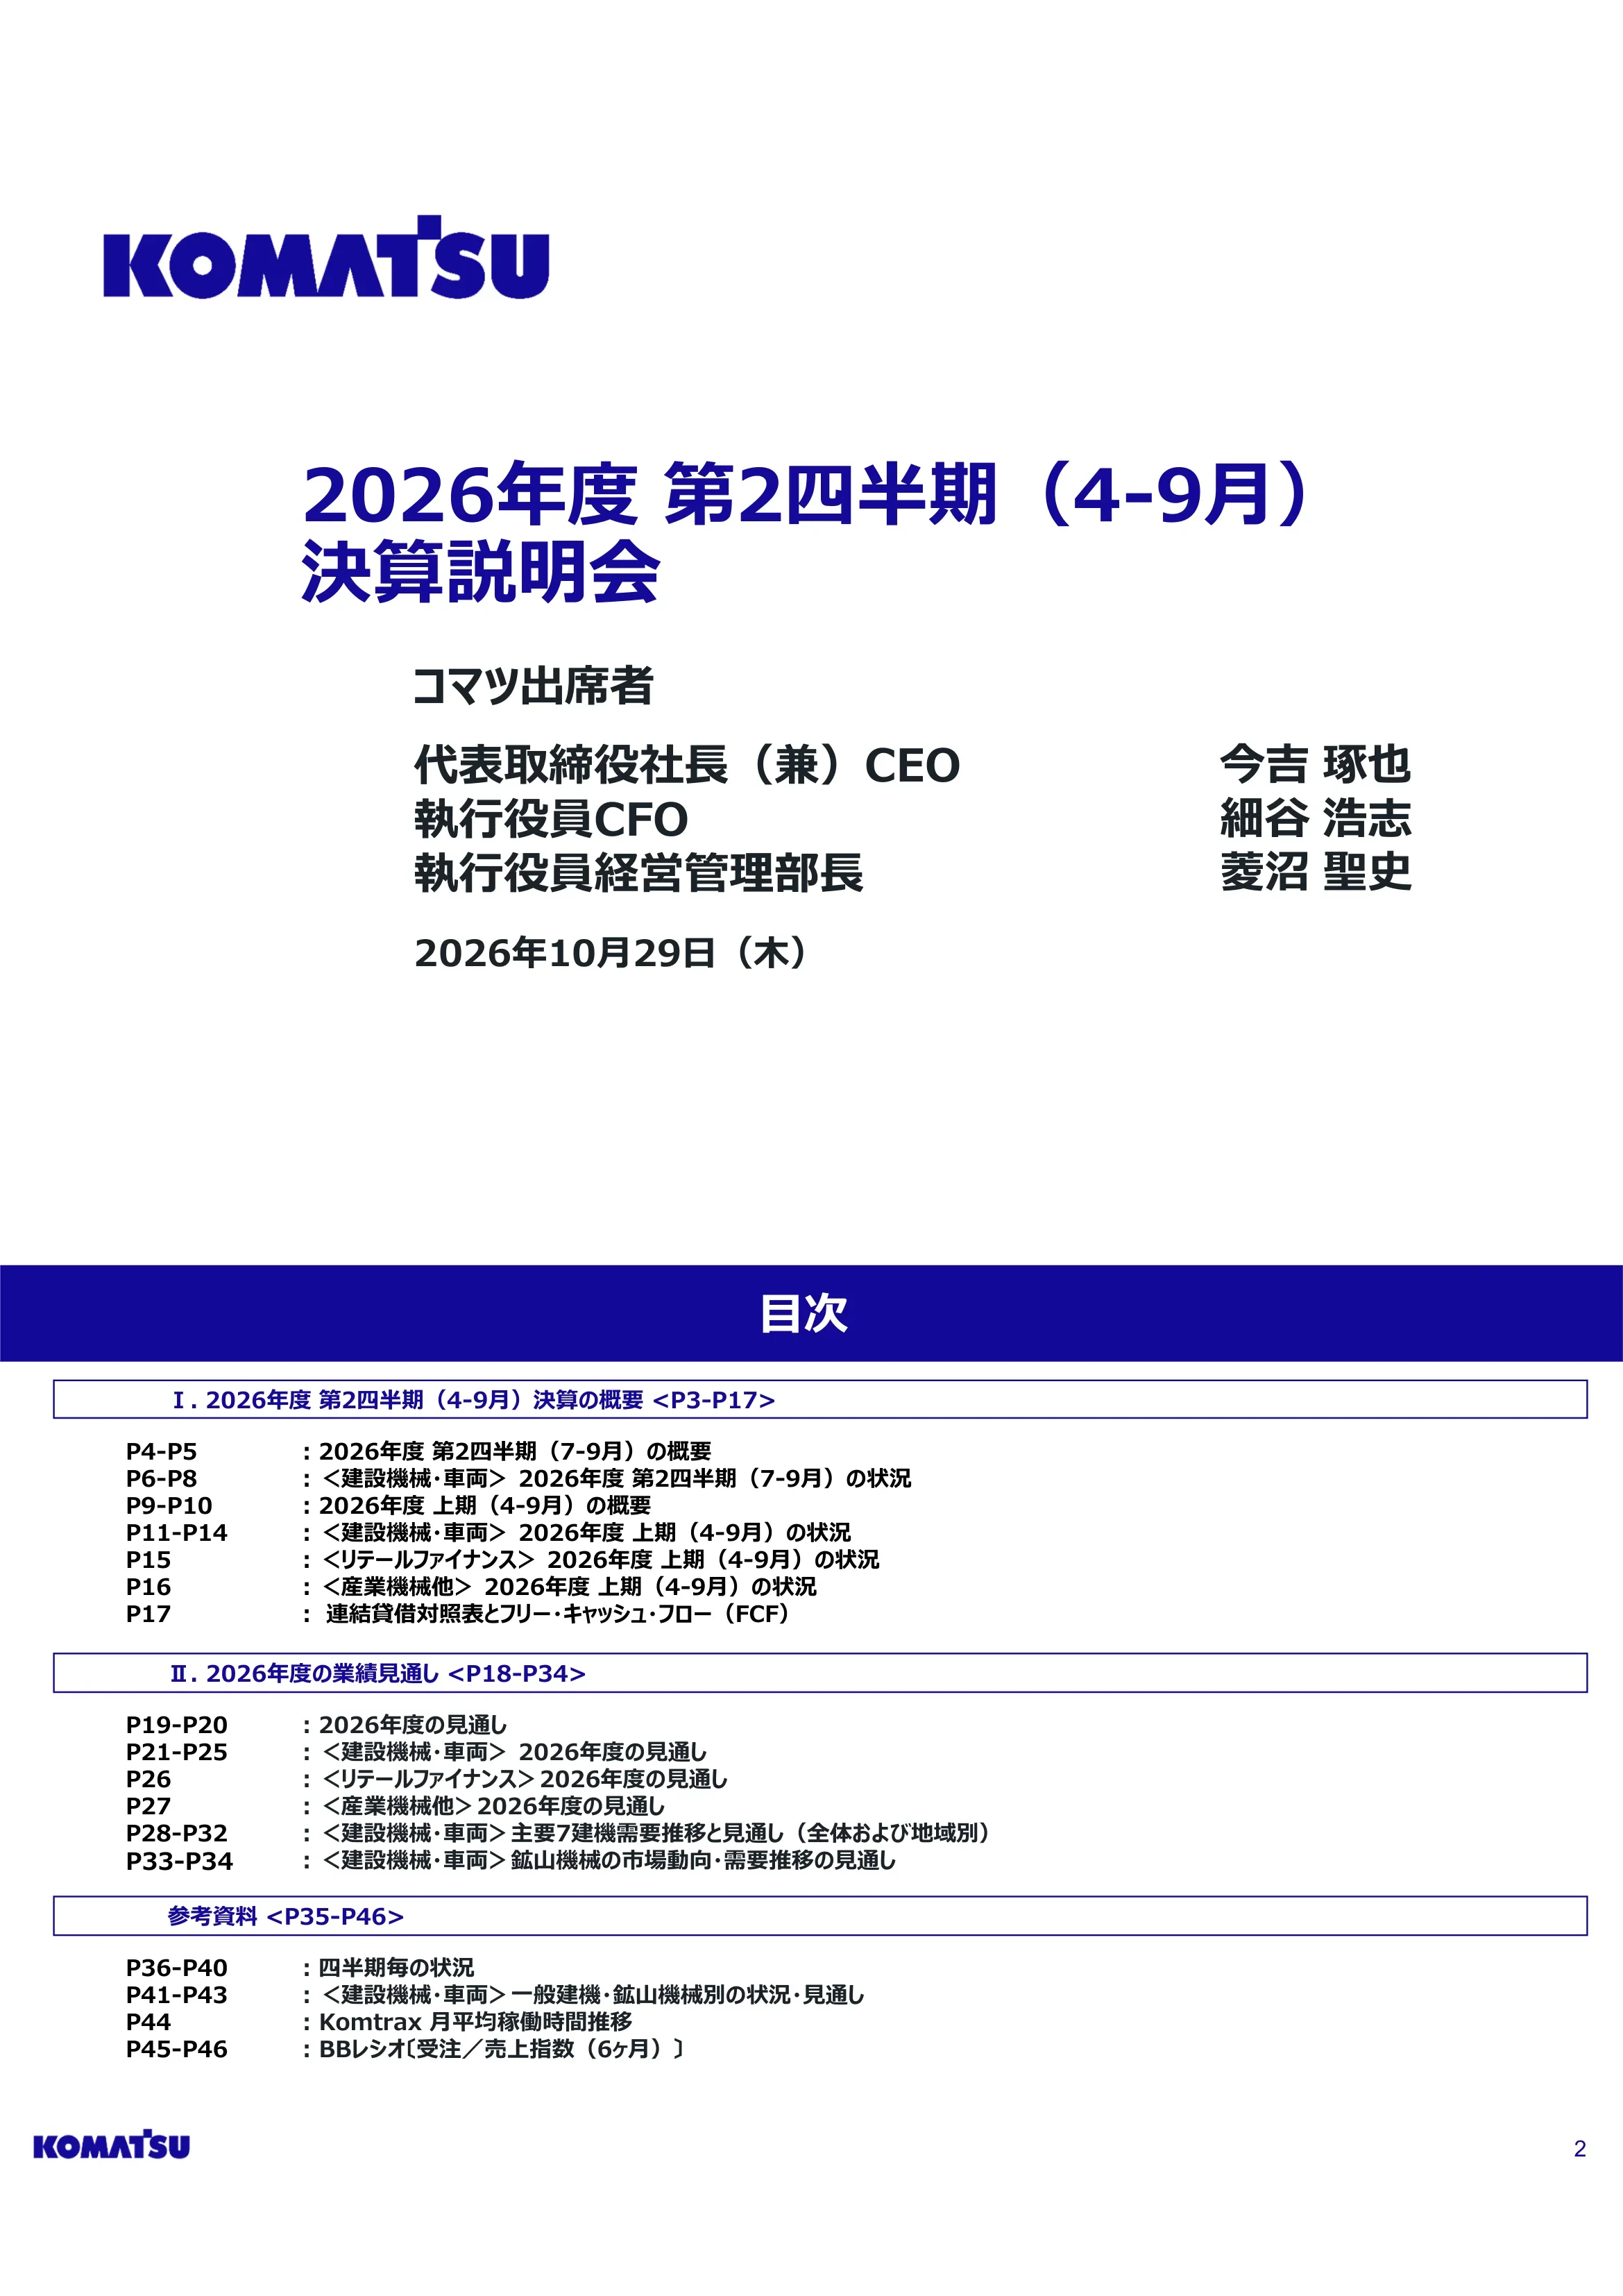
Title slide for Komatsu's FY2026 second-quarter (April–September) results briefing dated October 29, 2026, listing the presenters: President and CEO Takuya Imayoshi, Executive Officer and CFO Hiroshi Hosotani, and the Executive Officer heading Corporate Controlling.
White background with the blue KOMATSU wordmark top-left, a large navy two-line title in the center and a presenter list with titles and names below.
Agenda in three parts: I. FY2026 Q2 results overview (pp. 3–17, covering Q2 and H1 consolidated, segment, regional, retail finance, industrial machinery, balance sheet and free cash flow); II. FY2026 outlook (pp. 18–34, including demand for seven major construction equipment categories and mining equipment); and Reference materials (pp. 35–46, quarterly data, mining vs. general equipment, Komtrax utilization and book-to-bill ratios).
Full-width navy title bar with three outlined section headers, each followed by a page-range list in two columns.
Section divider introducing the review of results for the first half of FY2026.
Navy band across the top and a single outlined box with the section title centered on a white page.
Q2 revenue rose 13.6% year on year to ¥1,115.5 billion (¥11,155 億円); operating profit fell 1.2% to ¥135.1 billion with the operating margin down 1.8 points to 12.1%; net income attributable to owners rose 13.3% to ¥95.8 billion, helped by a smaller other-expense line. Average rates were ¥159.4/USD, ¥183.7/EUR and ¥112.2/AUD versus ¥147.3/USD a year earlier.
Grey summary callout with three bullet points above a blue-headed comparison table (prior-year Q2, current Q2, change and % change).
Construction, Mining & Utility Equipment revenue grew 15.1% to ¥1,032.6 billion but segment profit fell 4.5% to ¥114.3 billion (margin 11.1%, down 2.2 points) as cost increases offset weaker-yen, volume and pricing gains. Retail Finance revenue rose 7.2% to ¥32.7 billion with profit up 3.0% to ¥7.7 billion. Industrial Machinery & Others revenue fell 2.9% to ¥61.6 billion on lower automotive sales, but profit jumped 28.4% to ¥12.1 billion on high-margin semiconductor maintenance sales.
Bullet banner above a segment table showing external sales in parentheses, revenue, segment profit and boxed margin percentages, with segment commentary notes at the bottom.
Q2 external sales rose 14.9% to ¥1,028.8 billion, or 5.9% excluding FX. North America grew to ¥284.5 billion (+20.5%) and Latin America to ¥239.1 billion (+31.0%), Africa rose 31.9%, while the Middle East (-21.8%), Oceania (-2.5%) and China (-2.5%) declined. North America accounts for 28% and Latin America 23% of the regional mix.
Left: horizontal waterfall from ¥895.0 billion to ¥1,028.8 billion with regional increments; right: two stacked 100% bars of regional mix; bottom: regional data table including FX-neutral change.
Mining equipment external sales rose 8.5% to ¥502.0 billion but fell 1.4% excluding FX. Latin America (+¥38.3 billion to ¥186.2 billion) and Africa (+26.3%) grew on copper and gold demand, while Oceania, the Middle East (-60.1%) and Asia declined. Latin America is now 37% of mining sales.
Same template as page 6: regional waterfall left, stacked regional mix right, data table below.
General construction equipment external sales rose 21.9% to ¥526.8 billion, up 13.7% excluding FX, with growth in every region except China. North America climbed 28.4% to ¥179.8 billion (34% of the mix), Latin America 52.7%, Europe 14.7% and Africa 52.0%; Japan rose 3.8% to ¥75.6 billion.
Regional waterfall left, stacked regional mix bars right, and a regional data table across the bottom.
First-half revenue rose 14.1% to ¥2,158.6 billion; operating profit rose 3.5% to ¥286.6 billion with the margin down 1.3 points to 13.3%; pre-tax income rose 4.9% to ¥271.0 billion and net income attributable to owners rose 9.2% to ¥191.9 billion. Average H1 rates were ¥159.0/USD versus ¥146.4/USD a year earlier.
Bullet summary banner above a two-period P&L comparison table with FX rates in the header.
Construction, Mining & Utility Equipment H1 revenue rose 14.8% to ¥1,999.6 billion and segment profit 1.0% to ¥244.5 billion (margin 12.2%, down 1.7 points). Retail Finance revenue rose 7.3% to ¥65.4 billion with profit of ¥17.4 billion (+2.9%). Industrial Machinery & Others revenue rose 7.1% to ¥114.5 billion and profit 27.0% to ¥21.1 billion (margin 18.4%), as semiconductor gains outweighed weaker automotive sales.
Bullet banner, segment revenue/profit table with boxed margins and external sales in parentheses, and segment status notes.
H1 external sales rose 14.8% to ¥1,993.8 billion, up 4.8% excluding FX. Latin America (+¥115.0 billion to ¥454.5 billion), North America (+¥114.2 billion to ¥573.7 billion) and Africa (+31.7%) grew, while Asia (-15.1%), the Middle East (-37.2%) and Japan (-3.9%) declined. North America is 29% and Latin America 23% of the mix.
Regional waterfall from ¥1,737.2 billion to ¥1,993.8 billion, stacked regional mix bars and regional data table.
H1 mining equipment external sales rose 11.0% to ¥964.4 billion, up just 0.2% excluding FX. Latin America rose 29.6% to ¥351.2 billion and Africa 28.5% to ¥114.0 billion, offset by falls in Asia (-36.1%) and the Middle East (-72.1%). Latin America is 36% of mining sales.
Waterfall, stacked regional mix and data table in the standard regional template.
H1 general construction equipment external sales rose 18.6% to ¥1,029.4 billion, up 9.5% excluding FX, with every region except Japan and the Middle East growing. North America rose 31.6% to ¥369.0 billion (36% of the mix) and Latin America 50.5% to ¥103.3 billion; Japan fell 3.9% to ¥135.2 billion.
Regional waterfall, stacked mix bars and bottom data table.
Revenue rose ¥257.4 billion to ¥1,999.6 billion on FX (+¥174.0 billion), volume (+¥56.1 billion) and pricing (+¥27.3 billion). Segment profit rose ¥2.5 billion to ¥244.5 billion: FX +¥40.9 billion, volume/mix +¥1.6 billion and pricing +¥27.3 billion were offset by cost increases of ¥46.9 billion (including a ¥39.7 billion US tariff impact, partly offset by ¥12.8 billion of tariff pass-through, net ¥26.9 billion) and fixed costs of ¥20.4 billion. Margin fell from 13.9% to 12.2%.
Two side-by-side waterfall charts (revenue and segment profit bridges) with blue positive and pink negative bars, a tariff detail inset and margin ovals.
Retail Finance assets rose ¥24.6 billion from March to ¥1,642.5 billion; borrowings were ¥1,297.0 billion with a net debt-to-equity ratio of 4.50. New contracts rose ¥117.4 billion to ¥652.4 billion on higher use in North America, Europe and Africa. Revenue rose to ¥65.4 billion and segment profit to ¥17.4 billion, with ROA of 2.4%.
Four chart panels in a row: stacked regional assets, borrowings bars with D/E line, stacked new contracts, and revenue/profit bars with an ROA table.
Segment revenue rose 7.1% to ¥114.5 billion and segment profit 27.0% to ¥21.1 billion, with the margin up 2.9 points to 18.4%. By business: Komatsu Industries ¥28.3 billion (-15.5%), Komatsu NTC ¥17.6 billion (-27.7%), Gigaphoton ¥41.7 billion (+29.6%) and others ¥26.9 billion (+59.1%), reflecting weaker automotive and stronger semiconductor demand.
Three panels: revenue bar chart, revenue breakdown table by subsidiary, and segment profit bars with margin markers.
Total assets rose ¥103.2 billion from March to ¥6,527.2 billion, mainly from inventory up ¥92.8 billion to ¥1,694.7 billion. Owners' equity ratio fell 1.5 points to 53.2%. Net interest-bearing debt was ¥1,065.0 billion (net D/E 0.31; -0.07 excluding retail finance). H1 operating cash flow was ¥139.3 billion and free cash flow ¥20.3 billion; full-year FCF is forecast at ¥270.0 billion.
Left: balance sheet table (March vs. September) with dotted bracket linking cash and borrowings to net debt; right: free cash flow table for FY2025, FY2026 H1 and FY2026 forecast.
Section divider introducing Komatsu's full-year FY2026 forecasts.
Navy top band and a centered outlined section title box.
The forecast was raised: revenue +7.7% to ¥4,450.0 billion (¥148.0 billion above the July forecast), operating profit +3.1% to ¥585.0 billion (+¥30.0 billion) with a 13.1% margin, and net income +1.5% to ¥382.0 billion (+¥33.0 billion). ROE is forecast at 11.0% and the dividend at ¥190 per share (44.2% payout). H2 assumes ¥150/USD, ¥174/EUR and ¥106/AUD; each ¥1 move shifts revenue by ¥15.1 billion (USD) and operating profit by ¥4.6 billion.
Bullet banner, a wide P&L forecast table (FY2025 actual, latest forecast, July forecast, revisions and YoY change), shareholder-return rows below and an FX sensitivity mini-table at bottom right.
Construction, Mining & Utility Equipment revenue is forecast at ¥4,120.0 billion (+8.2%) with segment profit of ¥504.0 billion (+2.6%, margin 12.2%). Retail Finance revenue ¥129.5 billion (+2.7%) and profit ¥36.5 billion (-0.2%). Industrial Machinery & Others revenue ¥257.5 billion (+7.9%) and profit ¥44.0 billion (+16.0%) as semiconductor demand offsets fewer large press sales.
Bullet banner, segment forecast table comparing FY2025, latest and July forecasts with boxed margins, plus segment commentary notes.
Full-year external sales are forecast at ¥4,092.3 billion, up 7.8% or 4.4% excluding FX. North America (+¥83.2 billion to ¥1,130.4 billion), Latin America (+¥132.4 billion to ¥909.3 billion) and Africa (+26.2%) drive growth, while Asia (-8.9%) and the Middle East (-20.7%) decline.
Regional waterfall left; three stacked bars (FY2025, latest forecast with dashed outline, July forecast) right; regional data table below.
Mining equipment external sales are forecast at ¥1,996.7 billion, up 4.8% or 0.9% excluding FX. Lower coal-related demand in Asia and a Middle East decline from regional conflict are offset by robust copper and gold mining demand in Latin America (+11.5%) and Africa (+24.3%), leaving overall demand roughly flat.
Regional waterfall, three stacked forecast bars and regional data table.
General construction equipment external sales are forecast at ¥2,095.6 billion, up 10.8% or 7.9% excluding FX. North America (+12.3% to ¥703.8 billion) and Latin America (+38.5%) offset a 15.2% Middle East decline linked to regional conflict; Japan is forecast at ¥316.5 billion (+1.2%).
Regional waterfall, three stacked forecast bars and a regional data table.
Q2 parts sales rose 11.7% year on year to ¥291.1 billion, and full-year FY2026 parts sales are forecast at ¥1,117.7 billion (+5.9%, revised from July). Aftermarket (parts plus service) runs at about 51–52% of external sales; annual sales are shown from FY18 to FY26 and quarterly sales from FY22 Q1 to FY26 Q2.
Two stacked bar charts (annual and quarterly) splitting equipment, parts and service, each with an aftermarket-ratio line on a secondary axis.
Forecast revenue rises ¥314.0 billion to ¥4,120.0 billion from FX (+¥130.0 billion), volume (+¥127.4 billion) and pricing (+¥56.5 billion). Segment profit rises ¥12.9 billion to ¥504.0 billion: FX +¥30.2 billion, volume/mix +¥21.8 billion and pricing +¥56.5 billion versus cost increases of ¥51.9 billion (US tariffs ¥44.8 billion less ¥27.0 billion pass-through) and fixed costs of ¥43.8 billion. Margin is forecast at 12.2% versus 12.9%.
Paired revenue and segment profit waterfall charts with a tariff detail inset and margin ovals.
Retail Finance assets are forecast to rise ¥40.0 billion to ¥1,657.8 billion by March 2027 with borrowings of ¥1,320.9 billion (net D/E 4.50). New contracts are forecast up ¥106.5 billion to ¥1,297.4 billion on North America, Europe, Oceania and Africa. Revenue rises ¥3.4 billion to ¥129.5 billion while segment profit is flat at ¥36.5 billion due to higher costs; ROA 2.3%.
Four-panel layout of stacked assets, borrowings with D/E line, new contracts and revenue/profit bars with an ROA table.
Segment revenue is forecast at ¥257.5 billion (+7.9%) and segment profit at ¥44.0 billion (+16.0%, margin 17.1%). Komatsu Industries falls 9.7% on fewer large presses and Komatsu NTC 1.7%, while Gigaphoton rises 26.0% to ¥87.7 billion on customers' increased semiconductor production.
Revenue bar chart, subsidiary breakdown table and profit bars with margin markers.
Global demand for the seven major construction equipment categories rose 6% year on year in Q2 (+12% in H1). The FY2026 demand outlook was raised to +5% to +10% from 0% to +5% in July; FY2025 demand rose 8% (index 103 vs. FY19 = 100).
Left: annual stacked bars by region with an index box and YoY line; right: quarterly stacked bars from FY22 Q1 with YoY line labels.
North American demand rose 14% in Q2 (+15% in H1) on rental demand driven by data center investment, plus solid mining and energy demand. The FY2026 outlook was raised to +5% to +10%. Rental-company demand grew 55% and mining/energy 8%, while housing fell 2%.
Left: annual demand bars (US/Canada) with housing starts line; top right: quarterly demand bars with YoY line; bottom right: 100% stacked demand mix by customer segment.
European demand rose 2% in Q2 (+6% in H1); the FY2026 outlook remains 0% to +5%, unchanged since April, with public investment in Germany and the UK leading demand. FY2025 demand rose 8%.
Left annual demand bars; top right quarterly demand with YoY line; bottom right regional demand split (UK/France/Germany, Northern, Eastern, Southern Europe).
Asian demand rose 8% in Q2 (+5% in H1); the FY2026 outlook was changed to flat. In Indonesia, agricultural demand is firm while coal demand remains weak; public works and growth support demand in India; some other Asian countries saw lower demand due to soaring energy prices. Indonesian construction and mining demand rose 12% in Q2.
Left annual demand bars by country; top right quarterly demand by country with YoY line; bottom right Indonesia demand by customer industry (forestry, agriculture, construction, mining).
Japanese demand fell 2% in Q2 (-6% in H1), recovering gradually from a sharp Q1 drop in both general and rental demand. The FY2026 outlook remains flat. Hydraulic excavator demand from rental companies fell 12% while general users rose 6%; construction investment is overlaid from MLIT data.
Left annual demand bars with construction investment line; top right quarterly demand with YoY line; bottom right hydraulic excavator demand split by rental and general users.
Copper remains high on firm demand and gold, despite temporary corrections, stays high over the long term. Iron ore and coking coal are stable, while thermal coal prices are trending up as Middle East tensions lift crude oil prices. Charts cover 2018–2026 prices from COMEX, World Bank, Wood Mackenzie and Thomson Reuters.
Bullet banner above a 3×2 grid of line charts for copper, gold, iron ore, coking coal, thermal coal and nickel, each labeled with its data source.
Mining equipment demand rose 5% in Q2 (-1% in H1), with solid copper mining demand in Latin America and gold mining demand in Africa and North America. The FY2026 outlook was revised to 0% to -5% from -5% to -10% in July; FY2025 demand fell 10%. Mining equipment is defined by size thresholds such as 75t+ dump trucks and 200t+ excavators.
Left annual stacked demand bars by region with YoY line; right quarterly stacked bars with YoY line; footnote defining equipment classes.
Section divider for the reference appendix.
Navy header band with a centered outlined title box.
Quarterly consolidated revenue and operating profit from FY2023 Q1 to FY2026 Q2, by segment. FY2026 Q2 revenue was ¥1,115.5 billion versus ¥982.1 billion a year earlier; operating profit was ¥135.1 billion (12.1% margin) versus ¥136.7 billion (13.9%). Quarterly FX rates are tabulated between the charts.
Top stacked bar chart of quarterly revenue by segment, a middle FX rate table and bottom operating profit bars with a margin line; current quarters circled in red.
Segment revenue by quarter from FY2023 Q1, reaching ¥1,032.6 billion in FY2026 Q2 versus ¥897.3 billion a year earlier; segment profit was ¥114.3 billion (11.1% margin) versus ¥119.7 billion (13.3%).
Quarterly revenue bars, FX table and segment profit bars with margin line, red circles highlighting comparable quarters.
Quarterly external sales by region from FY2023 Q1 to FY2026 Q2. FY2026 Q2 totaled ¥1,028.8 billion, led by North America (¥284.5 billion) and Latin America (¥239.1 billion); the record quarter was FY2025 Q4 at ¥1,115.6 billion.
Large stacked bar chart with ten color-coded regions and a legend at right, FX rate table below.
Retail Finance quarterly revenue rose from ¥22.9 billion in FY2023 Q1 to ¥32.7 billion in FY2026 Q2; Q2 segment profit was ¥7.7 billion with a 23.7% margin, versus ¥7.5 billion (24.6%) a year earlier.
Quarterly revenue bars, FX table and profit bars with margin line.
Industrial Machinery & Others revenue was ¥61.6 billion in FY2026 Q2 versus ¥63.5 billion a year earlier, while segment profit rose to ¥12.1 billion with a 19.6% margin, the highest in the series shown (from 2.7% in FY2023 Q3).
Quarterly revenue bars, FX table and profit bars with margin line, red circles on comparable quarters.
Long-run mining equipment unit demand by region from FY2011 to FY2026 and mining sales including parts and service from FY2014 (¥499.3 billion) to a forecast ¥1,996.7 billion in FY2026 (+5%), versus ¥1,944.7 billion in the July forecast.
Two stacked bar charts side by side (unit demand and sales) by region with YoY lines and dashed forecast bars.
Annual external sales split into equipment, parts and service for mining equipment and general construction equipment from FY18 to FY26 forecast. Aftermarket accounts for about 65–66% of mining sales but only 37–38% of general construction sales; FY26 mining sales are forecast at about ¥1,996.7 billion and general at ¥2,095.6 billion.
Two side-by-side stacked bar charts with aftermarket-ratio lines and brackets marking aftermarket.
Quarterly equipment, parts and service sales from FY22 Q1 to FY26 Q2 for mining and general construction equipment. Mining aftermarket was 68% of FY26 Q2 sales; general construction aftermarket was 38%.
Two quarterly stacked bar charts with aftermarket-ratio lines, mirroring page 42.
Komtrax telematics data shows average monthly machine operating hours from October 2024 to September 2026 for Japan, Europe, North America and Indonesia, with year-on-year changes. Indonesia runs about 200 hours a month, far above Japan, Europe and North America at roughly 50–80 hours.
Four-quadrant grid of bar-and-line combo charts, one per region, with operating hours bars and YoY change line.
Six-month orders-to-shipments index from September 2023 to September 2026 for Komatsu America mining trucks (730E–980E) and Komatsu Mining Corp. surface and underground equipment. Both are above 100% at the latest reading, at roughly 140% and 150% respectively.
Two stacked line charts with a blue 100% reference line, product lists on the left.
Six-month book-to-bill index for Komatsu Germany super-large hydraulic excavators (PC3000–PC9000), which peaked near 400% in early 2025 and has returned to about 100%, and for Komatsu standalone mining models (HD785, PC2000, WA800, D375A, GD825A) at roughly 135%.
Two stacked line charts with 100% reference lines and model lists.
Komatsu and its subsidiary EARTHBRAIN signed a strategic partnership with Washington-state AIM Intelligent Machines (CEO Adam Sadilek), a developer of autonomous operation technology for bulldozers and hydraulic excavators, to deliver autonomous construction solutions in Japan and the US, combining physical AI with Smart Construction (July 31, 2026 release).
Two-line navy headline, one-bullet summary callout and a large photo of a Komatsu D71PXi dozer, wheel loader and excavator on a dirt site.
Komatsu extended its global partnership with the Atlassian Williams F1 Team and will deepen technical collaboration, with Komatsu engineers supporting development of key components for future Williams F1 cars (September 3, 2026 release).
Headline banner, bullet callout and a signing-ceremony photo with Atlassian Williams and Komatsu Principal Partner branding.
Komatsu began selling the PC75-10M0 7-ton hydraulic excavator for Southeast Asia, developed and produced by its Indian subsidiary Komatsu India (KIPL), using India's development, production and procurement capabilities (September 10, 2026 release).
Headline banner, bullet callout and a product photo of the excavator in front of a factory.
Komatsu launched the PC200-11M2, the second model in its cost-efficient CE (Civil Engineering) series for urban civil works, and the general-purpose PC210-11M2, rolling them out in emerging markets led by Asia (September 11, 2026 release).
Headline banner, two bullets and a wide photo of the two excavators facing each other with captions.
Komatsu published its integrated report, Komatsu Report 2026, in September, reviewing the first year of its 2025–2027 mid-term plan 'Driving value with ambition' and covering automation and remote operation, AI use, human capital and natural capital. Features highlight remote-operation cockpits and field AI for service technicians.
Headline banner, bullet callout and two feature photos side by side with captions and a link to the report.
Links to Komatsu's investor relations site, mid-term management plan, Komatsu Report and IR Day materials, followed by a cautionary note that forecasts reflect management's judgment based on currently available information and may differ due to economic conditions, demand, exchange rates and regulation. Contact: Komatsu Corporate Controlling Department.
Headline banner, list of labeled hyperlinks, a ruled disclaimer box and contact details at bottom right.
Häufige Fragen zu dieser Folie und dem zugrunde liegenden Präsentationsinhalt.
For April–September 2026, Komatsu reported revenue of ¥2,158.6 billion (¥21,586 億円, +14.1%), operating profit of ¥286.6 billion (+3.5%, 13.3% margin) and net income attributable to owners of ¥191.9 billion (+9.2%). Q2 alone delivered revenue of ¥1,115.5 billion (+13.6%) and net income of ¥95.8 billion (+13.3%).
Yes. The original is Komatsu's Japanese-language results briefing deck, titled 2026年度 第2四半期(4-9月)決算説明会資料, released on October 29, 2026 through TDnet, the Tokyo Stock Exchange's timely-disclosure system. The page summaries here are written in English, with yen amounts converted from Komatsu's ¥100 million (億円) units.
Komatsu's fiscal year runs from April to March, so FY2026 covers April 2026 to March 2027. H1 (the second-quarter cumulative period) is April–September 2026, and Q2 is July–September 2026.
Yes, it raised the forecast. Revenue is now ¥4,450.0 billion (+¥148.0 billion vs. July), operating profit ¥585.0 billion (+¥30.0 billion) and net income ¥382.0 billion (+¥33.0 billion). The dividend forecast stays at ¥190 per share, and the second-half FX assumption is ¥150/USD.
In the construction equipment segment, US tariffs cost ¥39.7 billion in H1, partly offset by ¥12.8 billion of tariff-related price pass-through. For the full year, Komatsu expects a ¥44.8 billion tariff impact against ¥27.0 billion of pass-through, contributing to a segment margin decline from 12.9% to 12.2%.
Demand for the seven major construction equipment categories rose 6% in Q2, and Komatsu raised its FY2026 outlook to +5% to +10%, led by North American rental demand tied to data center investment. Mining equipment demand rose 5% in Q2, with the full-year outlook revised to 0% to -5%.
Yes. The page offers the original PDF and an editable PPTX converted from it. The PPTX retains Japanese text, so it is best used as a layout reference for waterfall charts, segment tables and regional mix charts in your own earnings deck.
It suits investors and analysts covering Komatsu (TSE: 6301) and the global heavy equipment sector, researchers tracking mining capex and commodity cycles, and IR or finance teams looking for a well-structured template for segment-heavy quarterly results presentations.
Official IR site listed on the deck's reference-links page
Original Japanese-language PDF published through the Tokyo Stock Exchange timely-disclosure system

Create Your Own Slides
Turn your ideas into professional presentations in seconds with 2slides AI.
Referenzieren Sie professionelle Designs, wählen Sie Ihren Stil und generieren Sie Folien mit perfekter Textdarstellung. Angetrieben von Nano Banana—beginnen Sie jetzt mit der Erstellung Ihrer Präsentation.
Ihr KI-Agent für Folien. Sparen Sie Zeit, glänzen Sie schneller mit intelligenter Präsentationserstellung.


© 2026 2slides. Alle Rechte vorbehalten.