
Teil von Investorenpräsentationen als Beispiel · Beispiele für japanische Investorenpräsentationen
INPEX Q3 FY2026 Earnings Presentation — a 24-slide supplementary briefing from INPEX Corporation (securities code 1605) dated November 12, 2026, covering the nine months of the fiscal year ending December 2026, with a raised full-year net income forecast of ¥550.0 billion (5,500 in units of ¥100 million, 億円). This is a Japanese-language deck whose original was published on TDnet (the Tokyo Stock Exchange's Timely Disclosure network).
Nutzt das Titelbild dieser Präsentation als Stilvorlage für Folien aus eigenen Inhalten. Alternativ eine beliebige Seite unten wählen und ihr Layout als Vorlage nehmen.
Schnellnavigation
Tags
Folien teilen
INPEX Q3 FY2026 Earnings Presentation — a 24-slide supplementary briefing from INPEX Corporation (securities code 1605) dated November 12, 2026, covering the nine months of the fiscal year ending December 2026, with a raised full-year net income forecast of ¥550.0 billion (5,500 in units of ¥100 million, 億円). This is a Japanese-language deck whose original was published on TDnet (the Tokyo Stock Exchange's Timely Disclosure network).
Detaillierte Ansicht jeder Folien-Seite, einschließlich Layout, wichtigem Inhalt und visuellen Elementen.
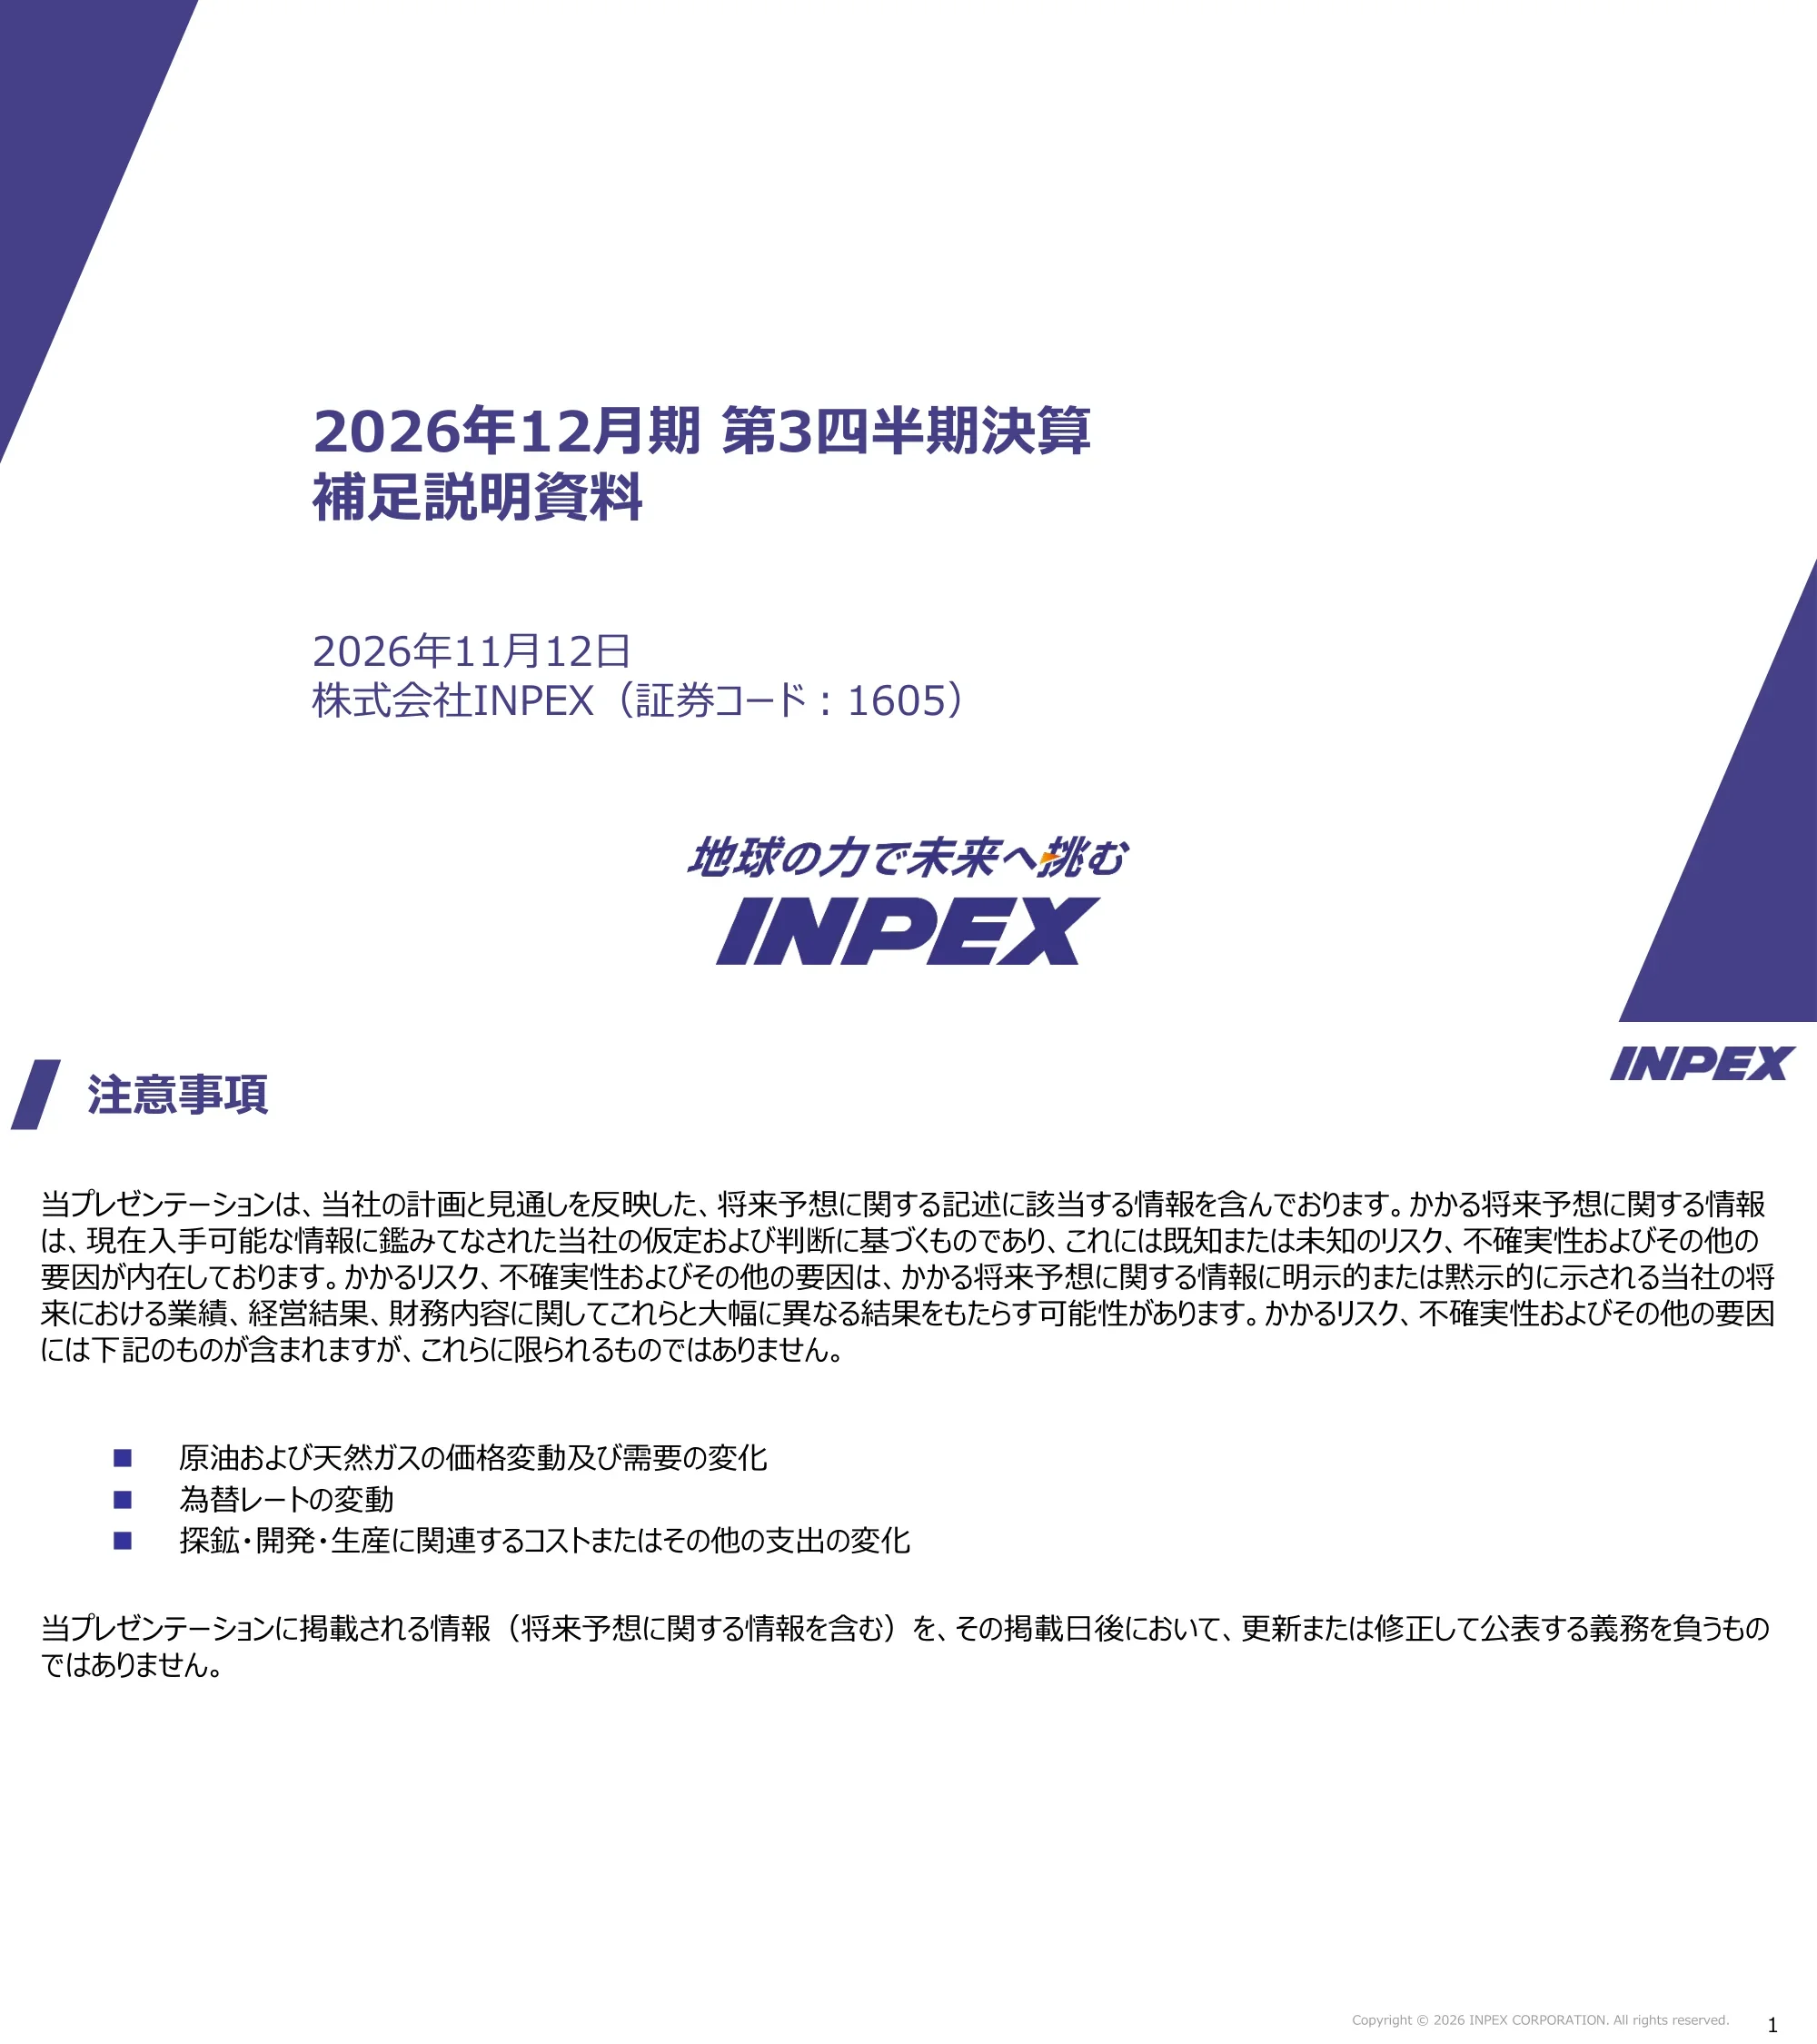
Title slide of INPEX Corporation's supplementary presentation for the third quarter of the fiscal year ending December 2026, dated November 12, 2026, with securities code 1605. The INPEX logo and its tagline (roughly 'Taking on the future with the power of the Earth') appear at the bottom.
Left-aligned title and date block in the center, with large dark-indigo diagonal shapes in the top-left and bottom-right corners and the logo centered at the bottom.
Forward-looking statement disclaimer. It says the statements reflect the company's plans and outlook and carry known and unknown risks. Listed risk factors are changes in crude oil and natural gas prices and demand, exchange-rate fluctuations, and changes in exploration, development and production costs. The company states it has no obligation to update the information after the publication date.
Title bar with accent mark at top left, an introductory paragraph, three bullet points, and a closing paragraph, all text-only.
Business: Ichthys LNG continues stable production and has started operating the first low-pressure production facility (BCM). Pilot production from Beetaloo Basin FSDA North/South acreage began at the end of August 2026, and the Bonaparte CCS FEED began in October 2026. Abadi LNG finished FEED and is in the EPC tender, and sales agreements with three buyers were reached in October. Abu Dhabi crude sales are expected to fall by about 50% year over year. Results: Q3 profit attributable to owners of the parent was 4,076 (up 1,142 year over year), and the full-year forecast is a record 5,500 (up 400 from August). Investment cash flow is expected at 10,000 in total, including 6,370 for growth investment and 3,650 for the Abadi development reserve (about 9,200 year-end balance). Shareholder returns: additional returns are planned to keep the total payout ratio at 50% or more.
Three horizontal bands, each with a colored label box on the left (Business Highlights, Performance Highlights, Shareholder Returns) and bullet text on the right, separated by dashed lines.
FEED for FPSO/OLNG was completed in October 2026, and the EPC tender for SURF/GEP/FPSO/OLNG is under way. Sales agreements (SPA/GSA) for LNG and pipeline gas were agreed with three buyers in October 2026. The company aims for FID in mid-2027, subject to economic evaluation based on post-FEED cost and schedule, final agreement of technical and commercial contracts, and approvals from stakeholders including the Indonesian government. Production start is shown for the early 2030s.
Headline text block above a Gantt-style timeline. Rows are FID, FEED (SURF/GEP and FPSO/OLNG), Marketing, Financing and Permits. Columns run from 2026 H1 through 2027 H2 and the early 2030s, with past periods shaded gray.
Nine-month comparison of Q3 FY2025 and Q3 FY2026. Brent averaged $88.86/bbl (from $69.91, +27.1%), and the yen averaged 158.67 per dollar (from 148.09, 10.58 yen weaker). Revenue was 14,292 (down 914, -6.0%), operating profit 9,228 (+499, +5.7%), profit before tax 9,533 (+415, +4.6%) and profit attributable to owners of the parent 4,076 (+1,142, +38.9%). Basic EPS was ¥351.19 (+43.1%), and BPS rose to ¥4,310.69 (+5.8%). Amounts are in units of ¥100 million (億円).
Two tables. The upper table covers market assumptions and P&L lines with columns for prior period, current period (highlighted by an indigo frame), change and percent change. The lower table shows BPS at period end. Footnotes sit at the bottom.
Crude oil revenue fell to 9,538 from 11,540 (down 2,001, -17.3%) as sales volume dropped 33.2% to 72,561 thousand bbl, while the overseas average price rose to $82.84/bbl from $71.77. Natural gas (excluding LPG) revenue rose to 4,298 from 3,426 (+872, +25.5%) on higher volume (383,116 million cf, +12.7%). Waterfalls show crude oil: volume -3,826, price +1,192, FX +632. Natural gas: volume +524, price +145, FX +203.
Left half holds a data table for crude oil and natural gas (revenue, volume, price, FX). Right half has two stacked waterfall charts, crude oil on top and natural gas below.
Despite lower revenue from reduced crude oil sales volume against a Middle East conflict backdrop, profit rose by 1,142 year over year to 4,076, helped by higher sales prices, greater equity-method gains from Ichthys downstream entities and lower income taxes. The bridge from 2,934 runs: revenue -914, cost of sales +264, exploration expenses +52, SG&A -88, equity-method income +766, other gains and losses +323, income taxes +737. A callout splits revenue into volume -3,302, price +1,337, FX +835 and other +215.
A summary sentence at the top, then a full-width waterfall chart with callout boxes explaining individual bars. A detailed breakdown box sits under the revenue bar and footnotes sit at the bottom.
The full-year net income forecast was revised up to 5,500, which is 400 above the August forecast, mainly on higher sales prices and solid Ichthys LNG production. Key forecast figures (August to November): Brent $81.4 to $90.0/bbl, FX 159.2 to 158.2 yen per dollar, revenue 19,730 to 18,750, operating profit 12,230 to 12,030, profit before tax 12,780 to 12,570, net income 5,100 to 5,500. ROIC moves from 8.2% to 9.8% and ROE from 10.5% to 11.3%. Net D/E ratio is unchanged at 0.37. The footnote says Ichthys is expected to contribute about 4,400 in segment profit.
Headline sentence above a forecast table with columns for the August forecast, the November forecast (highlighted in an indigo frame), change and percent change. Market assumptions sit in gray rows, financial lines in lavender rows, and footnotes at the bottom.
The bridge from 5,100 (August) to 5,500 (November) shows external factors of +152 (FX -22, oil price +311, project factors -137 from lower Abu Dhabi sales volume) and business factors of +247 (Ichthys +317, other projects -70). A Profit Booster table lists the full-year effect: investment incentive effect about 300 to about 200, turnaround (TA) recycling about 650 to about 800, total about 950 to about 1,000.
A waterfall chart with grouped arrows above the bars for external and business factors, callout boxes beneath the bars, and an inset Profit Booster comparison table at the lower left.
November forecast versus August (units of ¥100 million, 億円): operating cash flow 12,060 (from 10,550), investment cash flow -10,000 (from -8,590), growth investment -6,370 (from -6,760), free cash flow 2,060 (from 1,960) and financing cash flow -2,060, of which shareholder returns are -2,730. Other investing outflow is -3,630, which includes the Abadi development reserve of 3,650. Year-end cash and equivalents are 2,000. Growth axis 1 (oil and gas, centered on LNG) is -6,210, axis 2 (low-carbon, CCS and hydrogen) is -90 and axis 3 (renewables and power) is -70.
A single full-width table with columns for August forecast, November forecast and change. Rows run from operating cash flow through investing and financing items. Growth rows are shaded lavender and numbered footnotes sit below.
Investment cash flow is 10,000 (up 1,410 from the August forecast), including the Abadi development reserve of 3,650. The slide says the year-end balance of about 9,200 is ahead of the originally assumed 6,000-8,000 at the end of 2027. A stacked bar compares the August (8,590) and November (10,000) forecasts, and growth axis 1 totals 6,210 in November. A project table lists short-term items for 2026-27 (Sarawak offshore Block 2E acquisition at $350MM, an additional Southwest Caspian Sea stake at about ¥60 billion, additional Ichthys participating interest), medium-term items (Upper Zakum additional development, Bab gas cap) and the long-term Beetaloo acquisition (up to $208MM).
A headline with bullets sits on top. Below, the left side has a two-column stacked bar chart and the right side has a table of announced growth-axis-1 projects, grouped by timing of profit contribution.
Consolidated ROIC rises from 8.2% (August forecast) to 9.8% (November forecast). Domestic O&G goes from 3.5 to 5.6, overseas O&G Ichthys from 10.3 to 12.1, overseas O&G other from 7.8 to 8.3, and Other from -7.1 to 2.6. Within Other, renewables is -1.5 (from -0.5), and CCS/hydrogen (R&D etc.) shows no figure. A footnote refers to page 16 for each segment's capital employed and adjusted profit.
A table with segments in rows and columns for the August forecast, the November forecast (highlighted in an indigo frame) and the change. The consolidated row is emphasized at the bottom.
Section divider introducing the reference (appendix) pages that follow.
A white slide with a full-width dark indigo band across the middle holding the section title in white text, and the logo at the top right.
Q3 profit attributable to owners of the parent came in at 4,076 against the August-time forecast of 3,583. External factors added +26 (FX -4 with the yen at 158.7 versus 158.8 forecast, oil price +79 with Brent at $88.9 versus $85.0 forecast, project factors -49 from lower Abu Dhabi sales volume). Business factors added +404 (Ichthys +288, other projects +116), and period differences added +63 (R&D expenses and others).
A waterfall chart with grouped bracket arrows above (external factors, business factors, period differences) and callout boxes under the relevant bars.
Ichthys has produced stably since the start of 2026. One train has completed the move to low-pressure production, and the remaining two will follow through early 2027. Full-year 2026 LNG cargoes are expected to exceed the August outlook by several cargoes, and a planned shutdown of about one and a half months is scheduled from mid-July 2027. Through October 2026 the totals are LNG 106, onshore plant condensate 18, offshore field condensate 25 and LPG 30. History for 2019-2025 shows LNG at 104, 122, 117, 112, 129, 116 and 112 cargoes.
A paragraph of commentary above two tables. The top table gives 2026 monthly cargoes by product with a total column, and the bottom table lists yearly cargo counts for 2018-2025.
Oil, condensate and LPG production totals 369 thousand BOE/day (Ichthys project 36, 10%). Natural gas totals 1,399 million cf/day (265 thousand BOE/day), of which Ichthys is 1,094 (82%). Oil and gas combined is 633 thousand BOE/day, with Ichthys at 245 (39%). The 2026 net production forecast moves from 632 thousand BOE/day (August) to 635 thousand BOE/day (November).
Four panels. Three horizontal stacked bars show oil/condensate/LPG, natural gas and combined production, split into domestic O&G, overseas O&G and the Ichthys project versus other projects. A bordered box at the lower right shows the forecast change with an arrow.
Capital employed and adjusted net income by segment, August versus November forecast (units of ¥100 million, 億円). Consolidated capital employed is 69,545 (from 69,725) and adjusted net income is 6,792 (from 5,735, +1,057). Overseas O&G Ichthys shows capital 39,967 and adjusted profit 4,831 (+641). Domestic O&G shows 2,333 and 130, overseas O&G other 17,202 and 1,431, and Other 1,814 and 47. Footnotes define capital employed as a period average and adjusted profit as before interest, impairment and non-controlling interests.
A table with segment groups in rows, each with a capital employed row and an adjusted net income row. Columns are the August forecast, the November forecast and the change. The consolidated row is emphasized at the bottom.
At the end of Q3 FY2026, total assets were 82,969 (up 5,617 from end-2025, +7.3%). Current assets were 14,654, non-current assets 68,315, current liabilities 12,103, non-current liabilities 18,760 and equity 52,105. Side notes give the Ichthys downstream entities' summary figures and say the net D/E ratio is 0.33. The sensitivity box states that a one-yen move in the period-end rate shifts the translation adjustment by about 280.
A main balance-sheet table with end-2025, Q3 FY2026, change and percent change columns, plus three bordered side boxes on the right for Ichthys downstream entity data, debt and net D/E, and FX sensitivity.
Nine-month income statement with prior-period comparison (units of ¥100 million, 億円). Revenue was 14,292 (-6.0%), gross profit 8,276 (-6.5%), operating profit 9,228 (+5.7%), profit before tax 9,533 (+4.6%), income tax expense 5,130 and profit attributable to owners of the parent 4,076 (+38.9%). Equity-method investment income rose to 1,369 (+125.4%). Side boxes break out revenue effects (volume -3,302, price +1,337, FX +835, other +215) and cost-of-sales changes.
A line-by-line P&L table with prior period, current period, change and percent change. Key subtotal rows are shaded and two callout boxes at the upper right explain the revenue and cost-of-sales movements.
Other operating income was 648 (from 268), including foreign exchange gains of 562 (from 220). Other operating expenses were 90. Finance income was 933 (-4.9%), led by interest income of 874. Finance costs were 628 (+6.1%), with interest expense of 438. Footnotes explain IFRS 9 gains and losses related to Ichthys and the use of interest-rate swaps to neutralize asset retirement obligation effects.
A detailed table with line items grouped under shaded headings, columns for prior period, current period, change, percent change and a remarks column. Two long footnotes sit at the bottom.
Revenue by region and product (units of ¥100 million, 億円). Japan subtotal 1,802 (+22.6%), Australia and Southeast Asia 4,142 (+31.0%), Europe 1,163 (+83.1%), Abu Dhabi and other (Middle East, NIS countries, etc.) 6,999 (-28.7%) and Other 185 (+45.0%). Totals are crude oil 9,538 (-17.3%), natural gas excluding LPG 4,298 (+25.5%), other 455 and overall 14,292 (-6.0%).
A matrix table with region groups on the left, product rows (crude oil, natural gas excluding LPG, other, subtotal) and columns for prior period, current period, change and percent change. A gray totals block sits at the bottom.
Sales volume by region for crude oil (thousand bbl) and natural gas excluding LPG (million cf). Total crude oil fell 33.2% to 72,561 (from 108,559), driven by Abu Dhabi and other at 55,756 (-40.0%). Total natural gas rose 12.7% to 383,116 (from 339,813), with Australia and Southeast Asia at 290,158 (+10.3%) and Europe at 13,442 (+65.8%).
A matrix table with regions as row groups, two product rows per region, and columns for prior period, current period, change and percent change. A gray totals block sits at the bottom.
Production results by region and product. Total crude oil production was 100,614 thousand bbl (-7.4%), natural gas 381,981 million cf (+11.0%), iodine 362 ton (-18.6%), sulfur 82 thousand t (-27.3%) and power generation 2,077 million kWh (+19.3%). Australia and Southeast Asia gas rose to 343,769 million cf (+12.1%). A footnote says LPG and condensate are included in crude oil.
A matrix table with regional groups, product rows including iodine, sulfur and power generation where applicable, and columns for prior period, current period, change and percent change. A gray totals block sits at the bottom.
Closing brand slide with the INPEX corporate message in Japanese (about taking on global challenges, creating energy from the power of the Earth, combining team strength, never giving up the mission, and continuing to find and deliver energy today, tomorrow and onward). The slogan 'Energy for a brighter future' and the INPEX logo appear below.
A large light-blue sky-and-cloud triangle holds italic message text, with the large tagline, the logo and the English slogan stacked at the lower left.
Häufige Fragen zu dieser Folie und dem zugrunde liegenden Präsentationsinhalt.
It covers the first nine months (through the third quarter) of INPEX's fiscal year ending December 2026, compared with the same period of the prior year, and it is dated November 12, 2026. It also updates the full-year forecast for the year ending December 2026.
Revenue was 14,292 (down 6.0%), operating profit was 9,228 (up 5.7%) and profit attributable to owners of the parent was 4,076 (up 38.9%, or 1,142), all in units of ¥100 million (億円). Basic EPS was ¥351.19. Brent averaged $88.86/bbl and the yen averaged 158.67 per dollar.
Yes. The slides raise the forecast for profit attributable to owners of the parent to 5,500 (units of ¥100 million, 億円), up 400 from the August forecast of 5,100 and described as a record. The revision is attributed mainly to higher sales prices and solid Ichthys LNG production.
Abadi LNG has completed FEED, is in the EPC tender and has sales agreements with three buyers, and INPEX aims for FID in mid-2027 subject to conditions listed on the slide. At Ichthys, the first low-pressure production facility started operating, and the remaining two trains are planned to follow through early 2027.
It opens with a title slide and cautionary notes, then covers highlights, the Abadi LNG timeline, financial highlights, revenue and profit bridges, the full-year forecast, cash flow, investment and segment ROIC. A reference section follows with the profit bridge against the August forecast, Ichthys cargo counts, net production, segment capital, the balance sheet, income statement, revenue, sales volume and production tables, and a closing brand slide.
The slides are in Japanese; the page descriptions here are written in English. The original supplementary earnings briefing (決算補足説明資料) was published on TDnet, the Tokyo Stock Exchange's Timely Disclosure network, and INPEX's securities code is 1605.
Most financial tables use yen in units of ¥100 million (億円). Market assumptions use US dollars per barrel and yen per dollar, and production and sales volumes use thousand bbl, million cf and thousand BOE per day.
It works well as a structural reference. It uses a highlights page, a project timeline, comparison tables with a highlighted current-period column, three kinds of profit bridge charts, a forecast-revision table, and a full appendix of financial and operating data. The layouts are described slide by slide in this analysis.

Create Your Own Slides
Turn your ideas into professional presentations in seconds with 2slides AI.
Referenzieren Sie professionelle Designs, wählen Sie Ihren Stil und generieren Sie Folien mit perfekter Textdarstellung. Angetrieben von Nano Banana—beginnen Sie jetzt mit der Erstellung Ihrer Präsentation.
Ihr KI-Agent für Folien. Sparen Sie Zeit, glänzen Sie schneller mit intelligenter Präsentationserstellung.


© 2026 2slides. Alle Rechte vorbehalten.