
Teil von Investorenpräsentationen als Beispiel · Beispiele für indische Investorenpräsentationen
Cipla Q2 FY27 Earnings Presentation (quarter ended 30 September 2026), the 16-page investor presentation dated 27 October 2026 and filed with BSE/NSE, covering consolidated revenue of INR 7,404 Cr, EBITDA of INR 1,388 Cr (18.7% margin), PAT of INR 878 Cr, a record One India quarter, U.S. FDA approval for gAdvair Diskus, new oncology alliances and ESG progress.
Nutzt das Titelbild dieser Präsentation als Stilvorlage für Folien aus eigenen Inhalten. Alternativ eine beliebige Seite unten wählen und ihr Layout als Vorlage nehmen.
Schnellnavigation
Tags
Folien teilen
Cipla Q2 FY27 Earnings Presentation (quarter ended 30 September 2026), the 16-page investor presentation dated 27 October 2026 and filed with BSE/NSE, covering consolidated revenue of INR 7,404 Cr, EBITDA of INR 1,388 Cr (18.7% margin), PAT of INR 878 Cr, a record One India quarter, U.S. FDA approval for gAdvair Diskus, new oncology alliances and ESG progress.
Detaillierte Ansicht jeder Folien-Seite, einschließlich Layout, wichtigem Inhalt und visuellen Elementen.
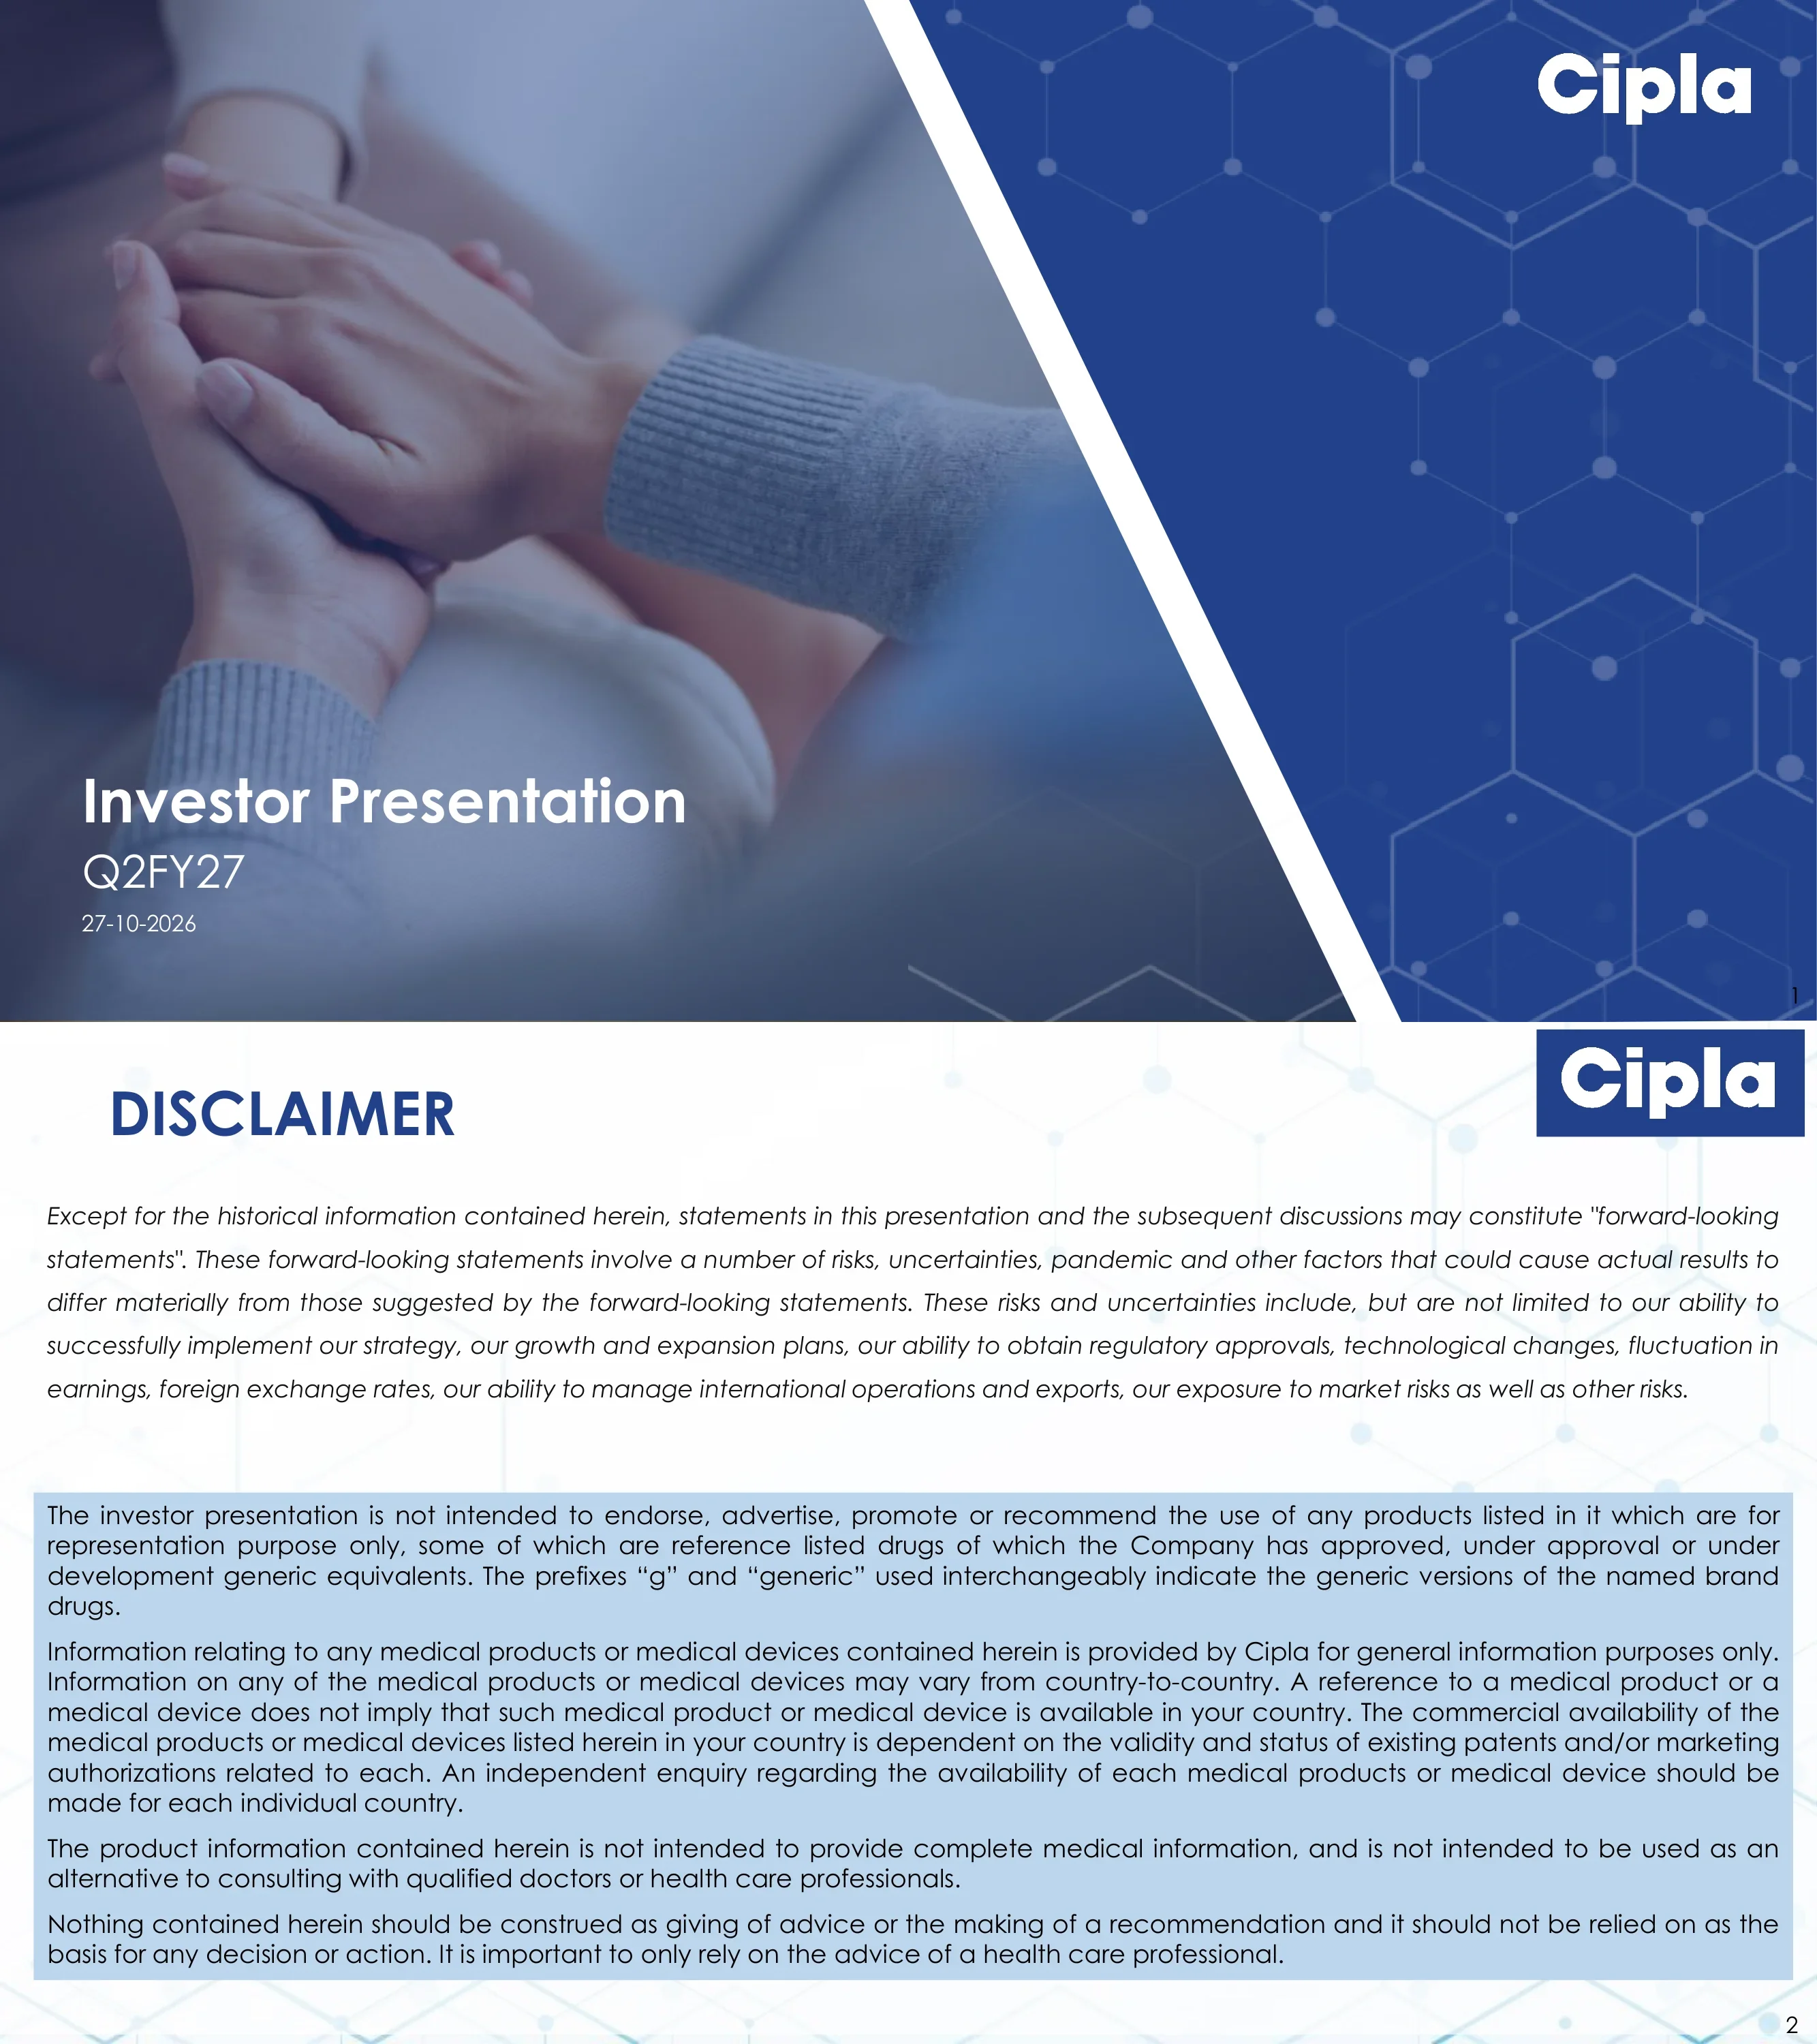
Cover slide titled 'Investor Presentation Q2FY27' dated 27-10-2026, with the Cipla wordmark.
Diagonal split: left two-thirds is a blue-tinted photo of clasped hands with the title, period and date at bottom left; right third is a solid royal-blue panel with a hexagonal molecular-network pattern and the white Cipla logo top right.
Forward-looking statements caution (strategy, regulatory approvals, FX, international operations, market risks) plus a notice that products shown are for representation only, that 'g' denotes generic versions, that product availability varies by country, and that nothing in the deck is medical advice.
Heading top left with Cipla logo box top right; an italic paragraph on a light hexagon background above a light-blue shaded block holding four justified paragraphs.
Q2FY27 headline KPIs: revenue INR 7,404 Cr, EBITDA INR 1,388 Cr (18.7% margin), PAT INR 878 Cr (11.9% margin). Business snapshot: One India INR 3,516 Cr, up 12% YoY (highest-ever quarterly revenue); North America $172 Mn (U.S. FDA approval for gAdvair Diskus); One Africa $123 Mn (SA private growing 1.3x faster than the market per IQVIA MAT Aug'26); Emerging Markets & Europe $101 Mn (resilient amid geopolitical uncertainties).
Two stacked grids: a top row of three KPI tiles (Revenue, EBITDA, PAT) with navy headers and a Q2FY27 row label; a full-width 'Business Performance Snapshot' band; then four segment columns each with a value tile and an italic highlight tile.
Revenue INR 7,404 Cr split One India 48%, North America 22%, One Africa 16%, Emerging Markets and Europe 13%, API and Others 1%. Consolidated comparison Q2FY27 vs Q2FY26: total revenue from operations 7,404 vs 7,589; EBITDA 1,388 vs 1,895; EBITDA % 18.7% vs 25.0%; PAT 878 vs 1,351; PAT % 11.9% vs 17.8%. R&D (opex including depreciation) INR 423 Cr, 5.7% of revenue.
Two-column: left a pie chart of revenue break-up under a 'Revenues INR 7,404 Cr' label; right an 'EBITDA 1,388 Cr' label, a navy-headed comparison table and a rounded R&D callout box.
Highest-ever quarterly revenue of INR 3,516 Cr across Rx, Gx and CHL. Branded Prescription: #2 rank in overall chronic segment, launches of Yurpeak, Duolin Syncrobreathe, Revesmart and Rizontem, double-digit growth in respiratory, cardiac, urology, anti-diabetes and dermatology. Trade Generics: strong double-digit QoQ growth, 3 brands with TTM revenue above INR 100 Cr and 5 brands at INR 50-100 Cr, 18 new launches. Consumer Health: anchor and transitioned brands growing, haircare double-digit growth, Omnigel, Nicotex, Prolyte and Cipladine kept leadership positions.
Navy banner with the record revenue figure across the top, followed by three equal cards, each with a coloured ribbon icon header (purple, coral, blue) and diamond-bullet lists.
Therapy growth (IQVIA YTD Sep'26) with IPM ranks: Respiratory 11% (1st), Urology 11% (2nd), Anti-diabetic 50% (8th), Cardiac 20% (7th), Dermatology 16% (11th). Highlights: largest pharma company by volume in the market; in-house Dytor franchise scaled to over INR 800 Cr; Cipla brand franchises occupy all top 5 respiratory spots. Key market highlights: Foracort is a 1000+ Cr brand and the biggest respiratory brand in IPM; 23 brands in IPM top 300; 36 brands with revenue above INR 100 Cr; 7 therapies with IPM top-5 ranks.
Upper left horizontal bar chart with a separate rank column; upper right a light-blue panel of three statement boxes; a full-width rounded 'Key Market Highlights' band above four pill-headed stat cards in orange, coral, purple and orange.
Four India launches: Respiratory - Revesmart (revefenacin inhalation solution), India's first once-daily nebulized bronchodilator for COPD; Diabetology - Galvus DM (vildagliptin SR + dapagliflozin + metformin SR) for type 2 diabetes; Cardiology - Dytor E FDC (torsemide + eplerenone) for congestive heart failure; Critical Care - Rizontem (aztreonam and avibactam) for complicated UTI, hospital-acquired and ventilator-associated pneumonia, and complicated intra-abdominal infection.
Four equal columns, each with a blue therapy-area header bar, a product brand logo and a centred indication description, with a product-information disclaimer footer.
Bispecific HER2 ADC: exclusive licensing agreement with CTTQ (Sino Biopharmaceutical group) for TQB2102 across India, South Africa and five other emerging markets, a 3-in-1 mechanism ADC targeting HER2-low breast cancer (~50% of breast cancer cases in India). Pembrolizumab biosimilar: exclusive U.S. licensing and supply partnership with Qilu Pharmaceutical for QL2107, a Keytruda biosimilar; Qilu leads development, registration and supply while Cipla commercializes in the U.S., subject to regulatory approval.
Two side-by-side bordered panels separated by a dashed divider; each has a blue title bar, a partner logo lock-up with a handshake icon, and three square-bullet points.
Consumer brands in One India generated INR 427 Cr (Omnigel pain relief, Nicotex smoking cessation, Prolyte hydration, Cipladine skin infection, Cofsils cold and cough); consumer brands in South Africa generated ZAR 463 Mn (Cipla Actin and Asthavent respi OTC, Acurate pain management, Coryx cold and flu, Broncol cold and cough). Figures exclude wellness brands sold through the prescription channel.
Three columns: One India brand grid on the left, central revenue boxes joined by a plus icon, One Africa brand grid on the right; each brand logo sits above a light-blue category tag.
Key Q2FY27 highlights: gProventil ranked No. 1 with 22% total market share in the U.S. albuterol MDI market (IQVIA week ending 25 September 2026), with 50 million+ inhaler units supplied cumulatively; U.S. FDA approval for gAdvair Diskus in all three strengths (100/50, 250/50, 500/50 mcg). Recent U.S. launches: gVentolin, Nintedanib, Dapagliflozin and Liraglutide.
Upper light-blue highlight panel with a hexagon clipboard icon and two bullets; lower 'Recent New Launches' row of four navy labels above product pack shots.
191 approved ANDAs & NDAs (Cipla Ltd 106, PEPFAR 9, Invagen 69, partnered 7) + 44 tentatively approved (Cipla 19, PEPFAR 23, partnered 2) + 46 under approval (Cipla 37, PEPFAR 3, Invagen 4, partnered 2) = 281 total. Footnote: PEPFAR-approved ANDAs can be commercialised in the U.S.
Three stacked bar columns with a colour legend, above an equation row of four stat boxes (191 + 44 + 46 = 281), the total highlighted in pale green.
One Africa revenue in $ Mn: Q2FY26 SA private 80, SA tender 23, North Africa 11, others (SSA & CGA) 21; Q2FY27 SA private 80, SA tender 12, North Africa 10, others 21. IQVIA MAT Aug'26: SA prescription rank 2, 8.9% share, Cipla growth 9.9% vs market 6.0%; SA OTC rank 3, 7.7% share, 0.3% vs 3.3%; SA overall rank 3, 8.5% share, 6.5% vs 5.0%. SA private business revenue ZAR 1,294 Mn, 10 brands above ZAR 100 Mn MAT, most generics brands in top 30 (6), top 50 (11) and top 100 (20), private growth 1.3x the market, 6 new launches.
Top left stacked bar chart; top right rounded highlights panel with a blue header; centred market-segment table; two hexagon-icon stat cards (medal and rocket) at the bottom.
FY2029-30 goals and progress: renewable electricity 80% target, 77% achieved; GHG (Scope 1 & 2) 30% absolute reduction vs FY2023-24, 44% achieved, green MDI propellant pilot ongoing; water neutrality, 2.6x water positive in FY26, next certification Mar'27; zero waste to landfill, CMM certified July'26, India manufacturing certification Mar'27; AMR standard certification for 2 sites by Mar'27; zero fatalities; women in leadership 15.8% vs 20% goal; supplier ESG assessment framework in preparation. Achievements: LEED v4 BD+C Silver for the Kurkumbh D8 site and an EcoVadis 2026 Bronze Medal (top 35%).
Three-column table (Aspects, Goals FY 2029-30, Progress) grouped by Environment, Social and Governance hexagon icons on the left, with an 'Achievement' label and bordered box at the bottom.
INR Cr, Q2FY27 vs Q2FY26: revenue from sale of products 7,368 vs 7,447; other operating income 36 vs 142; income from operations 7,404 vs 7,589; material cost 2,634 vs 2,498; employee benefits 1,475 vs 1,315; other expenses 1,908 vs 1,882; total expenses 6,016 vs 5,695; finance costs 17 vs 13; depreciation, impairment and amortisation 345 vs 297; other income 151 vs 269; profit before tax 1,177 vs 1,854; tax 321 vs 500; share of associate -5; profit for the period 852 vs 1,353; non-controlling interest -26 vs 2; profit attributable to shareholders 878 vs 1,351.
Single full-width financial table with a dark navy header row, bold subtotal rows and an INR Cr unit label top right.
INR Cr, Sep-26 vs Sep-25: equity 35,522 vs 33,025; total debt (incl. lease liabilities) 699 vs 467; inventory 6,778 vs 6,160; cash and cash equivalents (incl. current investments and deposits) 10,522 vs 10,368; trade receivables 6,000 vs 6,902; trade payables 3,266 vs 3,035; net tangible assets 8,266 vs 6,996; goodwill and intangibles 7,107 vs 5,374.
Compact three-column table on the left half of the slide with navy header, white space to the right over the hexagon background, footnotes at bottom.
Closing slide with the registered office address (Cipla House, Peninsula Business Park, Lower Parel, Mumbai 400 013), the investor relations contact and email, and www.cipla.com.
Left half photo of a scientist at a microscope in blue lab light; right panel with Cipla logo box, 'Thank You' banner and a light contact card.
Häufige Fragen zu dieser Folie und dem zugrunde liegenden Präsentationsinhalt.
It is Cipla's 16-page investor presentation for the quarter ended 30 September 2026, dated 27 October 2026. It covers headline KPIs, revenue mix by geography, One India, North America, One Africa and consumer wellness performance, new launches, two oncology licensing deals, the U.S. ANDA/NDA pipeline, ESG progress, and a consolidated P&L and balance sheet.
Revenue from operations was INR 7,404 Cr (vs INR 7,589 Cr in Q2FY26), EBITDA was INR 1,388 Cr at an 18.7% margin (vs 25.0%), and PAT was INR 878 Cr at an 11.9% margin (vs INR 1,351 Cr). One India posted a record INR 3,516 Cr, up 12% YoY.
Cipla filed it with BSE/NSE as its 'Investor Presentation Q2FY27' on 27 October 2026. The exchange cover letter has been removed; the remaining 16 pages are the original deck.
Indian companies use an April-March fiscal year, so FY27 runs from April 2026 to March 2027 and Q2 FY27 is July to September 2026.
Yes. Besides the original PDF, an editable PPTX converted from the PDF is available. It is a machine conversion, not Cipla's original source file, so check fonts and chart objects before reusing slides.
The KPI and segment snapshot grid on page 3, the pie chart plus comparison table on page 4, the therapy ranking bars on page 6, the ANDA pipeline equation layout on page 11 and the ESG goals scorecard on page 13 are strong reusable patterns for any pharma or healthcare earnings deck.
North America revenue was $172 Mn. gProventil ranked No. 1 in the U.S. albuterol MDI market with a 22% share, the FDA approved gAdvair Diskus in all three strengths, and recent launches include gVentolin, Nintedanib, Dapagliflozin and Liraglutide. The pipeline stood at 281 ANDAs and NDAs as of 30 September 2026.
Consolidated figures are in INR crore (Cr) as reported. Regional snapshots for North America, One Africa and Emerging Markets & Europe are in US$ million, and South African consumer and private-market figures are in ZAR million, exactly as shown on the slides.

Create Your Own Slides
Turn your ideas into professional presentations in seconds with 2slides AI.
Referenzieren Sie professionelle Designs, wählen Sie Ihren Stil und generieren Sie Folien mit perfekter Textdarstellung. Angetrieben von Nano Banana—beginnen Sie jetzt mit der Erstellung Ihrer Präsentation.
Ihr KI-Agent für Folien. Sparen Sie Zeit, glänzen Sie schneller mit intelligenter Präsentationserstellung.


© 2026 2slides. Alle Rechte vorbehalten.