
Teil von Investorenpräsentationen als Beispiel · Beispiele für japanische Investorenpräsentationen
Bridgestone Q3 FY2026 Earnings Presentation — A 17-slide Japanese-language deck from Bridgestone Corporation, presented by its CFO on 2026-11-12, covering nine-month (January-September 2026) consolidated results of ¥3,554.3 billion revenue (35,543 in units of ¥100 million, 億円) and ¥445.3 billion adjusted operating profit, an upgraded full-year revenue forecast, segment and product results, the balance sheet and new products. This is a Japanese-language deck whose original was published on TDnet (the Tokyo Stock Exchange's Timely Disclosure network); this page describes it in English.
Nutzt das Titelbild dieser Präsentation als Stilvorlage für Folien aus eigenen Inhalten. Alternativ eine beliebige Seite unten wählen und ihr Layout als Vorlage nehmen.
Schnellnavigation
Tags
Folien teilen
Bridgestone Q3 FY2026 Earnings Presentation — A 17-slide Japanese-language deck from Bridgestone Corporation, presented by its CFO on 2026-11-12, covering nine-month (January-September 2026) consolidated results of ¥3,554.3 billion revenue (35,543 in units of ¥100 million, 億円) and ¥445.3 billion adjusted operating profit, an upgraded full-year revenue forecast, segment and product results, the balance sheet and new products. This is a Japanese-language deck whose original was published on TDnet (the Tokyo Stock Exchange's Timely Disclosure network); this page describes it in English.
Detaillierte Ansicht jeder Folien-Seite, einschließlich Layout, wichtigem Inhalt und visuellen Elementen.
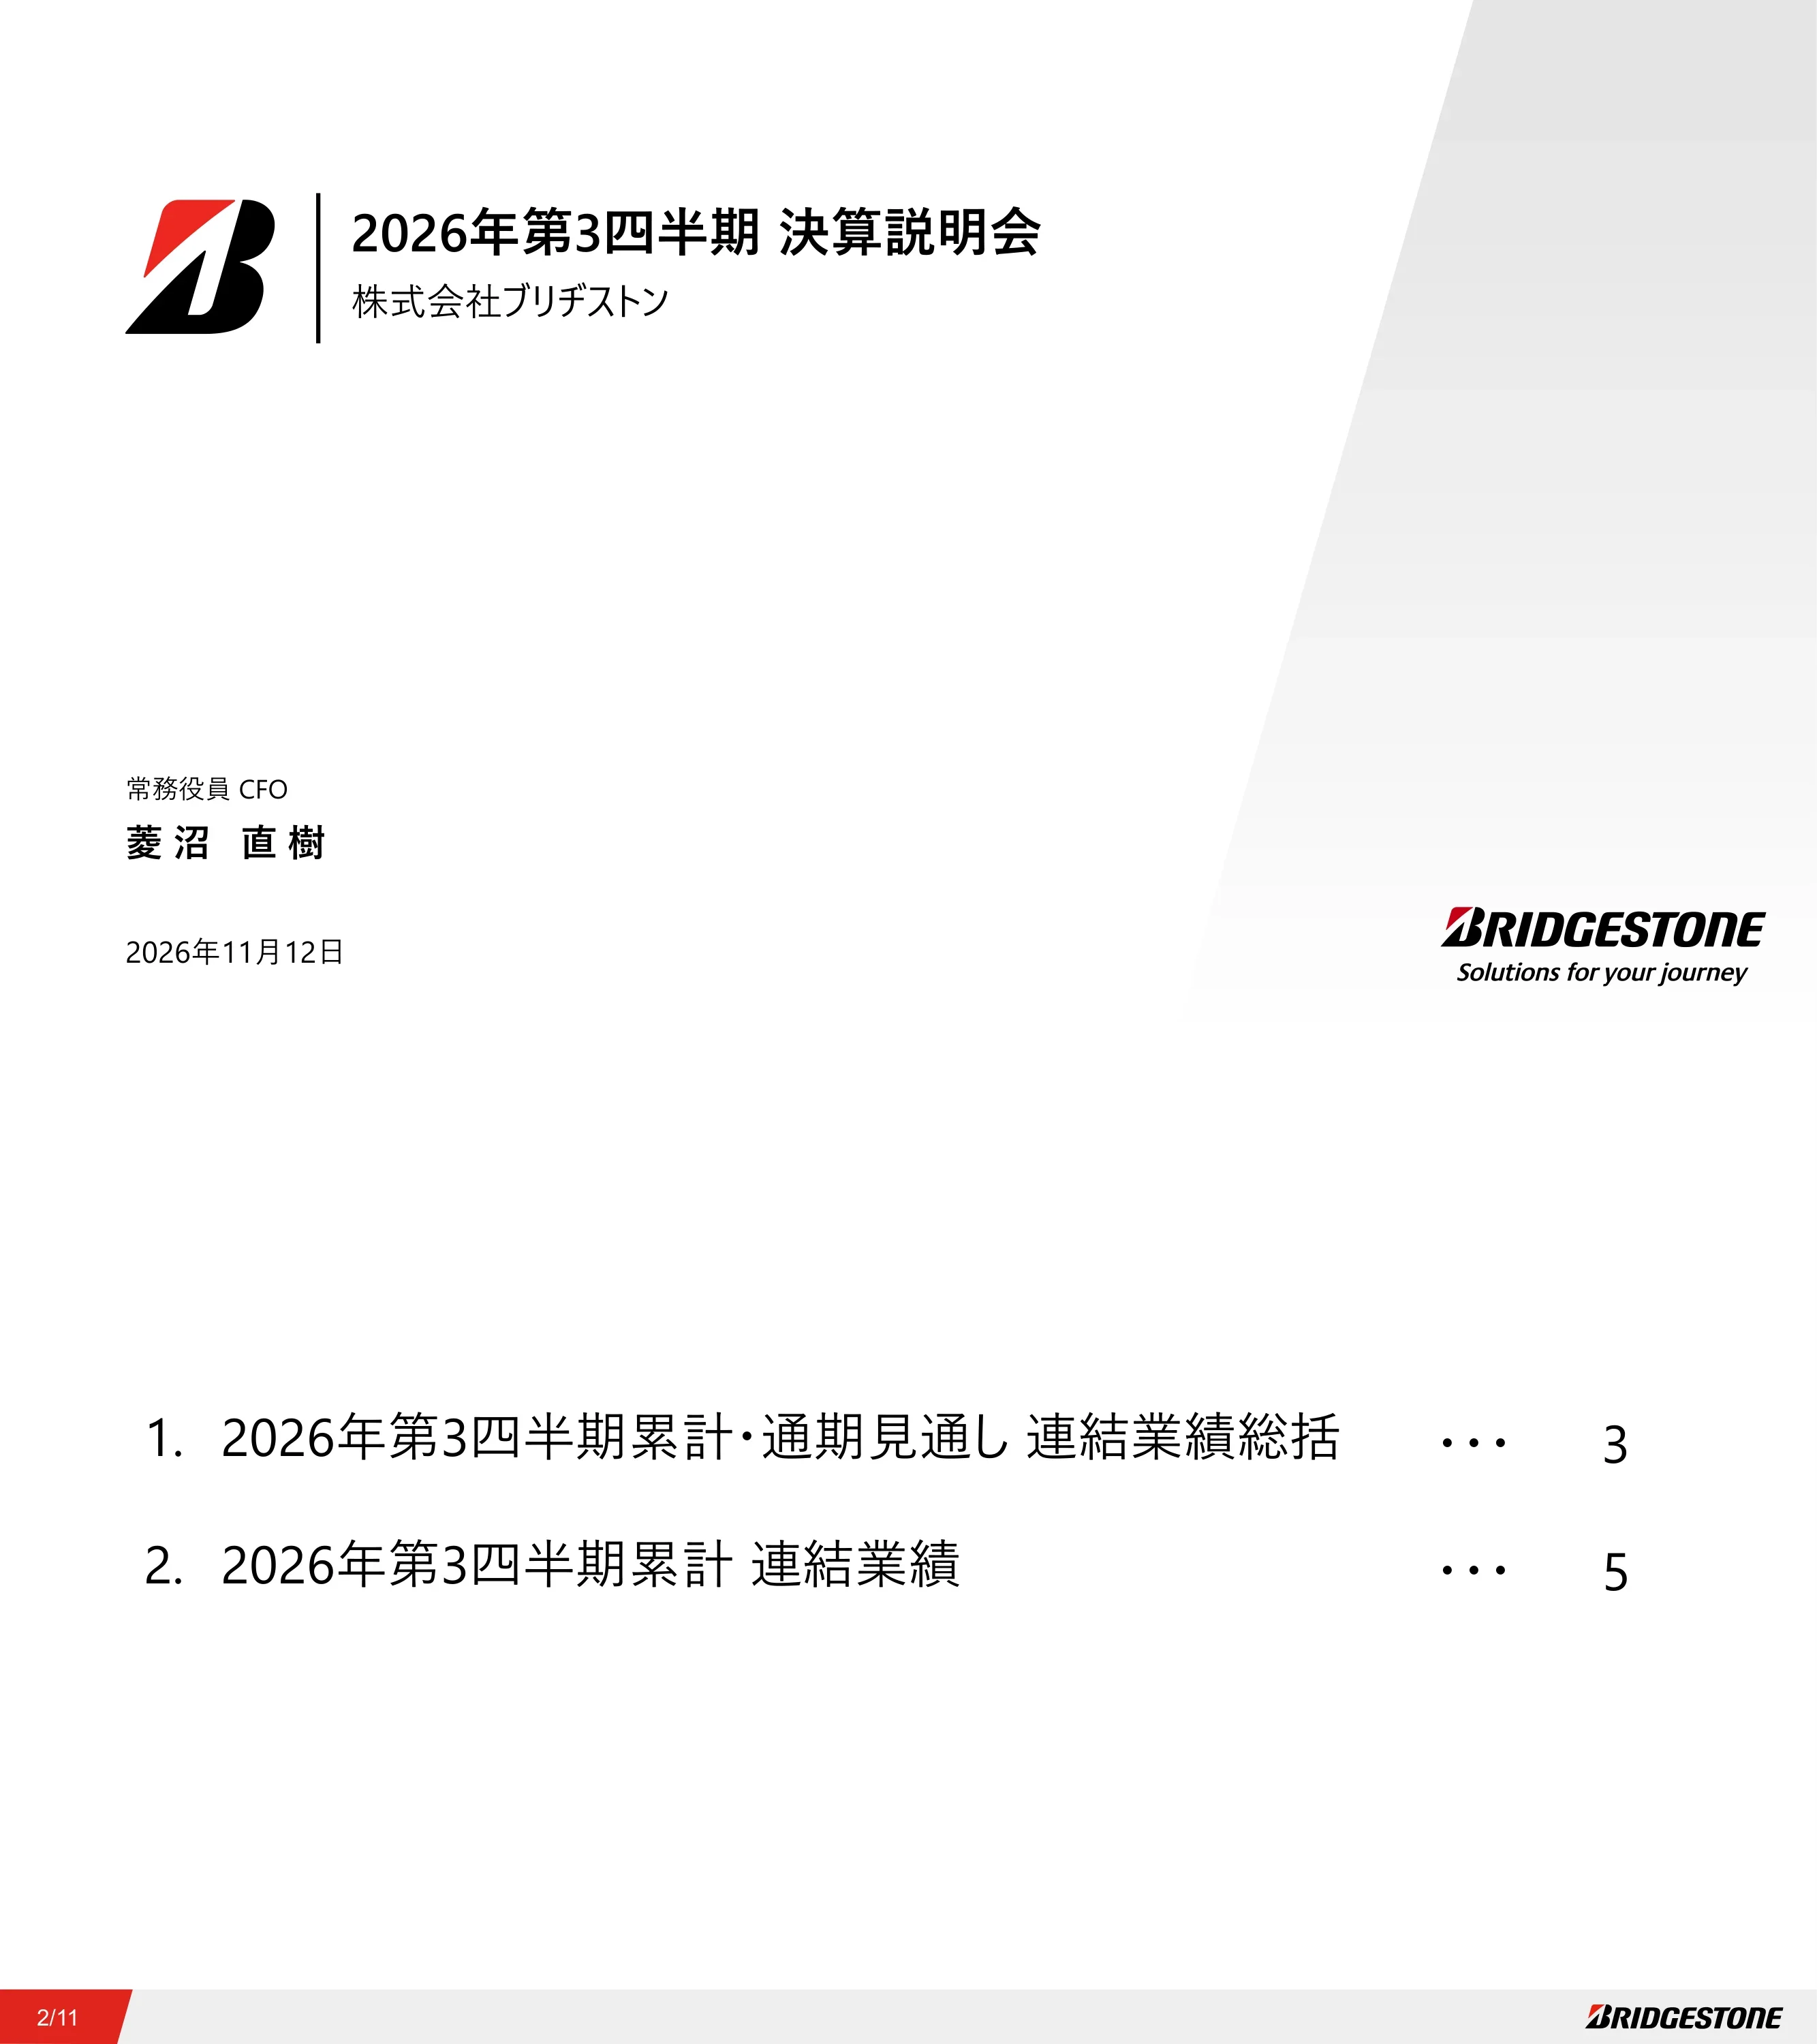
Title slide for the 2026 third-quarter earnings briefing of Bridgestone Corporation, presented by the Managing Executive Officer and CFO. Dated November 12, 2026.
Left-aligned title block with the Bridgestone B logo and a vertical divider, presenter name and date at bottom left, wordmark and tagline at bottom right on a light grey diagonal panel.
Two agenda items: 1. Nine-month 2026 and full-year outlook, consolidated results summary (page 3); 2. Nine-month 2026 consolidated results (page 5).
Numbered list with dotted leaders and page numbers aligned to the right, centered on a white slide.
Section divider introducing the summary of nine-month results and the full-year outlook.
Single centered section title on a white slide with footer bar.
Nine-month results: raw material cost increases became visible from Q3, offset by higher volume and improved pricing/mix; with a weaker yen tailwind, revenue and adjusted operating profit rose to record highs, and the capital policy announced in February was completed as planned. Full-year outlook: only revenue is revised upward, from 45,000 to 47,000 (in ¥100 million units), due to FX assumptions, the Middle East situation and countermeasures; other forecasts are unchanged. The Tosu plant fire impact is still being assessed but is expected to be limited, and the Middle East-related cost increase estimate of about 700 (¥100 million units) per year from August is expected to rise slightly.
Two shaded section headers (nine-month results versus prior year; full-year outlook) each followed by square-bulleted text paragraphs.
Section divider introducing the consolidated results tables and charts.
Single centered section title on a white slide with footer bar.
Revenue was 35,543 (+10%) versus 32,349 a year earlier; adjusted operating profit 4,453 (+21%), a 12.5% margin (+1.1pp); profit attributable to owners of the parent 3,189 (+57%). First-half revenue was 23,217 and Q3 standalone 12,326; Q3 adjusted operating profit was 1,644 (+23%) at a 13.3% margin. Average rates were 159 yen per US dollar (148 prior) and 184 yen per euro (165 prior). Units: ¥100 million (億円). Revenue and adjusted operating profit are continuing operations only.
Financial table with columns for prior-year nine months, first half, Q3 standalone and nine-month 2026 with year-on-year change; the current-period column is highlighted; FX rates in a lower block; footnote at bottom.
Waterfall from 3,684 to 4,453 (+769, or +329 excluding FX; ¥100 million units): raw materials +0, pricing +120, mix +180, volume +230, processing cost +50, SG&A -330, FX +440, other +79. Annotations include raw materials +230 in the first half and -230 in Q3 standalone, a -70 US tariff cost effect within raw materials, production-floor improvement +140 within processing cost, and a -240 US tariff effect within other.
Waterfall chart with grey start and end bars, black positive and red negative floating bars, y-axis 0 to 4,500, callouts with lollipop connectors, and a gray arrow banner summarizing the total change at the bottom.
Japan: revenue 9,655 (+6%), adjusted operating profit 1,716 (+30%), margin 17.8%. Asia-Pacific/India/China: 4,247 (+14%), 503 (+22%), 11.8%. Americas: 17,534 (+11%), 1,582 (+0%), 9.0% (-1.0pp). Europe/Middle East/Africa: 6,827 (+9%), 458 (+38%), 6.7%. Units ¥100 million. A footnote explains that intra-group royalty rate changes reduced Americas by about 86 and EMEA by about 57, offset in eliminations so there is no consolidated impact.
Table with four regional blocks, each with revenue, adjusted operating profit and margin rows for prior year, current year and change, plus commentary bullets on the right and a footnote at the bottom.
PS/LT (including retail and credit card business): revenue 19,990 (+11%), profit 2,343 (+20%), 11.7%. TB (including retread): 8,166 (+9%), 778 (+11%), 9.5%. Specialties (OR/AC/AG/MC): 5,192 (+10%), 1,269 (+30%), 24.4% (+3.9pp). Chemicals and diversified products: 2,195 (+3%), 62 (-2%), 2.8%. Units ¥100 million.
Table with four product blocks, each with a vehicle icon, three metric rows, prior year versus current year, change, and bullet commentary at right.
Tire business (core): revenue 23,696 (+10%), adjusted operating profit 3,474 (+19%), margin 14.7%, 64% of revenue. Solutions business (growth): 11,207 (+9%), 934 (+22%), 8.3%, 30% of revenue; within it, retail services 8,247 (+8%), 533 (+15%), 6.5%, and production-goods BtoB solutions 2,960 (+13%), 401 (+33%), 13.5%. Chemicals and diversified: 2,195, 62, 2.8%, 6%. Global total 35,543, 4,453, 12.5%. Units ¥100 million.
Donut chart in the center showing revenue mix with global totals inside; tire business and chemicals tables on the left; solutions, retail and production-goods tables on the right in a red outlined box; highlights in red text at top right.
Total assets 57,681 (+204 versus year-end), cash 7,227, inventories 9,398, interest-bearing debt 8,871, total equity 37,328, equity ratio 63.8%, cash conversion cycle 171 days. Nine-month operating cash flow 4,872, investing cash flow -1,775, free cash flow 3,097 (+660), capex 2,139, depreciation and amortization 2,774. Capital policy from February: share repurchase of up to 1,500 and 1,500 of debt funding, both completed as planned; the repurchase equals 3.5% of shares outstanding before cancellation. Units ¥100 million.
Left: balance sheet and cash flow table with prior period, current period and change columns. Right: red-headed capital policy panel and a completion box with checkbox items.
Disclaimer stating that forecasts, plans, strategies and targets that are not historical fact are based on information available at the time and involve risks and uncertainties, so actual results may differ materially, and that investment decisions should be made at the reader's own judgment.
Centered Bridgestone logo and tagline with a rounded-corner disclaimer box and copyright line below.
Divider slide introducing the appendix. The page counter reads 13/11 because the appendix continues the numbering beyond the main section.
Left-aligned 'Appendix' heading above a long red horizontal rule on a white slide.
Average prices for 2026 Q1 to Q3: natural rubber TSR20 191, 218, 229 (cents per kg), RSS#3 229, 278, 279, and WTI crude 73, 93, 86 (dollars per barrel), versus 2025 quarters. Nine-month tire demand versus prior year includes PSR/LTR OE/REP of 104%/103% in Japan, 99%/95% in North America and 99%/100% in Europe. Global tire sales versus prior year: PSR/LTR 102%, TBR 101%, PSR/LTR 18-inch and above 106%, and ORR ultra-large 101%, large 90%, small and medium 105%.
Three-part appendix: commodity price table at top left, demand table at top right, and sales tables at bottom for PSR/LTR by region, TBR, large-inch PSR/LTR and ORR, with footnotes.
Chemicals and diversified total: revenue 2,195 (+3%), adjusted operating profit 62 (-2%), margin 2.8%. Chemical products: 1,235 (+4%), 60 (+5%), 4.8%. Sports and cycle: 427 (-3%), -14, margin -3.3%. Americas diversified products (air springs): 504 (+7%), 18 (-6%), 3.6%. Units ¥100 million.
Central donut chart with the combined total inside, chemical products table at left, and sports/cycle and air spring tables stacked at right.
Passenger car tires: 2026 plan of 25 or more new products and 101-105% sales volume; nine-month result 25 products and 103%. Truck and bus tires: plan of 10 or more and 101-105%; result 6 products and 100%. Featured launches include ULTRAWEATHER (June 2026), DESTINATION LE4 (September), POTENZA RE-71RZ (February), BLIZZAK ICEPEAK (September), ECOPIA M759 and R119II (August), W909 (September) and B-FORGED golf irons (September).
Split into passenger car (left) and truck/bus (right) halves; each has a KPI header and product rows grouped by region with tire photos and launch dates in red.
Closing slide repeating the disclaimer on forward-looking statements and the copyright notice of Bridgestone Corporation.
Centered Bridgestone logo and tagline with a rounded-corner disclaimer box and copyright line below.
Häufige Fragen zu dieser Folie und dem zugrunde liegenden Präsentationsinhalt.
It covers the nine months from January to September 2026, with Q3 standalone and first-half figures shown alongside. Bridgestone's fiscal year is the calendar year, ending in December, and the deck is dated November 12, 2026.
The deck is in Japanese (決算説明会資料, earnings briefing materials). The original was published on TDnet, the Tokyo Stock Exchange's Timely Disclosure network. This gallery page describes the slides in English.
Revenue was 35,543 (+10%), adjusted operating profit 4,453 (+21%) at a 12.5% margin, and profit attributable to owners of the parent 3,189 (+57%), all in units of ¥100 million (億円). The deck says revenue and adjusted operating profit were record highs.
The bridge goes from 3,684 to 4,453 (+769, or +329 excluding FX, in ¥100 million units). Contributions: FX +440, volume +230, mix +180, pricing +120, processing cost +50, other +79 and raw materials +0, offset by SG&A of -330.
Only revenue was revised upward, from 45,000 to 47,000 in ¥100 million units. Other forecast items were left unchanged, and the deck notes a tougher environment expected in Q4 from rising raw material costs.
Seventeen slides: title, agenda, a summary section, a results section with consolidated, profit bridge, segment, product, portfolio and balance sheet slides, a disclaimer, and an appendix covering market data, Chemicals and Diversified detail and new products, ending with a repeated disclaimer.
By region, Japan's profit rose 30% to 1,716 at a 17.8% margin, and Europe/Middle East/Africa rose 38% to 458. By product, Specialties had the highest margin at 24.4%, and PS/LT profit rose 20% to 2,343 (¥100 million units).
The February capital policy was completed as planned: a share repurchase of up to 1,500 was executed and cancelled (3.5% of shares before cancellation), and 1,500 of debt funding was completed, in ¥100 million units.

Create Your Own Slides
Turn your ideas into professional presentations in seconds with 2slides AI.
Referenzieren Sie professionelle Designs, wählen Sie Ihren Stil und generieren Sie Folien mit perfekter Textdarstellung. Angetrieben von Nano Banana—beginnen Sie jetzt mit der Erstellung Ihrer Präsentation.
Ihr KI-Agent für Folien. Sparen Sie Zeit, glänzen Sie schneller mit intelligenter Präsentationserstellung.


© 2026 2slides. Alle Rechte vorbehalten.