
所属合集: 投资者演示文稿案例 · 印度上市公司投资者演示文稿范例
Varun Beverages Limited (VBL) Q3 & 9M CY2026 Results Presentation, dated October 30, 2026 and filed with BSE/NSE: the second-largest PepsiCo bottler outside the US reports Q3 CY2026 consolidated sales volume up 28.7% to 354.4 million unit cases, net revenue up 33.2% to Rs. 66,075.6 million (about ₹6,608 crore), EBITDA up 25.1% to Rs. 14,267.1 million and PAT up 13.5% to Rs. 8,305.9 million, alongside the Twizza–BevCo merger, the Kenya launch, a Mondelez distribution deal in Zimbabwe and the new KIVA Spirits subsidiary.
以这份演示文稿的封面作为风格参考,用您自己的内容生成幻灯片。 也可以在下方任选一页,以它的版式作为参考。
快速导航
标签
分享幻灯片
Varun Beverages Limited (VBL) Q3 & 9M CY2026 Results Presentation, dated October 30, 2026 and filed with BSE/NSE: the second-largest PepsiCo bottler outside the US reports Q3 CY2026 consolidated sales volume up 28.7% to 354.4 million unit cases, net revenue up 33.2% to Rs. 66,075.6 million (about ₹6,608 crore), EBITDA up 25.1% to Rs. 14,267.1 million and PAT up 13.5% to Rs. 8,305.9 million, alongside the Twizza–BevCo merger, the Kenya launch, a Mondelez distribution deal in Zimbabwe and the new KIVA Spirits subsidiary.
每张幻灯片页面的详细视图,包括布局、关键内容和视觉元素。
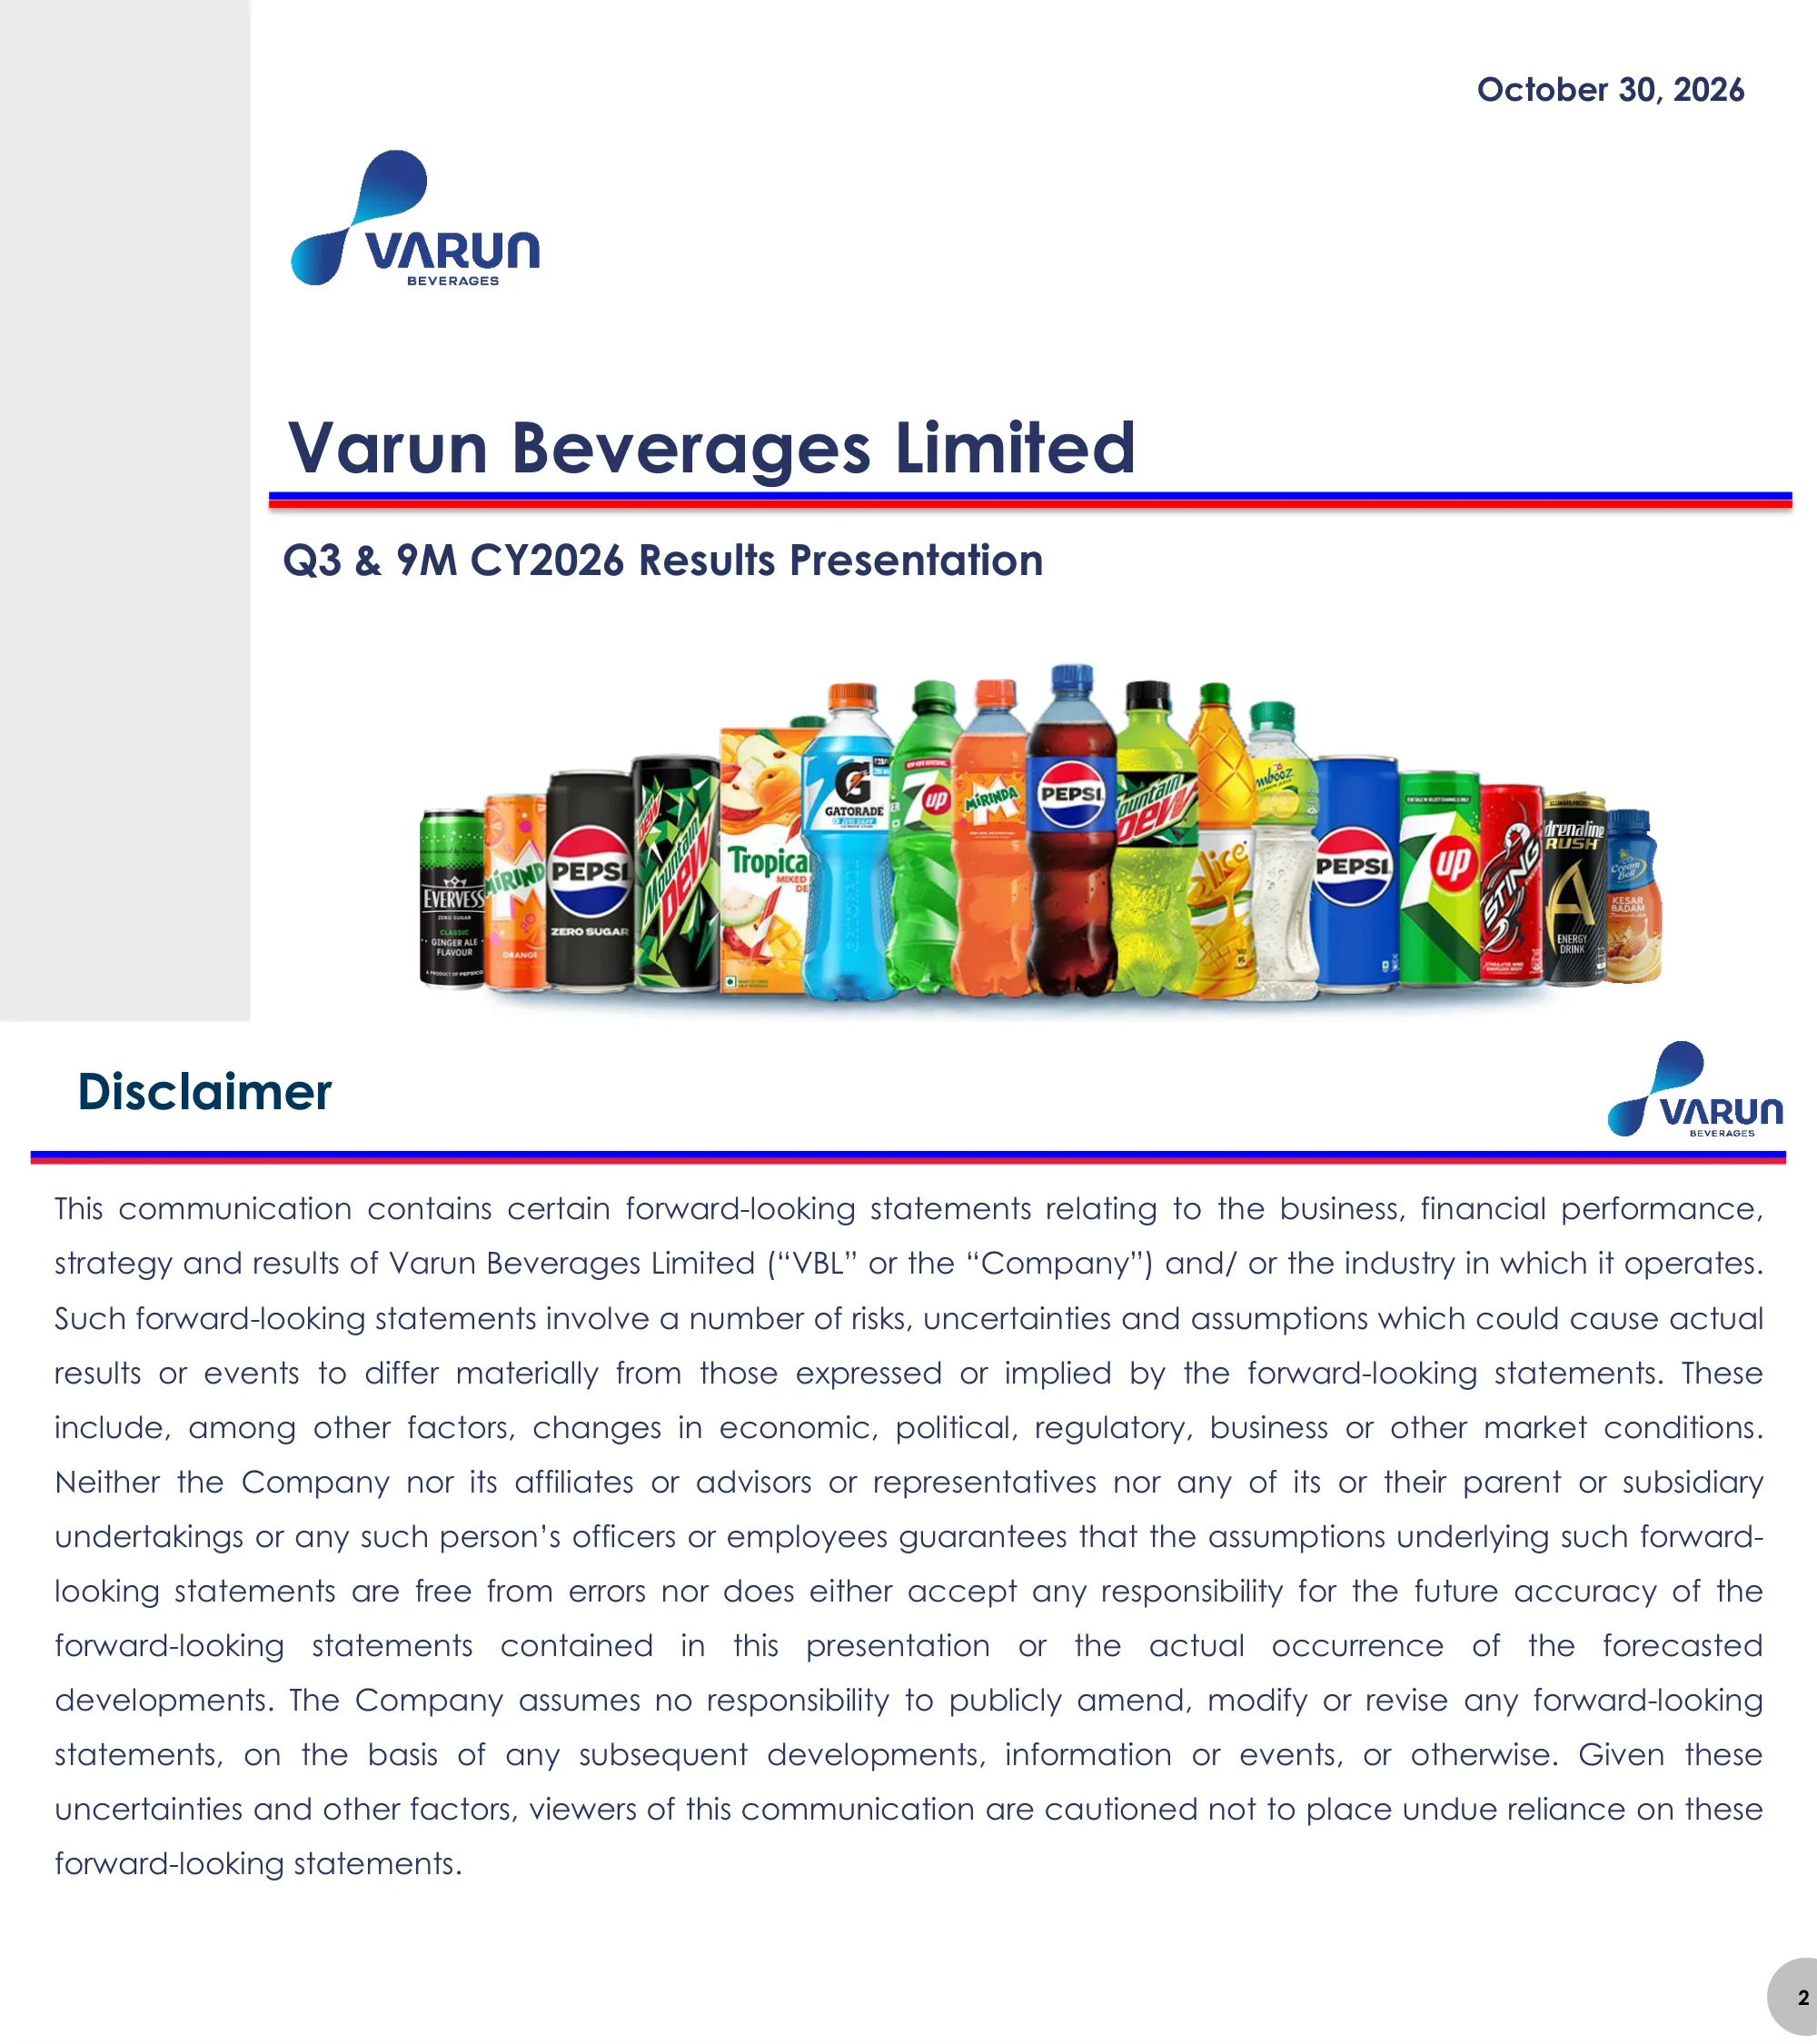
Title slide dated October 30, 2026 with the Varun Beverages logo, the deck title 'Q3 & 9M CY2026 Results Presentation', and a product line-up of PepsiCo and own brands including Evervess, Mirinda, Pepsi Zero Sugar, Mountain Dew, Tropicana, Gatorade, 7UP, Slice, Nimbooz, Sting, Adrenaline Rush and Cream Bell.
Grey left sidebar, logo upper left, date upper right, large title over a blue-and-red double rule, product bottle and can photography across the bottom.
Standard forward-looking statements disclaimer: statements about VBL's business, financial performance, strategy and results involve risks and uncertainties, neither the company nor its affiliates guarantee the underlying assumptions, and viewers are cautioned not to place undue reliance on them.
Single full-width justified text block under the slide title and double rule.
Five sections: Company Overview, Vice-Chairman's Message, Q3 & 9M CY2026 Results Overview, Performance Highlights, and Sustainability Initiatives.
Left half product photo of Pepsi, 7UP, Mirinda and Mountain Dew cans on ice; right half a stacked list of five sections, each with a red circular icon and a red divider with an arrow marker.
VBL is present across 15 countries and is the second-largest PepsiCo franchisee in the world outside the US. Total sales volumes (mn unit cases, India + international) rose from 425 in 2020 (337 + 88) to 569 in 2021, 802 in 2022, 913 in 2023, 1,124 in 2024 (821 + 303) and 1,220 in 2025 (839 + 381), a 2020–2025 CAGR of about 23.5%; 9M CY2026 volume is 1,189 (825 India + 364 international). Maps show India sub-territories plus Nepal and Sri Lanka, and African territories including Morocco, DRC, Kenya, Zambia, Zimbabwe, South Africa, Lesotho and Eswatini, with distribution-only rights in Namibia, Botswana, Mozambique and Madagascar and snacks franchises marked.
Blue headline banner; left panel stacked bar chart; middle panel India map; right panel Africa map with legend for VBL India sub-territories, international territories, distribution-only territories, others' territories and snacks territories.
Brands licensed by PepsiCo: carbonated soft drinks (Pepsi, Mountain Dew, Mirinda, 7UP), club soda (Evervess, Duke's), fruit pulp/juice drinks (Tropicana, Slice, Nimbooz), mixers (Evervess Zero Sugar), energy drinks (Sting, Adrenaline Rush, Rockstar), sports drink (Gatorade), carbonated juice drinks (Nimbooz Jeera Soda, Masala Soda), ice tea (Lipton) and packaged water (Aquafina, Aquavess), plus snacks (Frito-Lay, Cheetos, Doritos, Simba, Kurkure). Own brands: Refreshhh, Co-ee, Jive, Twizza and Xtreme Fizz CSDs, Reboost and Bolt Up energy drinks, Cream Bell dairy beverages, and Refreshhh and Aquaclear water. Footnotes cover snack manufacturing in Morocco and Zimbabwe, distribution in Zambia, Kurkure Puffcorn co-manufacturing in India, territorial limits on own brands, and the licensed CreamBell trademark.
Two-panel brand grid: a large blue-headed 'Brands licensed by PepsiCo' panel with category tiles and an amber-headed 'Own Brands' panel on the right, footnotes along the bottom on a navy background.
VBL handles demand delivery (production facilities, sales and distribution, in-outlet visi-cooler management, BTL consumer push and market share gains) while PepsiCo handles demand creation (trademarks, concentrate formulation, product and packaging R&D, ATL brand development). Centre callouts: 34+ years of association with the India agreement valid till April 2049, and VBL accounts for 90%+ of PepsiCo India sales volume.
Three-column layout: left bullet list under 'Demand Delivery', right bullet list under 'Demand Creation', central blue panel with big-number callouts beneath a yellow handshake banner joining the VBL and PepsiCo logos.
End-to-end execution across the value chain: manufacturing (PepsiCo concentrate, other raw materials, bottling) in 54 production facilities, 38 in India and 16 international; distribution and warehousing with owned vehicles including EVs; customer management through visi-coolers and local promotion; in-market execution by an experienced sales team; cost efficiencies via backward integration (3 exclusive + 19 integrated plants) and packaging innovation; and cash management through working capital efficiency, disciplined capex and territory acquisition. Outcomes: solid infrastructure, robust supply chain, demand delivery, market share gains, margin expansion and ROE expansion/future growth.
Six horizontal rows: white label boxes on the left, navy bullet panels in the middle, yellow pill-shaped outcome badges on the right; a vertical can image with 'VBL – End-to-end execution across value chain' runs down the left edge.
Varun Jaipuria, Executive Vice Chairman, reports Q3 CY2026 consolidated volume growth of 28.7% (India 22.5%, international 39.9%), revenue from operations up 33.2% to Rs. 66,075.6 million and EBITDA up 25.1% to Rs. 14,267.1 million, with higher packaging costs weighing on margins. India growth continued since May on distribution, capacity and chilling investments plus premium launches such as Ad Rush and the Evervess mixers range. Internationally, the Twizza–BevCo merger completed effective 1 August 2026, beverage operations started in Kenya with new brands Bolt Up and Xtreme Fizz, and an exclusive Mondelez distribution agreement was signed in Zimbabwe. KIVA Spirits and Company Limited was incorporated to explore RTD and alcoholic beverages. An interim dividend of 25% of face value (Rs. 0.50 per share, ~Rs. 1,691 million outflow) was approved.
Circular executive portrait on the left with decorative vertical lines; blue header strip naming the speaker; long multi-paragraph quote on the right.
1) KIVA Spirits and Company Limited incorporated on 29 August 2026 as a wholly-owned Indian subsidiary for ready-to-drink, alcoholic beverages and allied products. 2) On 24 September 2026, Varun Beverages (Zimbabwe) signed an exclusive distribution agreement with Mondelez South Africa for chocolate, biscuit, candy and gum products in Zimbabwe, effective 1 October 2026. 3) Bevco and Twizza boards approved merging Twizza into its holding company Bevco on 2 July 2026; the merger was completed effective 1 August 2026. 4) Interim dividend of 25% of face value, Rs. 0.50 per share, total outflow ~Rs. 1,691 million.
Four stacked numbered blocks, each with a blue heading bar and a white bullet box, on a blue gradient background.
Rs. million: revenue 49,607 (Q3 2025) to 66,076 (Q3 2026), +33.2%; 9M 1,76,891 to 2,18,146, +23.3%. EBITDA 11,404 to 14,267, +25.1% (margin 23.0% to 21.6%); 9M 44,008 to 52,746, +19.9% (margin 24.9% to 24.2%). PAT 7,315 to 8,306, +13.5%; 9M 27,721 to 32,023, +15.5%. Quarterly volumes (mn unit cases): Q4 215 to 239 (+11.1%), Q1 314 to 365 (+16.4%), Q2 392 to 469 (+19.7%), Q3 275 to 354 (+28.7%). Q3 2026 mix: CSD 260 (73%), NCB 17 (5%), water 78 (22%) versus Q3 2025 CSD 201, NCB 14, water 60.
Top row of three paired bar charts (revenue, EBITDA with margin labels, PAT) for quarter and nine months with green growth arrows; middle stacked bar chart of quarterly volumes; bottom colour-banded table of category volumes and mix by quarter.
Rs. million, Q3 2026 vs Q3 2025: revenue from operations 68,155.86 vs 51,124.38 (+33.3%); excise duty 2,080.28 vs 1,517.44; net revenues 66,075.58 vs 49,606.94 (+33.2%); other income 1,198.62 vs 1,475.63 (-18.8%); cost of materials 29,096.15 vs 19,374.15 (+50.2%); employee expense 6,025.57 vs 5,642.14; finance costs 716.91 vs 467.09 (+53.5%); depreciation 4,199.82 vs 3,123.57 (+34.5%); other expenses 14,789.19 vs 10,947.97; EBITDA 14,267.09 vs 11,404.08 (+25.1%); PBT 10,526.16 vs 9,272.29 (+13.5%); tax 2,220.24 vs 1,957.19; PAT 8,305.92 vs 7,315.10 (+13.5%). 9M: net revenues 218,145.52 vs 176,891.16 (+23.3%), EBITDA 52,745.84 vs 44,007.96 (+19.9%), PAT 32,022.98 vs 27,721.20 (+15.5%). Footnote: VBL Industries (Kenya) acquired a business from Devyani Food Industries (Kenya) for USD 32 million (Rs. 3,050 million) effective 1 August 2026, accounted as a common-control combination under Appendix C of Ind AS 103 using pooling of interests, so prior periods are restated.
Full-width financial table with blue header row, pink-shaded current-period columns, yellow-highlighted subtotal rows, and a dense italic footnote paragraph.
Consolidated Q3 CY26 vs Q3 CY25 (Rs. million): sales volume 354.4 vs 275.3 mn unit cases (+28.7%); beverage revenue 62,732.1 vs 47,667.9 (+31.6%); non-beverage revenue 3,343.5 vs 1,939.0 (+72.4%); total revenue 66,075.6 vs 49,606.9 (+33.2%); realization per case 177.0 vs 173.1 (+2.2%). Standalone: volume 217.7 vs 177.6 (+22.5%); beverage revenue 37,011.5 vs 30,046.0 (+23.2%); non-beverage 1,213.0 vs 593.8 (+104.3%); total revenue 38,244.5 vs 30,639.8 (+24.8%); realization 170.0 vs 169.1 (+0.5%). Commentary: international volume grew 39.9% and included 15.3 million cases from the Twizza acquisition; India realization rose on high-value categories and premium launches (Ad Rush, Evervess mixers); international realization improved on South Africa pricing and FX; Q3 mix was CSD 73.3%, JBD 4.8% and packaged water 21.9%.
Upper consolidated-versus-standalone comparison table with a blue header; lower dashed-border box titled 'Sales Volumes / Net Revenues' with six bullets, on a blue gradient background.
Gross margin fell 334 bps to 53.1% in Q3 CY2026: packaging cost inflation (preforms, shrink film, closures, cans) linked to geopolitical issues cost about 300 bps, and higher sales of non-beverage products such as preforms and caps in India (up 104%) cost about 100 bps in India. A roughly 16% rise in sugar prices was largely offset as low/no-sugar products rose from 44% to 88% of India mix; low/no-sugar is about 86% of consolidated volumes. EBITDA rose 25.1% to Rs. 14,267.1 million with margin down only 140 bps to 21.6%, and India EBITDA margins were maintained YoY for the nine months. PAT rose 13.5% to Rs. 8,305.9 million; depreciation and finance costs grew 34.5% and 53.5% mainly due to the Twizza acquisition and its debt funding; other income fell 18.8% on stable currencies.
Three stacked dashed-border boxes with blue tab headings (Gross Margins, EBITDA, PAT), each holding bullet commentary on a blue gradient background.
Rs. billion: revenue 65, 88, 132, 160, 200, 220 for 2020–2025 (CAGR 27.8%) and 218 for 9M 2026; EBITDA 12, 17, 28, 36, 47, 50 (CAGR 33.2%) and 53 for 9M 2026, with margins rising from 18.6% to 22.9% and 24.2% for 9M; PAT 4, 7, 16, 21, 26, 30 (CAGR 53.2%) and 32 for 9M 2026, with PAT margin up from 5.5% to 13.7% and 14.7% for 9M; net worth 36, 42, 52, 71, 167, 188 (CAGR 39.3%) and 226 at 9M 2026, with net debt/equity falling from 0.8 to 0.0 in 2024–2025 and 0.1 at 9M 2026.
2x2 grid of chart cards on a blue background: revenue (green), EBITDA (amber, bars plus margin line), PAT (red, bars plus margin line), net worth (blue, bars plus net D/E line), each with a coloured CAGR header and a dashed separator before 9M 2026.
Left: increase groundwater level with 2x water replenishment ratio, 300+ water bodies (ponds and check dams) maintained, and only half of recharged water used for manufacturing. Right: water usage ratio (litres of water per litre of beverage) of 1.89 in 2021, 1.70 in 2022, 1.57 in 2023, 1.56 in 2024 and 1.50 in 2025, a 21% reduction to 2025, against a 2030 target of 1.40; a note explains the 2023–2024 figures reflect stabilisation of new greenfield plants. A badge highlights 150+ process improvements.
Split layout: left column of three illustrated panels (landscape, check dam, drilling rig) under a blue banner with a 2x WRR arrow; right side a row of shrinking water-drop icons with values, a -21% arrow, and a gold seal badge.
CDP Climate rating A- and CDP Supplier Engagement Assessment rating A. Renewable energy from rooftop and captive solar plus windmills: 18 million kWh (7% RE mix) in 2021, 21 (6%) in 2022, 58 (13%) in 2023, 79 (16%) in 2024 and 108 (21%) in 2025, with a 30% target by 2030. Plastic waste recycling rose from 70% in 2021 to 80%, 86%, 88% and 100% in 2025, ahead of EPR regulations. Climate actions: 2,000+ EVs in trade for last-mile delivery, 500K+ plantations since 2020, efficient R290 visi-coolers for all new coolers since 2023, and a net zero by 2050 goal. rPET: Pepsi Zero Sugar and Sting in rPET packaging, about 22,000 MT used in 2025, and a 50% rPET mix target by 2030 through the Indorama JV.
Two halves under rating headlines: left a wind-and-solar illustration with kWh and RE-mix values by year and a 30% target arrow; right a row of growing water bottles labelled with recycling percentages and a 100% arrow; a light-blue footer strip with climate-action icons, a Net Zero 2050 arrow and rPET facts.
Varun Beverages Limited Q3 & 9M CY2026 Earnings Conference Call held Friday, October 30, 2026 at 2:00 PM IST, with primary Indian dial-in numbers and international toll-free numbers for Hong Kong, Singapore, the UK and the USA.
Single rounded-rectangle card with a title line and a two-column label/value list separated by dotted rules.
VBL is described as one of the largest PepsiCo franchisees in the world outside the USA, producing and distributing CSDs and non-carbonated beverages including packaged water under PepsiCo trademarks (Pepsi, Pepsi Zero, Mountain Dew, Sting, Adrenaline Rush, 7UP, Mirinda, Nimbooz Jeera Soda, Evervess, Slice, Tropicana, Gatorade, Aquafina). Associated with PepsiCo since the 1990s, it holds franchises across 26 states and 6 union territories in India, which contributed about 67% of net revenue from operations in fiscal 2025, plus franchises in Nepal, Sri Lanka, Morocco, Zambia, Zimbabwe, South Africa, Lesotho, Eswatini and DRC and distribution rights in Namibia, Botswana, Mozambique and Madagascar. Investor relations contacts at the company and at CDR India are listed with a link to varunbeverages.com.
Two justified text paragraphs, a blue rounded banner pointing to the website, and two columns of IR contact details below.
Closing slide reading 'Thank You!' with no other content.
Mirrors the cover: grey left sidebar and a centred title over the blue-and-red double rule on white.
关于此幻灯片和基础演示文稿内容的常见问题。
For the quarter ended 30 September 2026, consolidated sales volume rose 28.7% to 354.4 million unit cases, net revenue rose 33.2% to Rs. 66,075.6 million (about ₹6,608 crore), EBITDA rose 25.1% to Rs. 14,267.1 million with a 21.6% margin, and PAT rose 13.5% to Rs. 8,305.9 million.
Varun Beverages reports on a calendar year (January to December), unlike most Indian listed companies that use an April–March fiscal year. Q3 CY2026 therefore covers July to September 2026 and 9M CY2026 covers January to September 2026.
It is the results presentation Varun Beverages filed with the Indian stock exchanges BSE and NSE on October 30, 2026, alongside its quarterly results and earnings call. The exchange cover letter has been removed; all 19 slides of the deck are reproduced here.
The deck reports financials in Rs. million (Indian rupees) and, on the multi-year highlights slide, Rs. billion; volumes are in million unit cases, where one unit case is 5.678 litres (24 bottles of about 237 ml). Divide Rs. million by 10 to convert to ₹ crore.
Gross margin declined 334 bps to 53.1%. The deck attributes about 300 bps to higher packaging costs (preforms, shrink film, closures, cans) linked to geopolitical issues and about 100 bps in India to a higher share of low-margin non-beverage sales such as preforms and caps. A roughly 16% rise in sugar prices was largely offset by the shift to low/no-sugar products.
The completed merger of Twizza into Bevco in South Africa effective 1 August 2026, the start of beverage operations in Kenya with new brands Bolt Up and Xtreme Fizz, an exclusive Mondelez distribution agreement in Zimbabwe from 1 October 2026, the incorporation of KIVA Spirits and Company Limited for RTD and alcoholic beverages, and an interim dividend of Rs. 0.50 per share.
Yes. Both the original PDF and a PPTX version converted from it are available. The PPTX is machine-converted, so check fonts, charts and tables before reusing the layouts for your own results presentation.
Yes. It follows a common Indian results-deck structure: company snapshot, brand portfolio, management message, key developments, P&L table, consolidated versus standalone discussion, multi-year highlights and ESG slides, which makes it a practical reference for IR teams and analysts.
Original exchange filing of this presentation, including the cover letter

Create Your Own Slides
Turn your ideas into professional presentations in seconds with 2slides AI.
参考专业设计,选择您的风格,生成具有完美文本渲染的幻灯片。由 Nano Banana 提供支持——立即开始创建您的演示文稿。


