
所属合集: 投资者演示文稿案例 · 日本上市公司投资者演示文稿范例
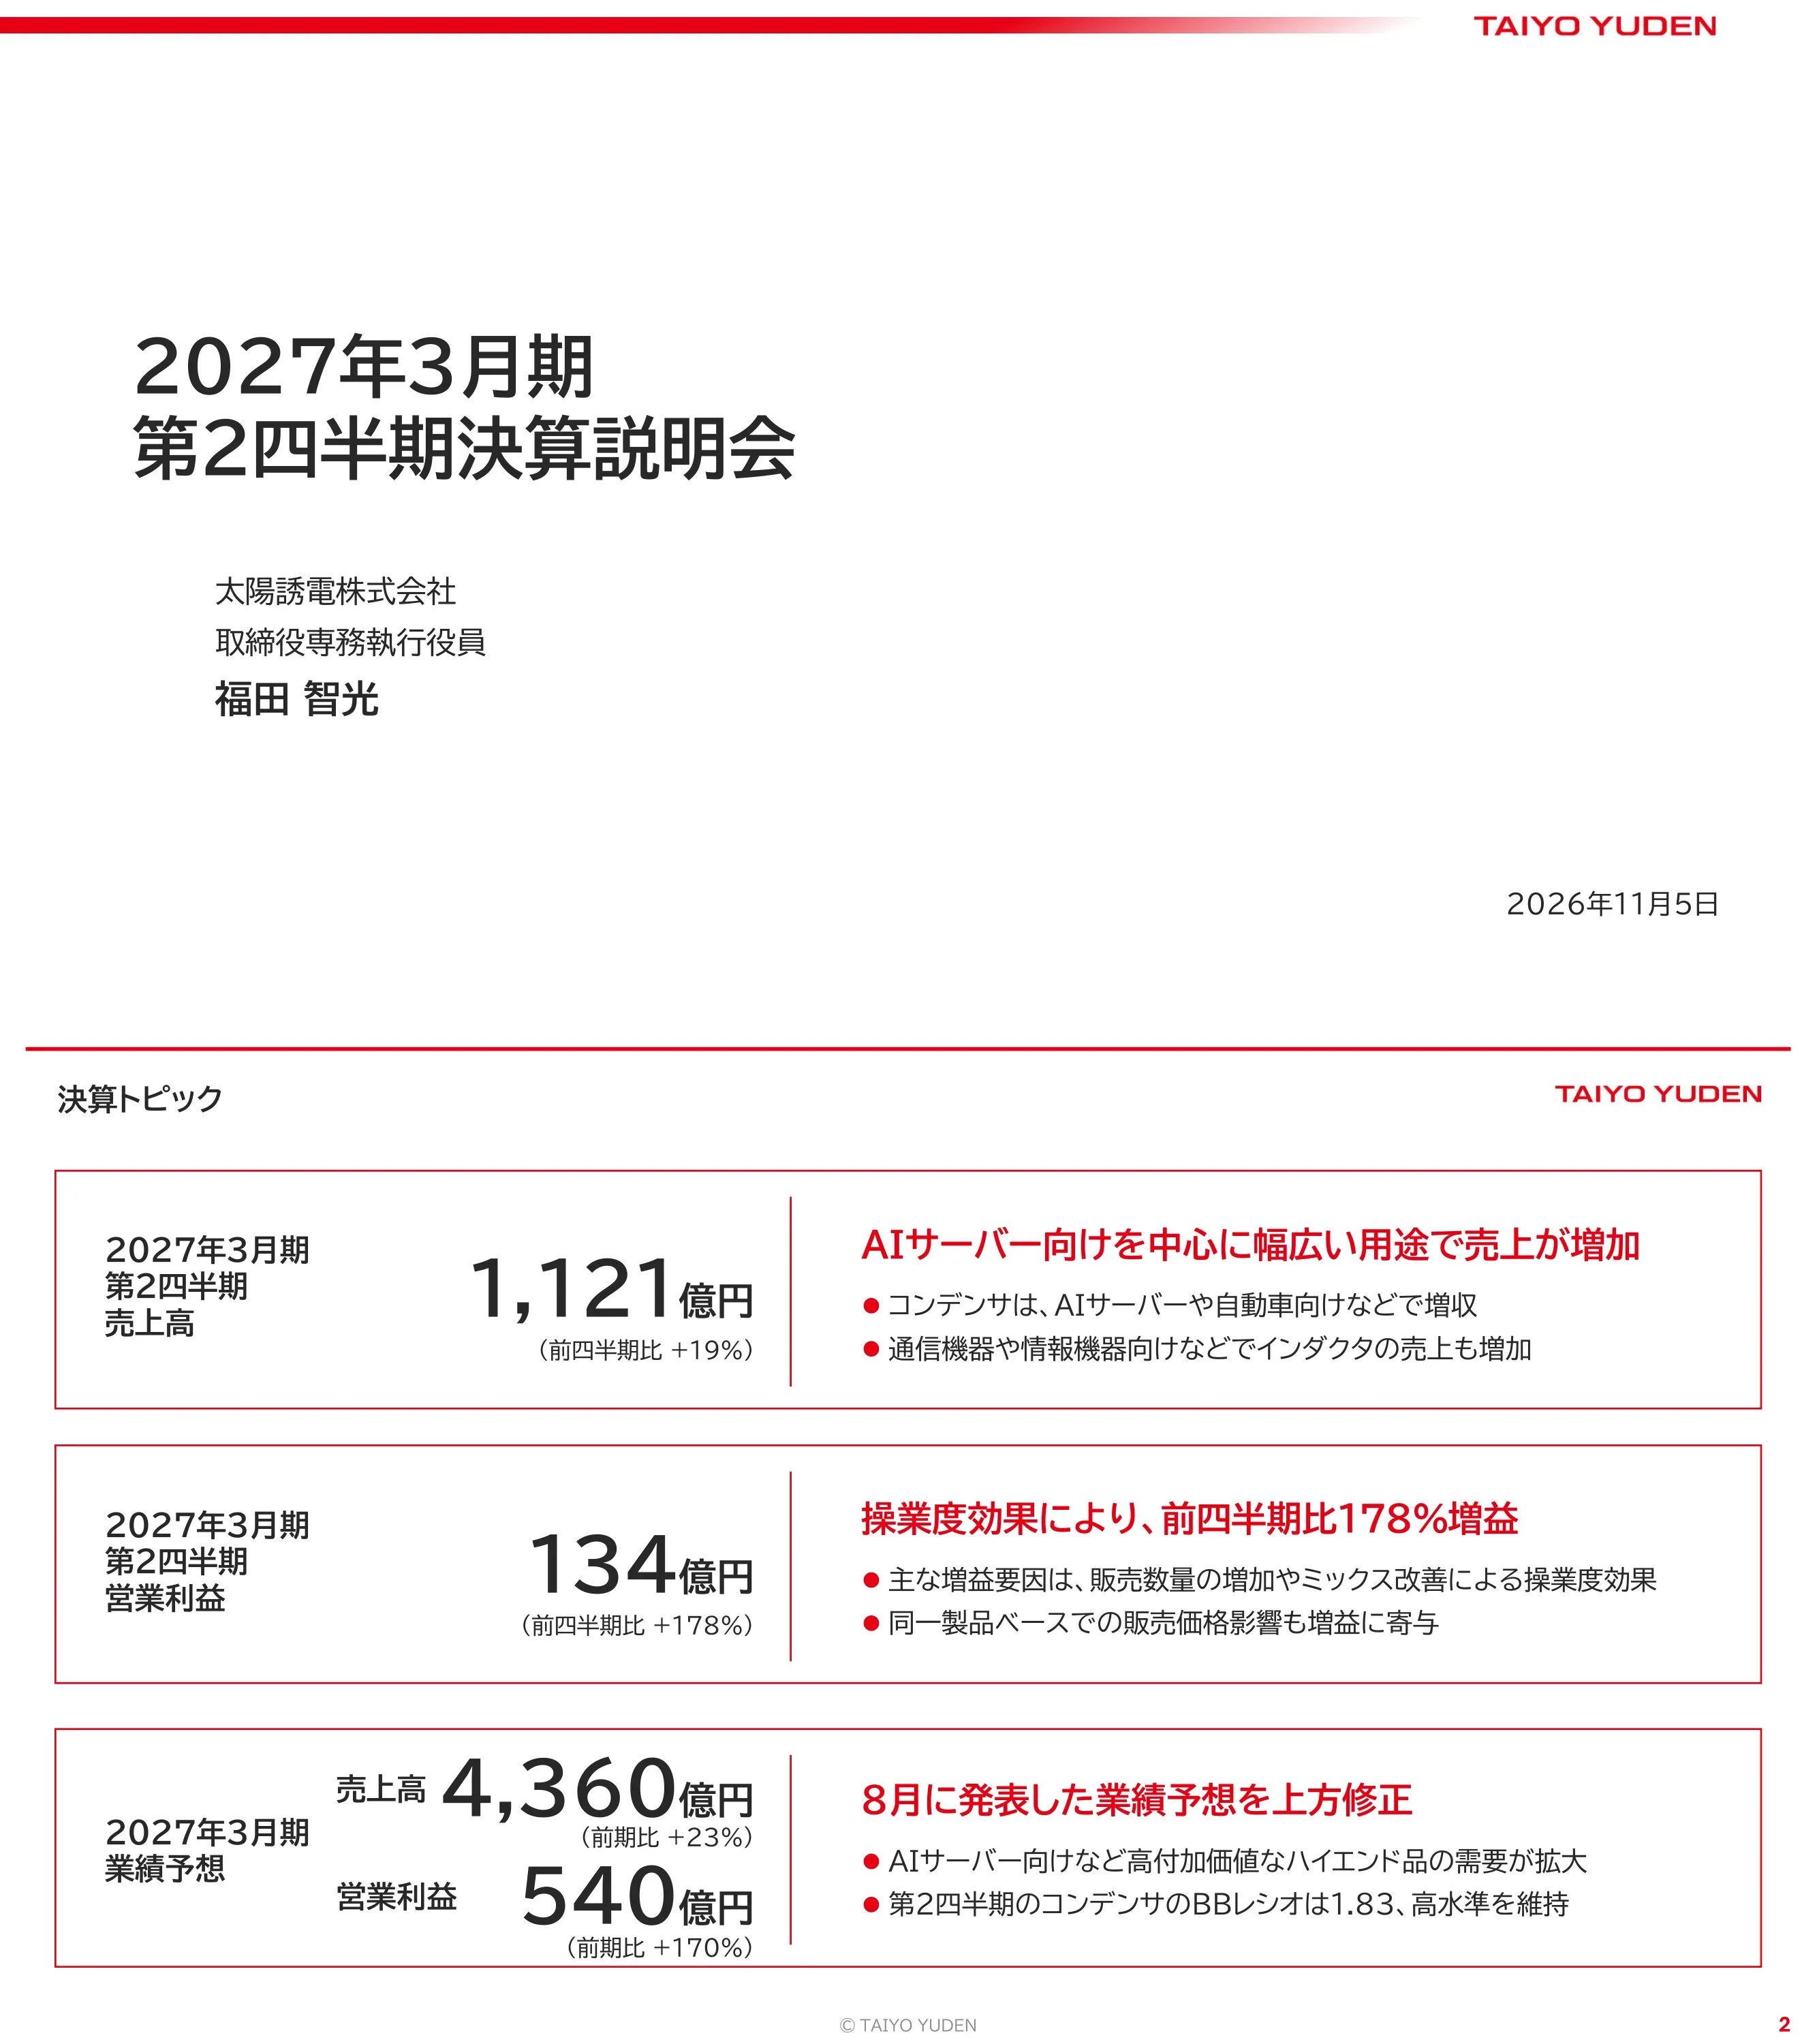
TAIYO YUDEN (TSE 6976) H1 FY2026 earnings presentation (fiscal year ending March 2027, 2027年3月期 第2四半期決算説明会資料): Q2 revenue of ¥112.1 billion (1,121億円, +19% QoQ), operating profit of ¥13.4 billion (134億円, +178% QoQ), and an upgraded full-year forecast of ¥436.0 billion revenue and ¥54.0 billion operating profit, driven by AI-server demand for multilayer ceramic capacitors (MLCC) and inductors. This is a Japanese-language deck originally published on TDnet (Tokyo Stock Exchange Timely Disclosure) on November 5, 2026.
以这份演示文稿的封面作为风格参考,用您自己的内容生成幻灯片。 也可以在下方任选一页,以它的版式作为参考。
快速导航
标签
分享幻灯片
TAIYO YUDEN (TSE 6976) H1 FY2026 earnings presentation (fiscal year ending March 2027, 2027年3月期 第2四半期決算説明会資料): Q2 revenue of ¥112.1 billion (1,121億円, +19% QoQ), operating profit of ¥13.4 billion (134億円, +178% QoQ), and an upgraded full-year forecast of ¥436.0 billion revenue and ¥54.0 billion operating profit, driven by AI-server demand for multilayer ceramic capacitors (MLCC) and inductors. This is a Japanese-language deck originally published on TDnet (Tokyo Stock Exchange Timely Disclosure) on November 5, 2026.
每张幻灯片页面的详细视图,包括布局、关键内容和视觉元素。
Title page for TAIYO YUDEN's second-quarter earnings briefing for the fiscal year ending March 2027, presented by Director and Senior Managing Executive Officer Tomomitsu Fukuda (福田智光), dated November 5, 2026.
White background with a red gradient rule across the top, left-aligned large Japanese title, presenter block beneath, date bottom-right and TAIYO YUDEN wordmark top-right.
Three headline boxes: Q2 revenue 1,121億円 (+19% QoQ) as AI-server and automotive capacitors and communication/IT inductors grew; Q2 operating profit 134億円 (+178% QoQ) from utilization effects of higher volume and better mix plus like-for-like pricing; FY forecast raised from August to revenue 4,360億円 (+23% YoY) and operating profit 540億円 (+170% YoY) on high-end AI-server demand, with Q2 capacitor book-to-bill at 1.83.
Three stacked red-outlined boxes, each split by a vertical rule: big KPI number with yen unit on the left, red headline and two bullets on the right.
Section break introducing the second-quarter consolidated results for the fiscal year ending March 2027.
Centered two-line Japanese title on a white page with the red top rule and corner wordmark.
Table in 百万円 comparing Q2 of the prior year, Q1 and Q2: revenue ¥112,136M (+20.8% YoY, +19.4% QoQ), operating profit ¥13,378M (+127.5% YoY, +177.7% QoQ), operating margin 11.9%, ordinary profit ¥11,642M, net income attributable to owners ¥5,631M (-12.2% YoY, +124.8% QoQ), USD/JPY 160.71, R&D ¥3,365M, capex ¥6,333M, depreciation ¥12,072M. FX added 87億円 to revenue and 51億円 to operating profit YoY.
Two dash bullets on top, followed by a full-width financial table with the current quarter column highlighted by a red frame and YoY/QoQ change columns on the right.
Two waterfall charts in 億円. YoY: 59 → price -33, utilization +74, cost reduction +7, fixed costs -24 (incl. depreciation +7), FX +51 → 134. QoQ: 48 → price +10, utilization +103, cost reduction +3, fixed costs -40, FX +9 → 134. Like-for-like pricing turned into a positive factor QoQ; inventories fell 12億円 from the prior quarter end on an underlying basis.
Two horizontal waterfall charts stacked vertically, each labeled YoY or QoQ on the left, with red start/end bars, orange positive and grey negative steps, and a footnote top-right.
Product revenue table in 百万円: capacitors ¥83,314M (+26.4% YoY, +20.7% QoQ) growing in every application led by AI servers and automotive; inductors ¥18,820M (+13.0% YoY, +18.1% QoQ) strong in smartphones and memory modules; other ¥10,002M (-2.4% YoY, +11.9% QoQ) on aluminum electrolytic capacitors and communication devices.
Three dash bullets above a four-row table (total, capacitors, inductors, other) with the current quarter boxed in red and change columns at right.
100% stacked bars for Q1 FY ending March 2026 through Q2 FY ending March 2027. In the latest quarter: information infrastructure and industrial equipment 28%, automotive 28%, communication equipment 18%, IT equipment 18%, consumer 8%. Every application grew QoQ; AI-server capacitors drove infrastructure; the two focus areas together reached 56%.
Dash bullets on top, 100% stacked column chart on the left with eight quarter slots (six filled), legend on the right listing each application with example end products.
Stacked bars in 億円 for orders and backlog by product. Q2 orders: capacitors 1,524, inductors 279, other 105; backlog: capacitors 1,818, inductors 224, other 106. Capacitor orders rose 28% QoQ and backlog 61%. Book-to-bill climbed from 0.95 to 1.70 company-wide and to 1.83 for capacitors, the fourth straight quarter above 1.0, led by AI servers and memory modules.
Two side-by-side stacked column charts (orders left, backlog right) with a book-to-bill ratio table under the left chart and a product legend bottom-right.
Section break introducing the full-year consolidated forecast for the fiscal year ending March 2027.
Centered two-line Japanese title on a white page.
Three themes. Demand: higher-performance AI-server chips increase the count and specs of MLCCs and power inductors; memory-module orders are strong. Sales: in H2, AI-server high-value inductors join capacitors and mix improves; like-for-like prices are expected to rise versus H1 as tight supply eases price pressure and prices are revised for raw-material-hit and low-margin items. Capex under Medium-term Management Plan 2030: the original investment plan is pulled forward by two years, and AI-server capacitor capacity will more than double next fiscal year.
Three headed text sections (Demand, Sales, Capex) each separated by a thin red underline, with bullet points beneath.
Forecast table in 百万円 comparing last year's actual, the August forecast and the new forecast: revenue ¥436,000M (+22.7% YoY, +¥12,000M vs prior forecast), operating profit ¥54,000M (+170.0%, +20.0% vs prior), margin 12.4%, ordinary profit ¥50,000M, net income ¥35,000M, assumed USD/JPY 157.88; R&D ¥15,000M, capex ¥42,000M and depreciation ¥50,000M unchanged. A 1-yen move vs the dollar shifts annual revenue by 19億円 and operating profit by 9億円.
Dash bullets above a forecast table with the new forecast column framed in red and change-vs-last-year and change-vs-prior-forecast columns.
Waterfalls in 億円. Versus last year: 200 → price -73, utilization +430, cost reduction +35, fixed costs -123 (incl. depreciation +11), FX +71 → 540. Versus the prior forecast: 450 → price +57, utilization +64, cost reduction 0, fixed costs -15, FX -16 → 540. Price erosion on like-for-like products is expected to ease further; year-end inventory to fall 10億円.
Two stacked waterfall charts (YoY and vs previous forecast) with the same color logic as the quarterly bridge and a footnote top-right.
Product forecast in 百万円: capacitors ¥324,500M (+28.9% YoY, +¥8,000M vs prior), inductors ¥74,500M (+15.8%, +¥3,000M), other ¥37,000M (-5.7%, +¥1,000M). Upgrades center on infrastructure/industrial and IT equipment; shipments of new AI-server inductors started ahead of schedule, with faster growth expected next year.
Two dash bullets over a four-row product table with the new forecast column framed in red.
Q3 guidance as a percentage change from Q2 actuals: total revenue ±0% to +4% from ¥112,136M, capacitors +1% to +5%, inductors +1% to +5%, other -12% to -8%, assumed USD/JPY 156.00 vs 160.71. December-end inventory is expected to be roughly flat with September-end.
Dash bullets above a narrow centered table pairing Q2 actuals with a red-framed Q3 range column, plus an FX row.
Divider marking the start of the appendix with shareholder returns and historical financial data.
Single centered English word on white with the red top rule.
Policy targets a 30% payout ratio and 3.5% DOE. The FY dividend forecast is kept at 90 yen per share, a 34.5% payout ratio and 3.7% DOE. History table: dividends of 80 yen in FY ending March 2022 and 90 yen each year since, with payout ratios ranging from 18.5% to 482.1%, DOE 3.7%–3.8%, and a 50億円 buyback only in FY ending March 2022.
Dash bullets, a centered red-outlined callout with the 90-yen dividend, and a six-year history table with the forecast year framed in red.
First-half table in 百万円: revenue ¥206,034M (+16.0% YoY), operating profit ¥18,196M (+101.6%), operating margin 8.8% (+3.7pt), ordinary profit ¥15,906M (+96.2%), interim net income attributable to owners ¥8,135M (+46.8%), USD/JPY 159.76, R&D ¥6,766M, capex ¥13,417M (-31.5%), depreciation ¥23,986M.
Full-width table with prior-year H1, current H1 framed in red, and YoY change columns.
Waterfall in 億円 from H1 last year to H1 this year: 90 → price -82, utilization +111, cost reduction +12, fixed costs -26 (incl. depreciation +10), FX +75 → 182.
Single full-width waterfall chart with red start/end bars, orange positive and grey negative steps.
First-half product revenue in 百万円: capacitors ¥152,336M (+20.8% YoY), inductors ¥34,754M (+10.4%), other ¥18,943M (-5.4%), total ¥206,034M (+16.0%).
Four-row product table with prior-year H1, current H1 framed in red, and YoY change and rate columns.
Annual P&L in 百万円 from FY ending March 2022 to FY ending March 2026: revenue from ¥349,636M to ¥355,341M with product splits, gross margin falling from 35.7% to 20.3% then recovering to 23.1%, operating profit from ¥68,218M to a low of ¥9,079M and back to ¥19,996M, net income ¥14,806M in the latest year, plus ROE 4.5%, ROA 4.1%, ROIC 3.0% and average FX rates.
Dense multi-row table with five annual columns, YoY rows indented under each line item.
Ten quarters from Q1 FY ending March 2025 to Q2 FY ending March 2027 in 百万円, with YoY and QoQ rates: revenue climbing from ¥81,138M to ¥112,136M, capacitors from ¥55,192M to ¥83,314M, gross margin reaching 27.6% and operating margin 11.9% in the latest quarter, quarterly net income and average USD/JPY.
Very dense table grouped by fiscal year headers with ten quarterly columns and alternating y/y and q/q rows.
Balance sheet from March 2022 to September 2026 in 百万円: total assets ¥633,672M, cash ¥113,986M, inventories ¥127,698M, interest-bearing debt cut to ¥135,218M from ¥171,213M, net assets ¥383,247M, equity ratio 60.5%, net cash -¥21,231M, D/E 0.35. Cash flow: H1 free cash flow ¥20,159M from operating CF ¥31,989M and investing CF -¥11,829M.
Two stacked tables: balance sheet items with six period-end columns on top, cash flow lines with six period columns below.
Japanese-language cautionary note that plans, forecasts and strategies are based on currently available information, carry no guarantee of accuracy or realization, and that results may differ materially given the volatility of the electronics market.
Centered block of Japanese body text with generous line spacing.
Closing slide showing only the TAIYO YUDEN wordmark.
Centered red logotype on a white page under the red top rule.
关于此幻灯片和基础演示文稿内容的常见问题。
The slides are in Japanese. This is TAIYO YUDEN's 決算説明会資料 (earnings briefing material) for the second quarter of the fiscal year ending March 2027, originally released on November 5, 2026 via TDnet, the Tokyo Stock Exchange's Timely Disclosure network. The summaries and analysis on this page are in English.
TAIYO YUDEN's fiscal year runs from April to March and is named by the month it ends. FY2026 here means April 2026 to March 2027, which the company labels 2027年3月期 (fiscal year ending March 2027). H1 covers April to September 2026, and Q2 covers July to September 2026.
Q2 revenue was 1,121億円 (¥112,136 million), up 19.4% QoQ and 20.8% YoY. Operating profit was 134億円 (¥13,378 million), up 177.7% QoQ, for an 11.9% operating margin. Net income attributable to owners was ¥5,631 million.
Revenue was raised from ¥424,000 million to ¥436,000 million (+22.7% YoY), and operating profit from ¥45,000 million to ¥54,000 million (+170% YoY). Net income attributable to owners is now expected at ¥35,000 million. The dividend forecast stays at 90 yen per share.
億円 means ¥100 million, so 1,121億円 is about ¥112.1 billion. 百万円 means ¥1 million and is the unit used in most tables. Negative values are marked with △ in the Japanese style.
More powerful AI-server semiconductors need more multilayer ceramic capacitors and power inductors, each with higher specifications. Capacitor book-to-bill reached 1.83 in Q2, and backlog rose 61% QoQ. TAIYO YUDEN pulled its capex plan forward by two years and plans to more than double AI-server capacitor capacity next fiscal year.
Yes. The gallery offers the original PDF and an editable PPTX. The KPI highlight boxes, red-framed comparison tables, profit waterfalls and book-to-bill charts all work well as a template for a quarterly results briefing. The content and data remain the property of TAIYO YUDEN.

Create Your Own Slides
Turn your ideas into professional presentations in seconds with 2slides AI.
参考专业设计,选择您的风格,生成具有完美文本渲染的幻灯片。由 Nano Banana 提供支持——立即开始创建您的演示文稿。


