
所属合集: 投资者演示文稿案例 · 澳大利亚上市公司投资者演示文稿范例
Soul Patts Credit Webinar Presentation November 2026 — a 17-page investor presentation from Washington H. Soul Pattinson (ASX: SOL), presented by Todd Barlow (MD & CEO) and Dean Price (MD, Principal Investments) on 9 November 2026 and lodged with the ASX. It explains why the investment house lends from its own balance sheet, how the credit book is sourced, structured and governed, and where growth is targeted. Amounts are in Australian dollars (A$, shown as $m/$b in the deck) unless marked US$: credit NAV of $1.9b across 38 positions (13% of the total portfolio), a 14.3% p.a. IRR since inception, $3.7b deployed and $2.0b repaid with zero realised capital losses, and $1.5bn of global credit partnership commitments of which $854m is undrawn.
以这份演示文稿的封面作为风格参考,用您自己的内容生成幻灯片。 也可以在下方任选一页,以它的版式作为参考。
快速导航
标签
分享幻灯片
Soul Patts Credit Webinar Presentation November 2026 — a 17-page investor presentation from Washington H. Soul Pattinson (ASX: SOL), presented by Todd Barlow (MD & CEO) and Dean Price (MD, Principal Investments) on 9 November 2026 and lodged with the ASX. It explains why the investment house lends from its own balance sheet, how the credit book is sourced, structured and governed, and where growth is targeted. Amounts are in Australian dollars (A$, shown as $m/$b in the deck) unless marked US$: credit NAV of $1.9b across 38 positions (13% of the total portfolio), a 14.3% p.a. IRR since inception, $3.7b deployed and $2.0b repaid with zero realised capital losses, and $1.5bn of global credit partnership commitments of which $854m is undrawn.
每张幻灯片页面的详细视图,包括布局、关键内容和视觉元素。
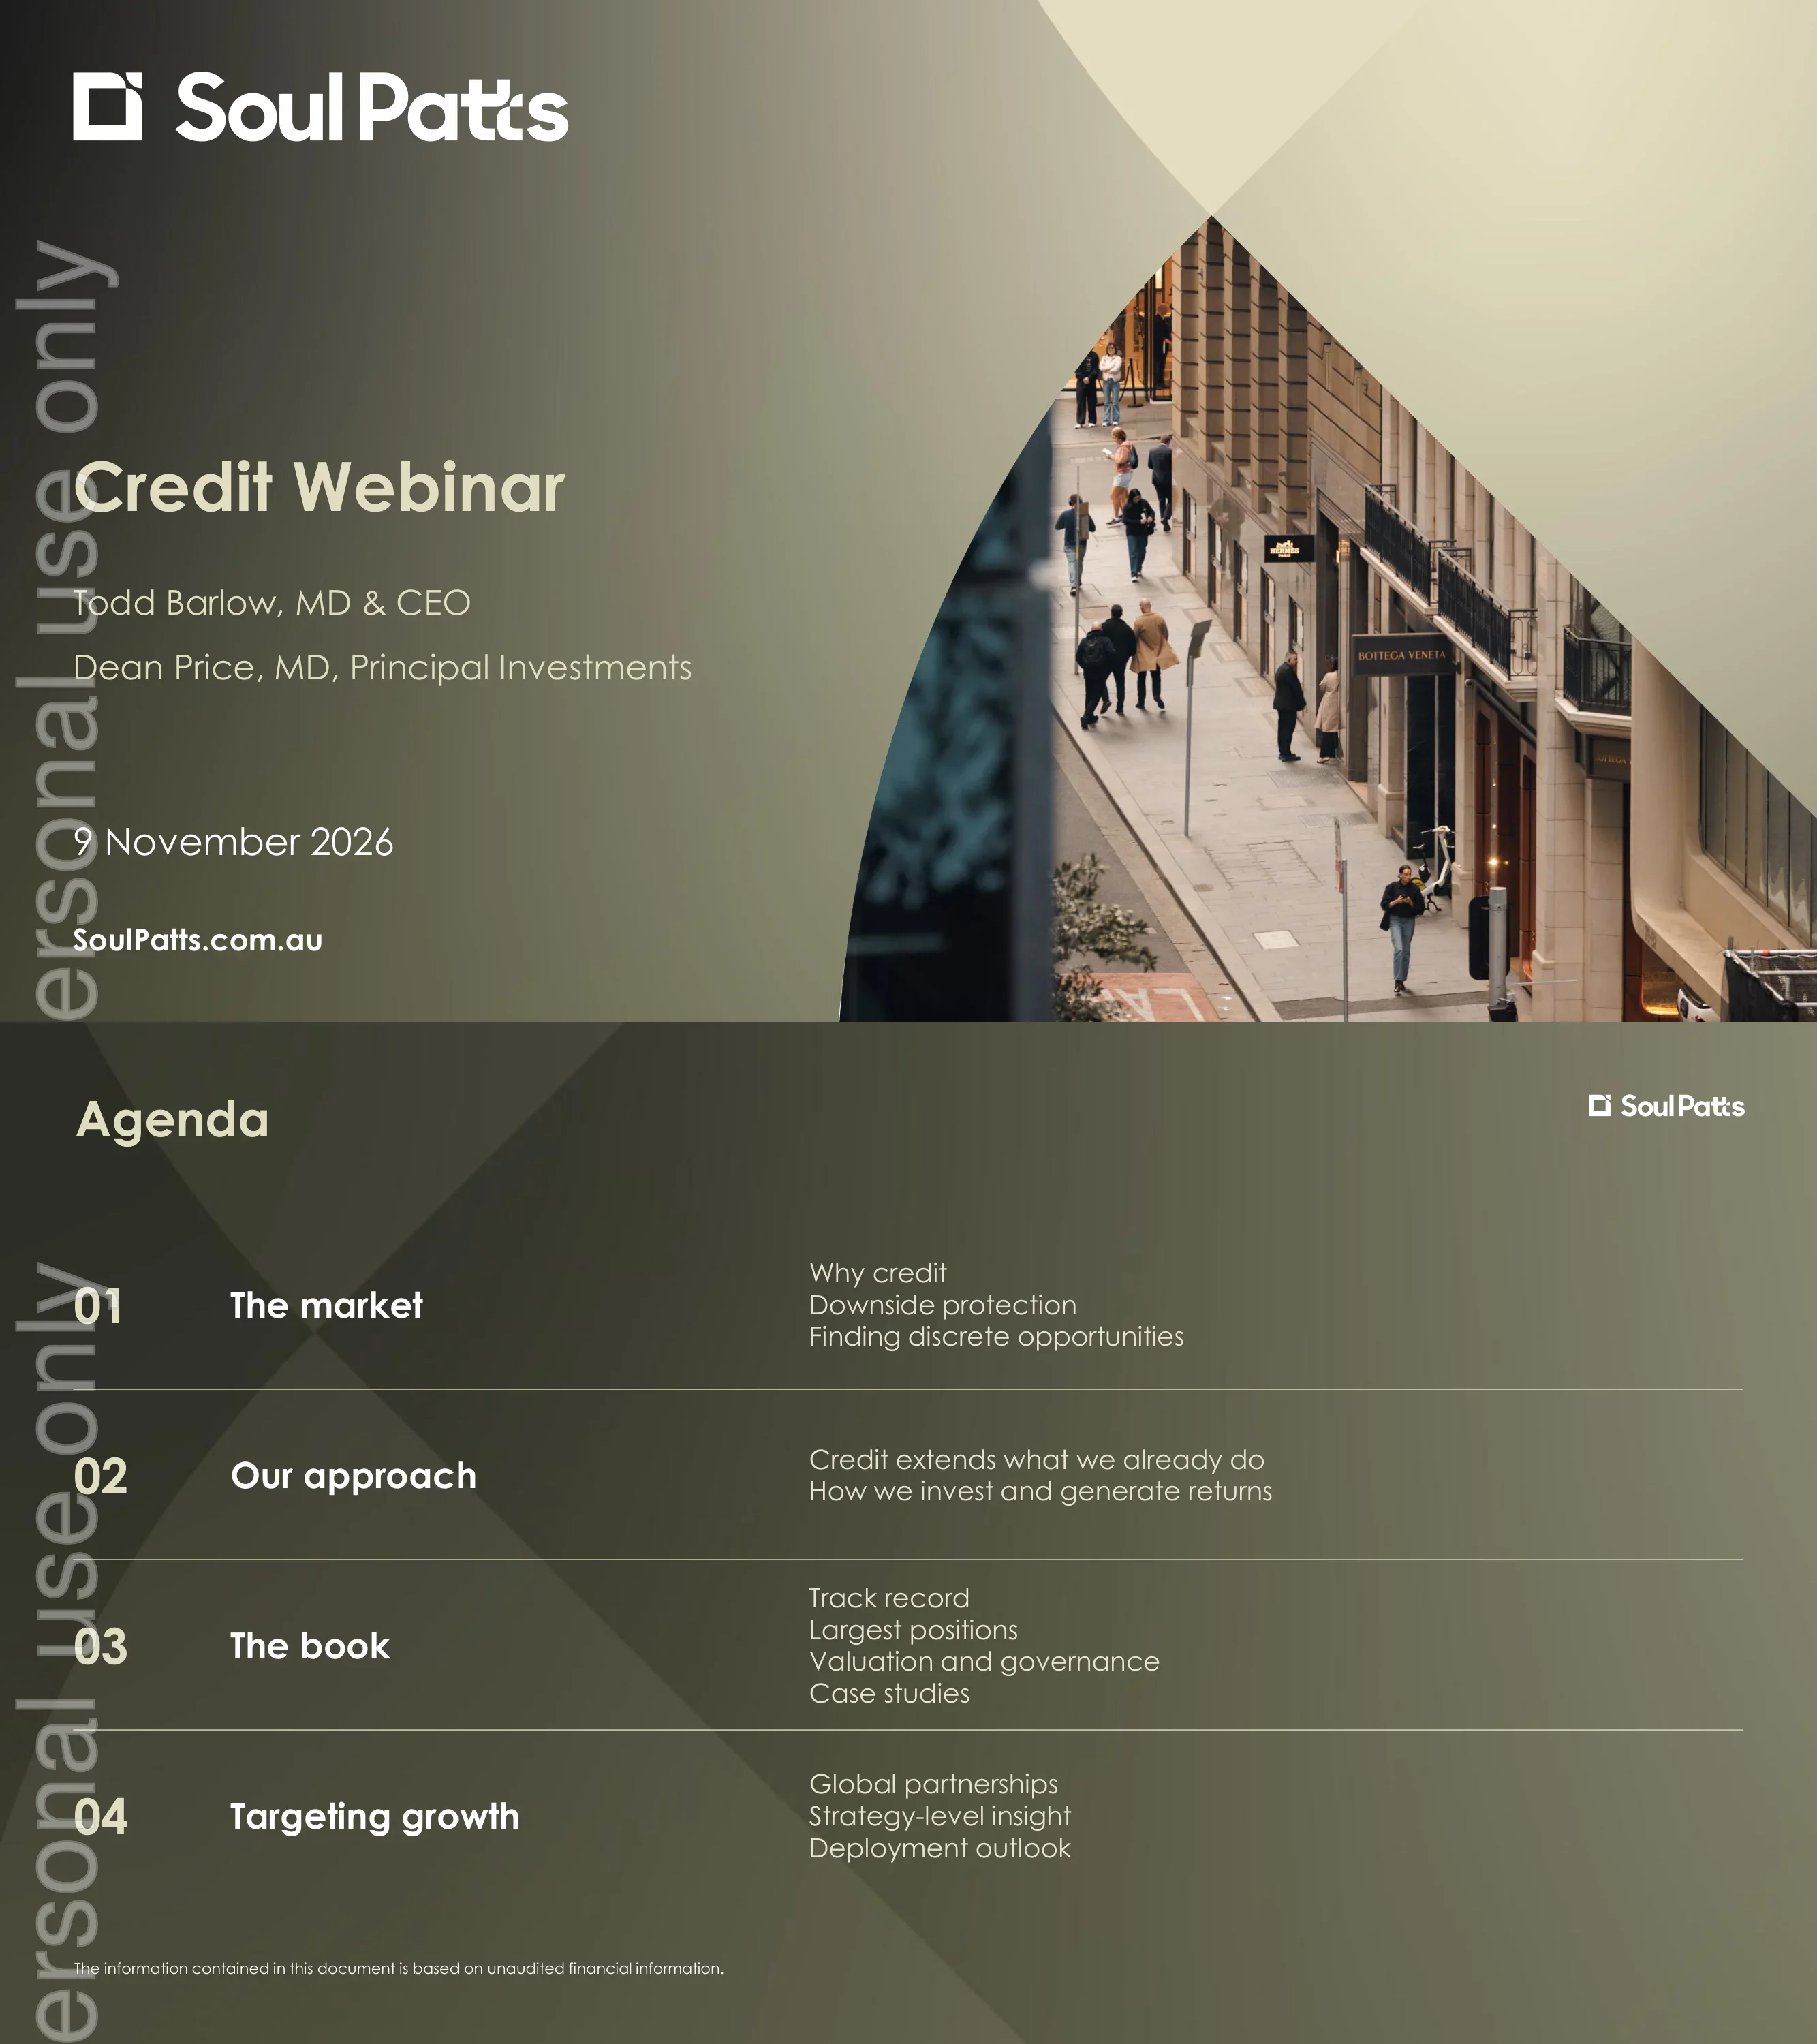
Title slide for the Soul Patts Credit Webinar, presented by Todd Barlow (MD & CEO) and Dean Price (MD, Principal Investments) on 9 November 2026.
Left half dark olive-to-sand gradient with logo, title, presenter names and date; right half a curved-mask photograph of a city street.
Four sections: 01 The market (why credit, downside protection, discrete opportunities), 02 Our approach, 03 The book (track record, largest positions, valuation and governance, case studies) and 04 Targeting growth (global partnerships, strategy insight, deployment outlook). A footnote states the information is based on unaudited financial information.
Four horizontal rows separated by thin rules, each with a large number, a section title and a sub-topic list on the right.
A risk/return staircase runs from cash/treasuries through credit, hybrid capital and equities to private companies, positioning credit as contractual yield paid first. Soul Patts lends from its own balance sheet (loans and bonds, senior and junior, direct and via fund partnerships), and owners' equity is its margin of safety.
Left two-thirds a stepped bar diagram on returns vs risk axes; right column two text blocks headed 'What credit is at Soul Patts' and 'Why it is downside protected'.
In 2009, US speculative-grade credit saw 9.9% defaults x 37% loss given default = 3.7% loss of capital, so the GFC cost senior lenders less than $4 per $100 lent. Soul Patts holds a 4.5% ECL provision against its loan book (at 31 July 2026), more than the worst single-year loan loss of the past three decades.
Left: illustrative capital-stack column from senior secured down to owners' equity with callouts; right: equation of three tiles (multiply/equals) and a highlighted 4.5% ECL callout, with S&P source footnotes.
Australian private credit is ~A$200bn growing ~13.1% a year and North America ~US$2tn growing 13.15% a year, but ~50% of Australian private credit is real estate and >70% of US deals are leveraged finance, which Soul Patts avoids. It prefers bilateral, relationship-driven deals and declined more than 80 deals in FY26 on return or structuring.
Inverted funnel in three tiers (large market, scale products to avoid, discrete opportunities) with Australia on the left and North America/US on the right; source footnotes below.
Credit uses the same lens as equities, lends Soul Patts' own capital (the Milton merger provided the balance sheet; no fund structure, redemptions or pressure to deploy) and solves what banks cannot. Every position runs through sourcing, due diligence (S&P-methodology credit scoring), structuring, approval (Specialist Advisory Committee, Investment Committee, Board) and portfolio management.
Left column three short pillars; right white panel with a five-step vertical process in graded green blocks, each with a one-line description.
Returns come from sourcing ($635m of $1.1b FY26 new origination directly negotiated), structuring (~$86m of structuring and origination fee income since inception) and realising ($1.2b repaid in FY26 against FY25 NAV of $1.8b). The team has delivered a 14.3% IRR p.a. from 30 September 2021 to 30 September 2026.
Three equal cards (Source, Structure, Realise) with icon, headline, description and a large stat; a centred bold summary line below.
Credit NAV is $1.9b across 38 positions, 13% of the total portfolio (30 September 2026), with 23 loans and bonds repaid in full and no capital losses. Since inception: 14.3% IRR p.a., $3.7b deployed and $2.0b repaid; annual deployment rose from $0.12bn in FY22 to $1.10bn in FY26, with $1.21bn repaid in FY26.
Left: NAV callout box and a three-row KPI table; right: clustered column chart of capital deployed vs repaid by year from FY22 to Sep-26 YTD.
The direct book is 74% senior secured (13% weighted IRR to maturity, 2.8 years), 19% junior secured (14%, 4.4 years) and 7% unsecured/structured equity (18%, 3.3 years). IRRs are projected to maturity at 30 September 2026, weighted by carrying value.
Full-width table with black header row; columns for security, % of book, IRR, years to maturity and bullet-point risk assessment.
An Expected Credit Loss provision of 4.5% is held against the book and capital losses realised since inception are zero; most direct positions are held at amortised cost less ECL. The provision is set by the investment team (market and country factors, debtor rating review) and challenged through external review, Board reporting and external audit; the team is 8 investment professionals averaging more than 13 years' experience.
Left: two oversized stats (4.5%, Zero) and three bullets; right: five stacked bars showing how the provision is set, colour-coded team-set vs independent challenge.
EOS: a $70 million bilateral loan to an ASX-listed defence and space company where Soul Patts has held equity since 2017, repaid early in late 2025, followed by a new $100 million facility in March 2026; Soul Patts remains its largest shareholder (~8%). Aeris Resources: a $40 million secured loan for zinc-mine closure costs after a seismic event, extended with a $60 million bank guarantee, with the loan repaid after an Aeris equity raise.
Two side-by-side case cards, each with a coloured title block, hero photo and a three-row timeline (The loan / How it originated / Outcome).
Star Entertainment: a ~$200 million term loan within a $400 million syndicated facility, built from a $50 million participation in 2023 and refinanced and repaid in full in May 2026 at a 23% IRR. Retailer: a revolving loan secured over receivables financing a global TV and online shopping retailer's exit from bankruptcy, co-invested with a global credit partner, with a projected IRR of 13%+ to maturity.
Mirror of the previous slide: two case cards with title block, photo and loan/origination/outcome rows.
Total offshore commitments are $1.5bn across 19 positions, with $854m undrawn and NAV of $641m (September 2026); Soul Patts mapped more than 1,000 credit managers and reviewed over 50 in depth. Offshore income can carry franking from a $1.0 billion franking balance, so a net 10% offshore return is roughly equivalent to a 14% pre-tax domestic opportunity.
Left: three stacked 100% columns showing committed capital by investment size, strategy and industry; right: three headline stats and a 'Why offshore' bullet list.
Fifteen partners cover seven strategies: opportunistic credit (10–15% historical return range, 29% of offshore commitments), asset-backed lending (8–13%, 21%), special situations (15–20%, 20%), structured equity (10–15%, 13%), CLO equity (12–15%, 10%), convertible arbitrage (10–15%, 5%) and reinsurance (10–12%, 3%).
Full-width four-column table (strategy, description, indicative historical return range, % of offshore commitments) under a black rounded header.
Credit NAV grew from $0.25bn in FY22 to $1.8bn in FY25 and $1.9bn at September 2026, and illustratively reaches $2.2bn, $2.5bn and $2.6bn in FY27–FY29 as the $854m of undrawn offshore commitments is called over 1–3 years (assuming 40/30/20% drawdowns, with domestic NAV held flat). Domestic origination is constrained by the supply of quality Australian opportunities, so offshore is where growth is targeted.
Column chart with reported NAV (grey), current NAV (navy) and projected stacked bars (dark green base plus lime drawdown), split by a dashed divider; four bullets on the right.
Section slide opening the question-and-answer session of the webinar.
Same template as the cover: gradient left panel with 'Q&A' and logo; curved photo of the Soul Patts office reception on the right.
Legal notice from Washington H. Soul Pattinson ('WHSP') stating that the financial information is unaudited, that forward-looking statements carry uncertainty, and that the document is not an offer or investment advice.
Dense small-type paragraphs of disclaimer text on a dark gradient background, with logo at top and URL at bottom.
关于此幻灯片和基础演示文稿内容的常见问题。
It is a 17-page investor presentation by Washington H. Soul Pattinson (ASX: SOL), presented by Todd Barlow and Dean Price on 9 November 2026 and lodged with the ASX. It covers why Soul Patts invests in credit, how it originates and governs loans, its track record and case studies, and its plans to grow offshore credit partnerships.
The deck reports a 14.3% IRR p.a. from 30 September 2021 to 30 September 2026, with $3.7b deployed, $2.0b repaid and 23 loans and bonds repaid in full with no capital losses. Amounts are in Australian dollars. Projected IRRs to maturity on the direct book are 13% for senior secured, 14% for junior secured and 18% for unsecured/structured equity.
Credit NAV was $1.9b across 38 positions at 30 September 2026, representing 13% of Soul Patts' total portfolio. Offshore partnership commitments total $1.5bn across 19 positions, of which $854m is undrawn and $641m is NAV.
The book is 74% senior secured and relies on owners' equity absorbing losses first. Soul Patts holds a 4.5% Expected Credit Loss provision, which it notes exceeds the 3.7% US speculative-grade loss of capital in 2009. The provision is set by the investment team and independently reviewed, reported to the Board and tested by the external auditor.
Four: EOS (a $70 million bilateral loan repaid early, then a new $100 million facility), Aeris Resources (a $40 million secured loan plus a $60 million bank guarantee), Star Entertainment (a ~$200 million term loan repaid in May 2026 at a 23% IRR) and an unnamed global TV and online shopping retailer (bankruptcy-exit financing projected at 13%+ IRR).
The deck says domestic origination is limited by the supply of quality Australian opportunities and that local markets are concentrated in real estate (~50%) and US markets in leveraged finance (>70%). Offshore partnerships across seven strategies add depth, and franking from a $1.0 billion franking balance makes a net 10% offshore return roughly equivalent to a 14% pre-tax domestic return.
Soul Patts' financial year ends on 31 July, not on the more common Australian 30 June, so FY26 is the year to 31 July 2026. The deck's ECL provision is dated 31 July 2026, and 'Sep-26 YTD' covers August–September 2026 of FY27. Track record and NAV figures are measured to 30 September 2026 and are unaudited.
Yes. It follows a clear four-part structure (market, approach, book, growth) and includes reusable layouts: a capital-stack diagram, a five-step process, a KPI table with a column chart, a three-card case-study format, and an actual-vs-illustrative NAV outlook chart. Replace the figures with your own and keep your own disclaimers.

Create Your Own Slides
Turn your ideas into professional presentations in seconds with 2slides AI.
参考专业设计,选择您的风格,生成具有完美文本渲染的幻灯片。由 Nano Banana 提供支持——立即开始创建您的演示文稿。


