
所属合集: 投资者演示文稿案例 · 日本上市公司投资者演示文稿范例
Recruit Holdings H1 FY2026 Earnings Presentation. This is the bilingual Japanese/English deck titled "FY2026 Q2 Consolidated Results" (2027年3月期 第2四半期決算説明), released on TDnet, the Tokyo Stock Exchange timely-disclosure service, on 11 November 2026. FY2026 runs April 2026 to March 2027, so the deck covers the first half (April to September 2026) of the HR Technology (Indeed, Glassdoor), Staffing and Marketing Matching Technologies segments, with full-year guidance and capital allocation.
以这份演示文稿的封面作为风格参考,用您自己的内容生成幻灯片。 也可以在下方任选一页,以它的版式作为参考。
快速导航
标签
分享幻灯片
Recruit Holdings H1 FY2026 Earnings Presentation. This is the bilingual Japanese/English deck titled "FY2026 Q2 Consolidated Results" (2027年3月期 第2四半期決算説明), released on TDnet, the Tokyo Stock Exchange timely-disclosure service, on 11 November 2026. FY2026 runs April 2026 to March 2027, so the deck covers the first half (April to September 2026) of the HR Technology (Indeed, Glassdoor), Staffing and Marketing Matching Technologies segments, with full-year guidance and capital allocation.
每张幻灯片页面的详细视图,包括布局、关键内容和视觉元素。
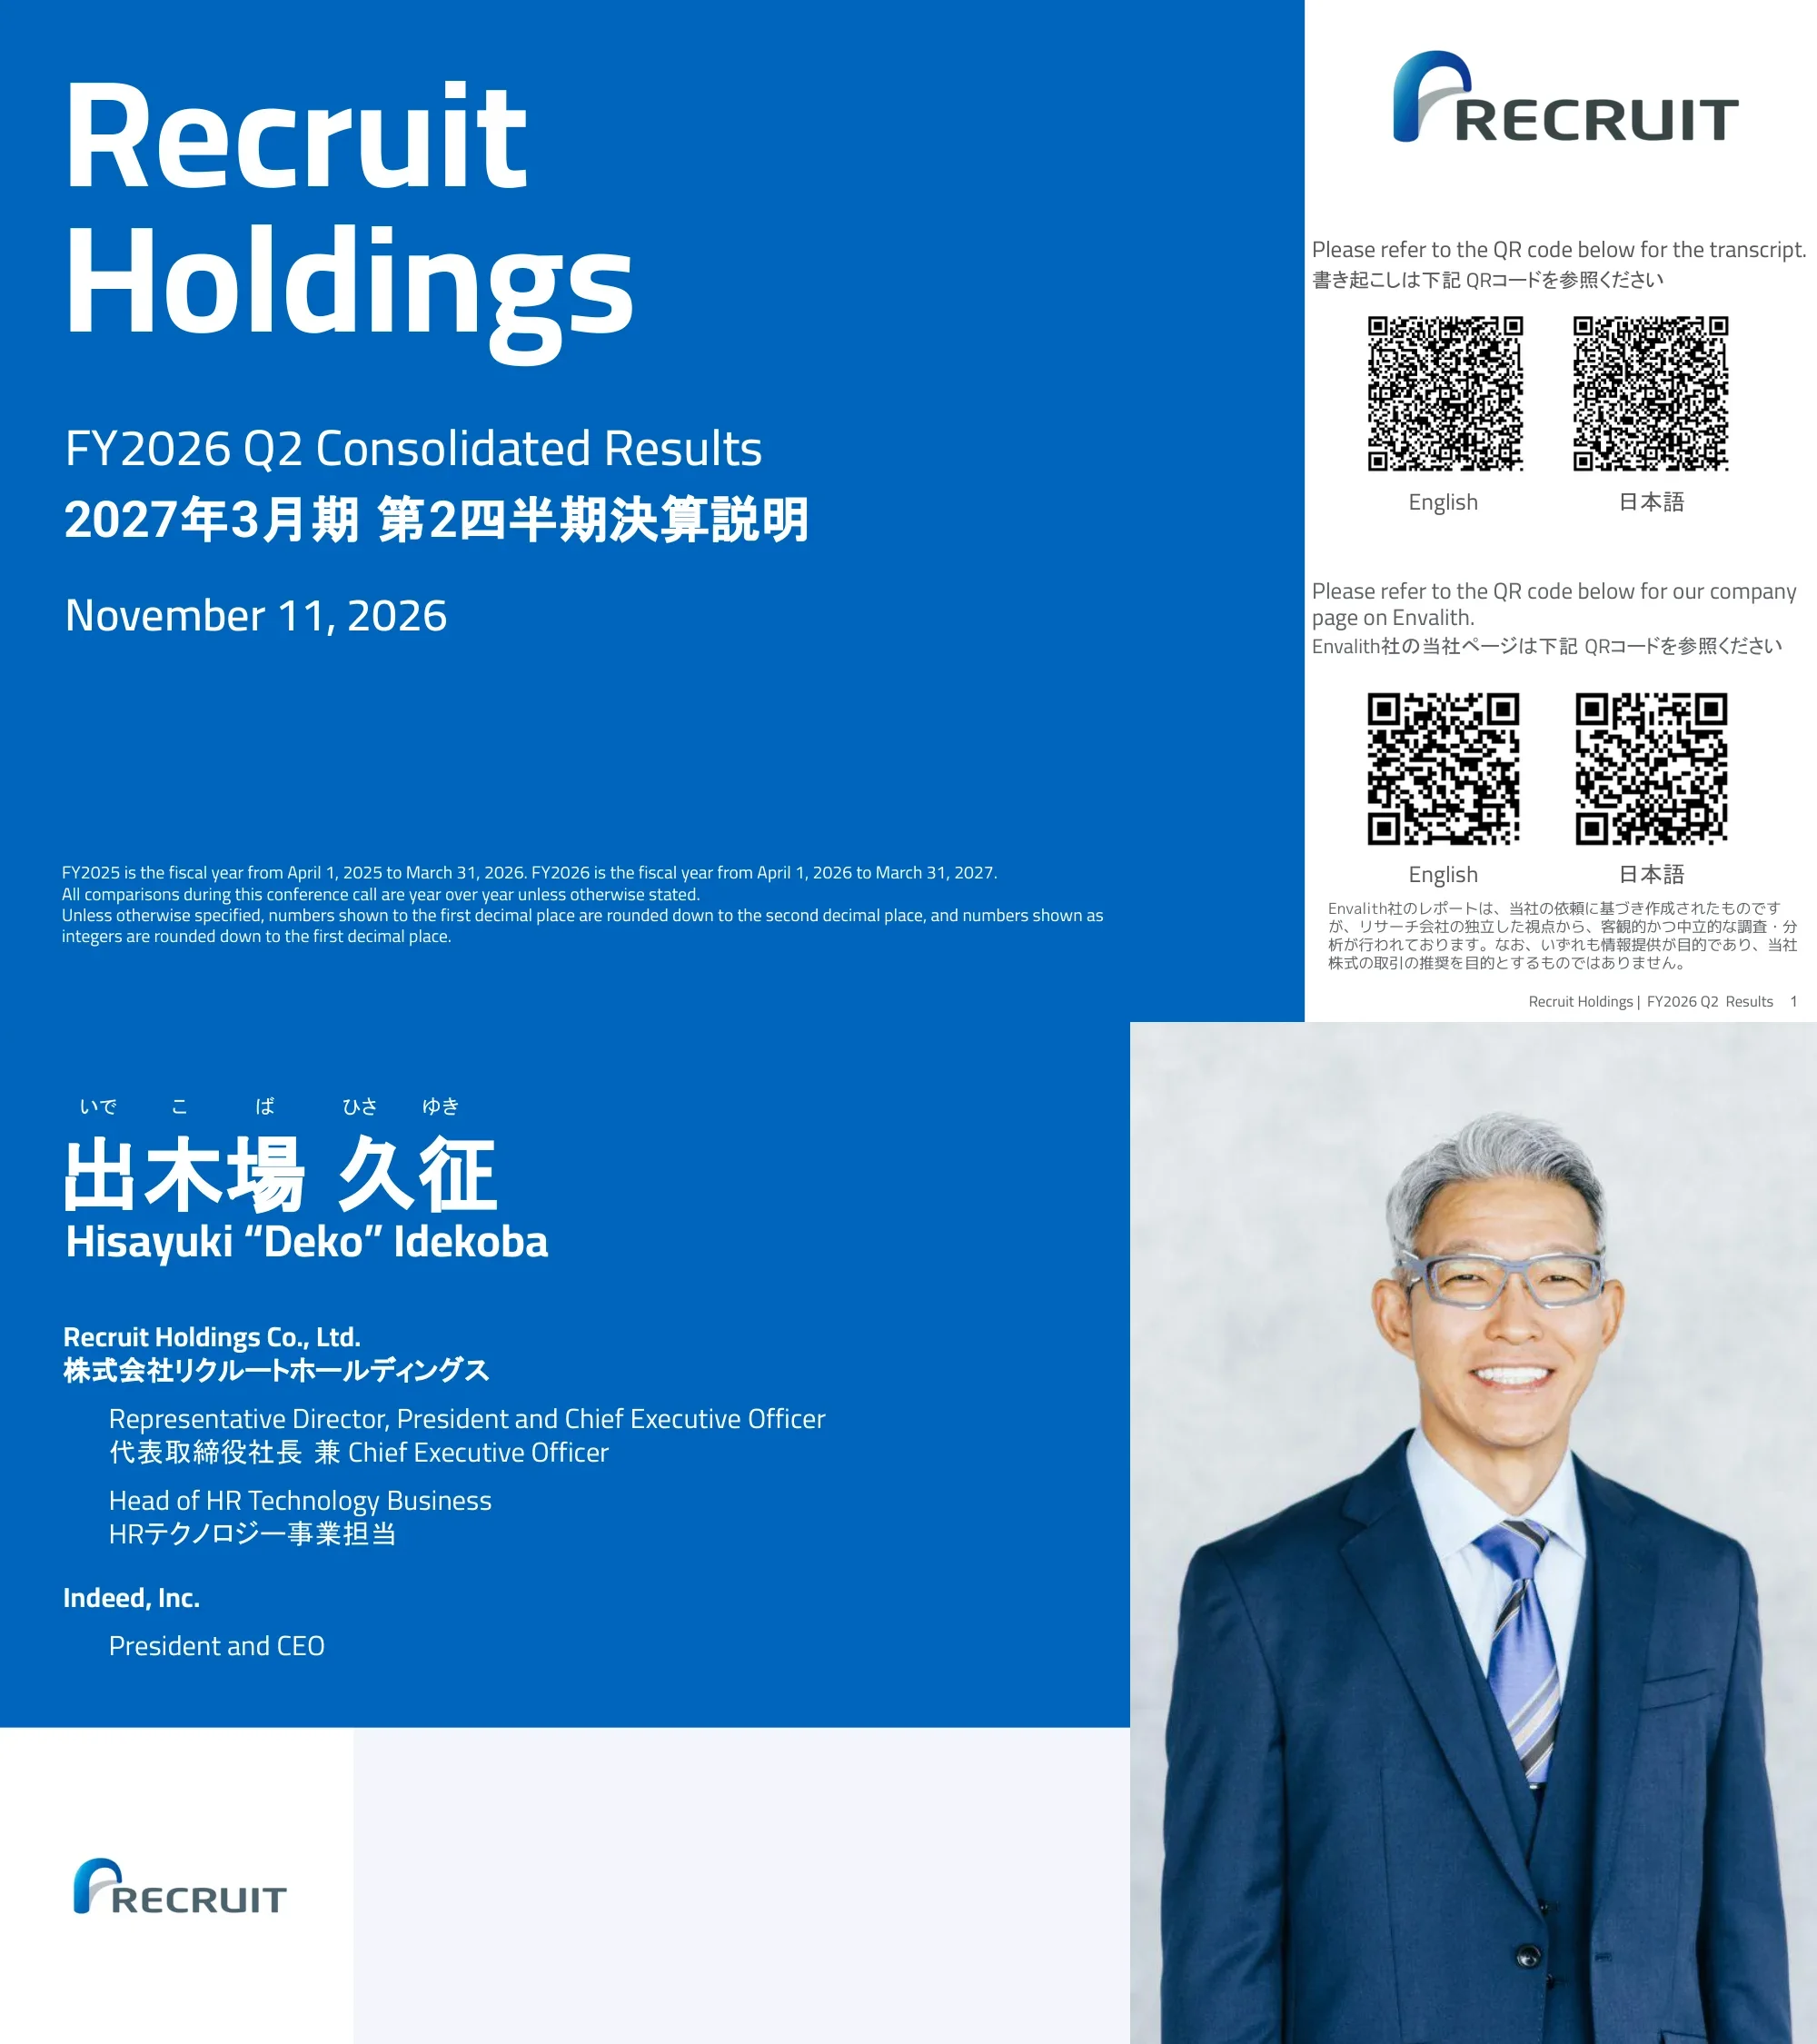
Title slide for the FY2026 Q2 Consolidated Results (2027年3月期 第2四半期決算説明), dated November 11, 2026. A note explains that FY2025 ran April 1, 2025 to March 31, 2026 and FY2026 runs April 1, 2026 to March 31, 2027, that comparisons are year over year, and how figures are rounded. QR codes link to the transcript and to the company's Envalith research page, in English and Japanese.
Large blue panel on the left with the white company name and dates; a white column on the right holds the Recruit logo and four QR codes in two labelled pairs. Fine print sits at the bottom left.
Introduces Hisayuki "Deko" Idekoba (出木場 久征), Representative Director, President and Chief Executive Officer of Recruit Holdings Co., Ltd., who also heads the HR Technology business and is President and CEO of Indeed, Inc.
Blue text panel at upper left with name (kanji with furigana, then Latin) and titles in English and Japanese; a portrait photo fills the right side; Recruit logo bottom left.
Introduces Junichi Arai (荒井 淳一), Executive Vice President and Chief Financial Officer of Recruit Holdings Co., Ltd., from the Financial Management Division.
Same template as the previous slide: blue panel with bilingual name and titles on the left, portrait photo on the right, logo at bottom left.
Four numbered sections: 1. FY2026 Q2 Results Announcement Highlights, 2. HR Technology Segment, 3. Staffing Segment, 4. Marketing Matching Technologies ("MMT") Segment.
Plain white slide with a short numbered list in bold blue type and the logo at top right; most of the page is empty space.
HR Technology: Q2 revenue grew +27.5% YoY and H1 +24.2% YoY in USD; the full-year outlook is revenue of $11.9 billion (+23.2% YoY in USD) with an EBITDA+S margin of 46.5%. Consolidated: Q2 EBITDA+S +43.6% YoY and basic EPS +68.8% YoY; full-year guidance unchanged; gross cash was ¥988.2 billion as of September 30, 2026.
Text-only slide with two groups (HR Technology, Consolidated). Each bold blue English bullet is followed by its Japanese translation in grey.
Three stacked-bar panels in billions of dollars. Quarterly: FY2025 Q1-Q4 were 2.36, 2.41, 2.34 and 2.55; FY2026 Q1 was 2.85 and Q2 3.07 (+27.5%). Semi-annual: H1 FY2025 4.77, H2 4.89, H1 FY2026 5.93 (+24.2%), H2 outlook 5.98 (+22.3%). Annual: FY2024 8.99, FY2025 9.67, FY2026 outlook 11.48 (+18.7%, 08/07/26) raised to 11.92 (+23.2%, 11/11/26).
Three side-by-side stacked column charts separated by thin vertical rules; the latest actual and outlook bars are highlighted in stronger blue, with growth labels above each.
Compares the three segments. HR Technology: global platforms on jobs, hiring solutions and real-time conversations (Indeed, Indeed PLUS, Glassdoor, Recruit Agent, Recruit Direct Scout); revenue from pay for performance and subscription fees. Staffing: temporary staffing in Japan, Europe, US and Australia (Recruit Staffing, Staff Service Group, startpeople, Staffmark Group, CSI Companies, peoplebank); revenue from fees for dispatching temporary staff. MMT: matching platforms and SaaS in Japan (Hot Pepper Beauty, Hot Pepper Gourmet, Air Business Tools, SUUMO and others); revenue from advertising, pay for performance and subscriptions.
A 3-column by 3-row grid with colour-coded headers (blue, yellow, green) and row labels Business, Brands and Source of Revenue; brand logos fill the middle row.
Quarterly consolidated results. Revenue reached ¥1,094.6 billion in Q2 FY2026 (+19.7%) after ¥1,045.3 billion in Q1. EBITDA+S was ¥297.9 billion (+43.6%) at a 27.2% margin, versus ¥292.8 billion at 28.0% in Q1. Basic EPS was ¥150.54 (+68.8%) versus ¥145.48 in Q1. JPY/USD rates ran from 144.4 in FY2025 Q1 to 159.1 in FY2026 Q2.
Three column charts (Revenue, EBITDA+S with margin %, Basic EPS) covering six quarters each, with the latest quarter highlighted in darker blue and an exchange-rate row beneath the first chart.
Full-year FY2026 guidance is unchanged: revenue of ¥4.23 trillion (+14.4% versus ¥3.69 trillion in FY2025), EBITDA+S of ¥1,105.0 billion (+39.1%, 26.1% margin versus 21.5%), and basic EPS of ¥543.00 (+55.2% versus ¥349.78). FY2024 comparatives were ¥3.55 trillion, ¥678.8 billion (19.1%) and ¥271.44. The guidance assumes 159.0 yen per US dollar.
Three bar charts (Revenue, EBITDA+S and margin, Basic EPS) with three bars each; the guidance bar is in dark navy and light-blue bars show history, with the exchange-rate row at the bottom left.
In H1 FY2026 the company repurchased approximately 16 million of its own shares, equal to ¥177.6 billion. Gross cash was ¥988.2 billion as of September 30, 2026. The FY2026 interim dividend per share is ¥13.0, as forecast in May.
Three bullet blocks, each with a bold blue lead-in and a Japanese translation beneath; the lower half of the slide is blank.
Total payouts to shareholders were ¥254.5 billion in FY2023 (72.0% payout ratio), ¥859.1 billion in FY2024 (210.3%) and ¥713.1 billion in FY2025 (143.5%); FY2026 year to date is ¥200.0 billion. Gross cash was ¥1,136.8 billion (03/31/24), ¥823.8 billion (03/31/25), ¥767.9 billion (03/31/26) and ¥988.2 billion (09/30/26). ROE was 19.5%, 22.6% and 31.0% for FY2023-FY2025, with a dashed line towards the FY2026 outlook. Exact equity bar values are not legible.
Three panels: payout bars with a payout-ratio line, gross cash bars, and equity bars with an ROE line. The latest values are highlighted in darker blue, and superscript numbers point to footnotes.
Section divider introducing section 2, the HR Technology Segment.
White slide with the section title centred in bold blue and the logo at the top right.
Q2 FY2026 HR Technology revenue was $3.07 billion (+27.5%), made up of US $1.82 billion (+36.6%), Europe & Others $0.65 billion (+29.1%) and Japan $0.59 billion (+4.8%). In yen, revenue was ¥490.0 billion (+37.8%): US ¥290.2 billion (+47.6%), Europe & Others ¥104.7 billion (+39.5%) and Japan ¥95.1 billion (+13.2%). The dollar chart covers FY2024 Pro Forma through FY2026 Q2.
Two stacked-column charts: ten quarters in US dollars on the left and six quarters in yen on the right, with the latest bar split into US, Europe & Others and Japan with growth labels.
Q2 FY2026 segment EBITDA was ¥212.1 billion (+72.0%) at a 43.3% margin; EBITDA+S was ¥233.4 billion (+73.2%) at a 47.6% margin. Q1 FY2026 was ¥195.9 billion and ¥215.7 billion respectively. FY2025 Q1 started at ¥96.3 billion EBITDA and ¥119.4 billion EBITDA+S.
Two bar-and-line combo charts side by side, with margin shown as a purple line on a right-hand percent axis and the latest quarter highlighted in bright blue.
H1 FY2026 revenue was $5.93 billion (+24.2%) and the H2 outlook is $5.98 billion (+22.3%). In yen, H1 was ¥945.5 billion (+35.6%) and H2 outlook ¥934.3 billion (+22.8%). Earlier halves: $4.58 billion and $4.40 billion in FY2024 Pro Forma, $4.77 billion and $4.89 billion in FY2025.
Two stacked-bar charts, USD on the left and JPY on the right, covering six half-years with the H2 outlook bar in darker teal blue.
H1 FY2026 EBITDA was ¥408.1 billion (+85.8%, 43.2% margin) and the H2 outlook is ¥392.1 billion (+45.7%, 42.0%). EBITDA+S was ¥449.2 billion in H1 (+76.7%, 47.5%) and the H2 outlook is ¥425.2 billion (+43.8%, 45.5%). FY2025 halves for EBITDA+S were ¥254.3 billion and ¥295.6 billion.
Two bar-and-line charts with margin lines on a right percent axis; the actual and outlook bars are in two shades of blue.
FY2026 revenue outlook as of 11/11/26 is $11.92 billion (+23.2%), up from $11.48 billion (+18.7%) on 08/07/26; in yen it is ¥1,879.9 billion (+28.9%) versus ¥1,822.0 billion (+24.9%). EBITDA+S outlook is ¥874.4 billion at 46.5% (+59.0%), up from ¥834.0 billion at 45.8% (+51.6%). FY2025 actuals were $9.67 billion, ¥1,458.4 billion and ¥549.9 billion (37.7%).
Three bar charts (USD revenue, JPY revenue, EBITDA+S and margin), each showing FY2024 Pro Forma, FY2025 Actual and the two FY2026 outlook dates, with the prior outlook in grey and the new one in dark blue.
The FY2026 outlook totals $11.92 billion: US $6.97 billion (58.5%), Europe & Others $2.53 billion (21.3%) and Japan $2.41 billion (20.2%). Versus FY2025 actuals of $5.31 billion (US), $2.04 billion (Europe & Others) and $2.31 billion (Japan), growth is +31.2%, +24.1% and +4.2%. The 08/07/26 outlook had been $6.65 billion, $2.52 billion and $2.31 billion.
A pie chart on the left shows the regional mix; a clustered bar chart on the right compares FY2025 actual with both FY2026 outlook dates for each region.
A long-run quarterly chart from FY2019 Q4 to FY2026 Q2 of US revenue in millions of dollars, with the Indeed Hiring Lab US NSA Job Postings Index (indexed to 100 on Feb 1, 2020) and US average revenue per job posting (ARPJ) growth. Q2 FY2026 US revenue grew +36.6% (Q1 +30.0%) with ARPJ growth of +39% (Q1 +35%), while the postings index was about -2%. ARPJ growth steps shown are +11%, +15%, +19% and +25% across FY2025 to FY2026 Q1.
A single wide column chart with two overlaid lines (green postings index, purple ARPJ growth) and callouts on the most recent bars.
US H1 FY2026 revenue was $3,463 million (+33.4%) with ARPJ growth of +37% and a postings index change of -3%. The H2 outlook is $3,508 million (+29.1%) with ARPJ +29% and the company's assumed postings index change at 0%. Earlier ARPJ growth points were +13% (H1 FY2025) and +22% (H2 FY2025).
Six half-year columns with the outlook column in dark blue, a green index line, a purple ARPJ line and a dotted line for the company's assumed FY2026 index.
US revenue was $5,314 million in FY2025 (+8.8%, ARPJ +17%, postings index -7%) and the FY2026 outlook is $6,972 million (+31.2%) with ARPJ growth of +33% and a postings index change of -1%. Bars run from FY2020 to FY2026 Outlook. Small axis dates are not legible at this resolution.
Seven annual columns with the outlook column highlighted; the green postings index line and purple ARPJ line overlay the chart, and a dotted line marks the assumed FY2026 index.
Quarterly revenue in millions of dollars: 476, 509, 507 and 552 in FY2025 Q1-Q4, then 611 in FY2026 Q1 and 657 in Q2 (+29.1%). Annual: $1,716 million in FY2024, $2,045 million in FY2025, and an FY2026 outlook of $2,520 million (+23.2%, 08/07/26) raised to $2,539 million (+24.1%, 11/11/26).
Two simple single-series column charts: quarterly on the left, annual with a grey prior outlook and a dark blue new outlook on the right.
Japan revenue in billions of yen: 90.2, 84.0, 81.6 and 92.2 across FY2025 Q1-Q4, then 96.3 in FY2026 Q1 and 95.1 in Q2 (+13.2%). Annual: ¥364.9 billion (FY2024 Pro Forma), ¥348.2 billion (FY2025), and an FY2026 outlook of ¥367.0 billion (+5.4%, 08/07/26) raised to ¥380.0 billion (+9.1%, 11/11/26).
Two column charts side by side: six quarters on the left and the annual results and outlook on the right, with the new outlook in dark blue.
Section divider introducing section 3, the Staffing Segment.
White slide with a centred bold blue section title and the logo at the top right.
Q2 FY2026 Staffing revenue was ¥462.3 billion (+9.7%), split into Japan ¥216.8 billion (+3.5%) and Europe, US and Australia ¥245.4 billion (+15.8%). EBITDA+S was ¥26.8 billion at a 5.8% margin (-3.4% YoY), versus ¥28.2 billion at 6.2% in Q1 and ¥27.7 billion at 6.6% a year earlier.
Two charts: a stacked revenue column chart split into Japan and overseas, and an EBITDA+S column chart with margin labels, both in yellow tones over six quarters.
H1 FY2026 revenue was ¥917.5 billion (+10.6%): Japan ¥437.1 billion (+3.5%) and Europe, US and Australia ¥480.4 billion (+18.0%). The H2 outlook is ¥913.4 billion (+4.5%), with Japan ¥435.8 billion (+2.7%) and overseas ¥477.5 billion (+6.3%). EBITDA+S was ¥55.1 billion at 6.0% in H1 (+0.9%), and the H2 outlook is ¥47.3 billion at 5.2% (+5.1%).
Two charts with a dashed divider between FY2025 and FY2026; actual H1 is yellow and the outlook H2 is orange.
FY2026 Staffing revenue outlook is ¥1,831.0 billion (+7.5%), versus ¥1,703.4 billion in FY2025 and ¥1,666.9 billion in FY2024; Japan is ¥873.0 billion (+3.1%) and Europe, US and Australia ¥958.0 billion (+11.8%). EBITDA+S outlook is ¥102.5 billion at 5.6% (+2.8%), versus ¥99.7 billion (5.9%) and ¥97.4 billion (5.8%).
Two three-bar charts: a stacked revenue chart with the outlook bar in orange and an EBITDA+S chart with margin labels.
Section divider introducing section 4, the Marketing Matching Technologies ("MMT") Segment.
White slide with a centred bold blue section title and the logo at the top right.
Q2 FY2026 MMT revenue was ¥149.5 billion (+3.5%): Lifestyle (Beauty, Dining, Travel, SaaS) ¥84.7 billion (+10.1%), Housing & Real Estate ¥37.4 billion (-2.9%) and Others ¥27.2 billion (-5.4%). EBITDA+S was ¥40.3 billion at a 27.0% margin (-13.4% YoY), versus ¥51.1 billion at 36.0% in Q1.
Two teal charts: a stacked revenue chart over six quarters with three sub-segments, and an EBITDA+S column chart with margin labels.
H1 FY2026 MMT revenue was ¥291.4 billion (+3.6%): Lifestyle ¥161.5 billion (+9.8%), Housing & Real Estate ¥76.0 billion (-0.1%) and Others ¥53.7 billion (-7.3%). The H2 outlook is ¥313.5 billion (+10.6%). EBITDA+S was ¥91.4 billion at 31.4% in H1 (+1.9%), and the H2 outlook is ¥90.0 billion at 28.7% (+38.1%).
Two charts divided by a dashed line between FY2025 and FY2026; H1 actual is mid-teal and the H2 outlook is dark green.
FY2026 MMT revenue outlook is ¥605.0 billion (+7.1%), versus ¥564.6 billion in FY2025 and ¥539.5 billion in FY2024. EBITDA+S outlook is ¥181.5 billion at 30.0% (+17.1%), versus ¥154.9 billion (27.4%) and ¥137.1 billion (25.4%).
Two three-bar charts: stacked sub-segment revenue for the history, a single dark green bar for the outlook, and an EBITDA+S chart with margin labels.
Section divider introducing the appendices.
White slide with a centred bold blue title and the logo at the top right.
Table in billions of yen. Q2: revenue ¥914.7 billion to ¥1,094.6 billion (+19.7%); EBITDA+S ¥207.4 billion to ¥297.9 billion (+43.6%, margin 27.2%); EBITDA ¥195.2 billion to ¥275.6 billion (+41.2%); profit attributable to owners of the parent ¥127.4 billion to ¥209.0 billion (+64.0%); basic EPS ¥89.16 to ¥150.54. H1: revenue ¥1,793.5 billion to ¥2,139.9 billion (+19.3%); EBITDA+S ¥394.5 billion to ¥590.8 billion (+49.7%, 27.6%); EBITDA ¥358.7 billion to ¥548.0 billion (+52.8%); profit ¥248.3 billion to ¥411.6 billion (+65.7%); basic EPS ¥173.12 to ¥296.01 (+71.0%). Exchange rates were 159.1 (Q2) and 159.2 (H1) yen per dollar.
A financial table with grouped blue headers for Q2 Actual and H1 Actual, each with FY2025, FY2026 and YoY columns, and alternating shaded rows with italic margin rows.
The total addressable market for global HR matching in 2025 is shown as $302 billion: Temporary Staffing $105 billion, Direct Hire $71 billion, Internal Recruitment Automation $68 billion, Job Advertising & Talent Sourcing $34 billion and Retained Search $24 billion. The footnote refers readers to the FY2025 Annual Report.
A large pie chart with the total above, dollar values inside the slices and bilingual English/Japanese labels with leader lines around the edge.
Segment comparison of FY2025 actual versus FY2026 outlook. Revenue: HR Technology ¥1,458.4 billion to ¥1,879.9 billion, Staffing ¥1,703.4 billion to ¥1,831.0 billion, MMT ¥564.6 billion to ¥605.0 billion. EBITDA+S: HR Technology ¥549.9 billion (37.7%) to ¥874.4 billion (46.5%), Staffing ¥99.7 billion (5.9%) to ¥102.5 billion (5.6%), MMT ¥154.9 billion (27.4%) to ¥181.5 billion (30.0%).
Two grouped column charts (revenue and EBITDA+S with margin) in the segment colours blue, yellow/orange and green, with FY2025 Actual on the left and FY2026 Outlook on the right.
In billions of yen, FY2025 Q2 versus FY2026 Q2: operating income 159.7 to 258.3 (+61.7%); other operating income/(expenses), net (18.2) to (0.4); non-GAAP operating income 178.0 to 258.8 (+45.3%); plus depreciation and amortization 17.1 to 16.8; EBITDA 195.2 to 275.6 (+41.2%, 25.2% of revenue, 40.5% of gross profit); plus share-based payment expenses 12.1 to 22.2; EBITDA+S 207.4 to 297.9 (+43.6%, 27.2% of revenue, 43.8% of gross profit).
A vertical bridge table from operating income down to EBITDA+S with subtotal rules, italic margin rows and a highlighted FY2026 Q2 column.
In millions of shares, at March 31, 2025, March 31, 2026 and Sep. 30, 2026: issued shares 1,563.9, 1,472.5 and 1,472.5; shares directly held by Recruit Holdings 36.4, 28.8 and 44.4; shares held by the Board Incentive Plan trust and ESOP trust 60.7, 47.4 and 41.8; total treasury stock 97.1, 76.2 and 86.3; issued shares excluding treasury stock 1,466.7, 1,396.2 and 1,386.1.
Three-column table with the latest column highlighted and shaded alternating rows; a double rule under the final total.
In billions of yen: cash and cash equivalents were 808.6 (March 31, 2025), 725.5 (March 31, 2026) and 872.8 (Sep. 30, 2026). Investments for available funds on standby for business operations within other financial assets were 15.1, 42.3 and 115.4. Gross cash was therefore 823.8, 767.9 and 988.2.
A compact three-row table with three date columns and a double-ruled total row; the lower half of the slide is empty.
Defines the FX assumptions for guidance (159 yen per US dollar, 184 yen per euro, 112 yen per Australian dollar as of August 7, 2026; 156 yen per dollar for HR Technology's H2 outlook as of November 11, 2026), the definitions of EBITDA and EBITDA+S, total payout ratio, gross cash and ROE, and the April 1, 2025 transfer of HR Solutions into HR Technology and the renaming of Matching & Solutions to Marketing Matching Technologies, which underlies the pro forma comparisons.
Dense text-only slide with bold page-reference headings followed by small body paragraphs.
Explains how US average revenue per job posting (ARPJ) is calculated: HR Technology US revenue divided by the average daily number of US job postings on Indeed, as measured by the Indeed Hiring Lab. Describes the Indeed Job Postings Index (JPI), a seven-day trailing average indexed to 100 on February 1, 2020, with some 2021 and 2022 data interpolated. Also notes that page 34 refers to the FY2025 Annual Report and that depreciation excludes right-of-use assets.
Text-only slide with bold page-range headings and small paragraphs; about half of the slide is blank.
Japanese-language disclaimer with three parts: cautionary notes on forward-looking statements (outcomes may differ materially because of economic conditions, competition, regulation, exchange rates, climate change and disasters, with no obligation to update), notes on external materials (third-party information not independently verified), and notes on use of the material (for general reference only, no disclosure or use by third parties without prior written consent).
Text-only page with three blue subheadings, each followed by a dense paragraph in Japanese.
English version of the disclaimer with three headings: Forward-Looking Statements (actual results may differ significantly, and the company has no obligation to update), Third-Party Information (not independently verified), and Notes of This Material (for general reference only, with no disclosure or use by third parties without prior written consent).
Text-only closing page mirroring the Japanese disclaimer, with three blue subheadings and justified paragraphs.
关于此幻灯片和基础演示文稿内容的常见问题。
It is Recruit Holdings' FY2026 Q2 Consolidated Results presentation (2027年3月期 第2四半期決算説明), released on TDnet, the Tokyo Stock Exchange timely-disclosure service, on 11 November 2026. It is bilingual: headings are mostly English, key bullets carry Japanese translations, and the last disclaimer pages are in Japanese and English.
FY2026 is the fiscal year from April 1, 2026 to March 31, 2027, so the deck covers the first half, April to September 2026. Q2 is July to September 2026, and balance-sheet items such as gross cash are as of September 30, 2026.
Q2 FY2026 revenue was ¥1,094.6 billion (+19.7% YoY), EBITDA+S ¥297.9 billion (+43.6%, 27.2% margin) and basic EPS ¥150.54 (+68.8%). For H1, revenue was ¥2,139.9 billion, EBITDA+S ¥590.8 billion and basic EPS ¥296.01. Full-year guidance was left unchanged.
Consolidated guidance is revenue of ¥4.23 trillion (+14.4%), EBITDA+S of ¥1,105.0 billion (26.1% margin) and basic EPS of ¥543.00, based on 159.0 yen per US dollar. HR Technology's outlook was raised to $11.92 billion of revenue (+23.2% in USD) with an EBITDA+S margin of 46.5%.
HR Technology (Indeed, Indeed PLUS, Glassdoor, Recruit Agent, Recruit Direct Scout), Staffing (temporary staffing in Japan, Europe, the US and Australia) and Marketing Matching Technologies, or MMT (platforms and SaaS in Japan such as Hot Pepper, Air Business Tools and SUUMO). Each has quarterly, semi-annual and annual slides with outlooks.
The footnotes define EBITDA+S as operating income plus depreciation and amortization (excluding depreciation of right-of-use assets) plus share-based payment expenses, plus or minus other operating income/expenses. A reconciliation for Q2 on slide 36 runs from operating income of ¥258.3 billion to EBITDA of ¥275.6 billion and EBITDA+S of ¥297.9 billion.
Yes. A 決算説明会資料 is the Japanese term for the materials presented at an earnings briefing, and this is that kind of deck. Its structure of highlights, segment sections, appendix tables, footnotes and a disclaimer is a useful reference. The content belongs to Recruit Holdings, and the disclaimer says it may not be disclosed or used by third parties for other purposes without written consent.
Yes. H1 FY2026 repurchases were approximately 16 million shares worth ¥177.6 billion, the interim dividend is ¥13.0 per share, and gross cash was ¥988.2 billion at September 30, 2026. Appendix tables show issued shares of 1,472.5 million and 1,386.1 million excluding treasury stock.

Create Your Own Slides
Turn your ideas into professional presentations in seconds with 2slides AI.
参考专业设计,选择您的风格,生成具有完美文本渲染的幻灯片。由 Nano Banana 提供支持——立即开始创建您的演示文稿。


