
所属合集: 投资者演示文稿案例 · 日本上市公司投资者演示文稿范例 · 半导体投资者演示文稿案例
KOKUSAI ELECTRIC H1 FY2026 Earnings Presentation: a 42-page Japanese-language investor deck covering the first half (April-September 2026) of the fiscal year ending March 2027 for a semiconductor front-end equipment maker (batch deposition and treatment tools). The original was published on TDnet (Tokyo Stock Exchange timely disclosure) on 2026-11-09. It combines H1 results, an unchanged full-year forecast, WFE market outlook, DRAM/NAND/logic business roadmaps, production capacity plans and financial appendices.
以这份演示文稿的封面作为风格参考,用您自己的内容生成幻灯片。 也可以在下方任选一页,以它的版式作为参考。
快速导航
标签
分享幻灯片
KOKUSAI ELECTRIC H1 FY2026 Earnings Presentation: a 42-page Japanese-language investor deck covering the first half (April-September 2026) of the fiscal year ending March 2027 for a semiconductor front-end equipment maker (batch deposition and treatment tools). The original was published on TDnet (Tokyo Stock Exchange timely disclosure) on 2026-11-09. It combines H1 results, an unchanged full-year forecast, WFE market outlook, DRAM/NAND/logic business roadmaps, production capacity plans and financial appendices.
每张幻灯片页面的详细视图,包括布局、关键内容和视觉元素。
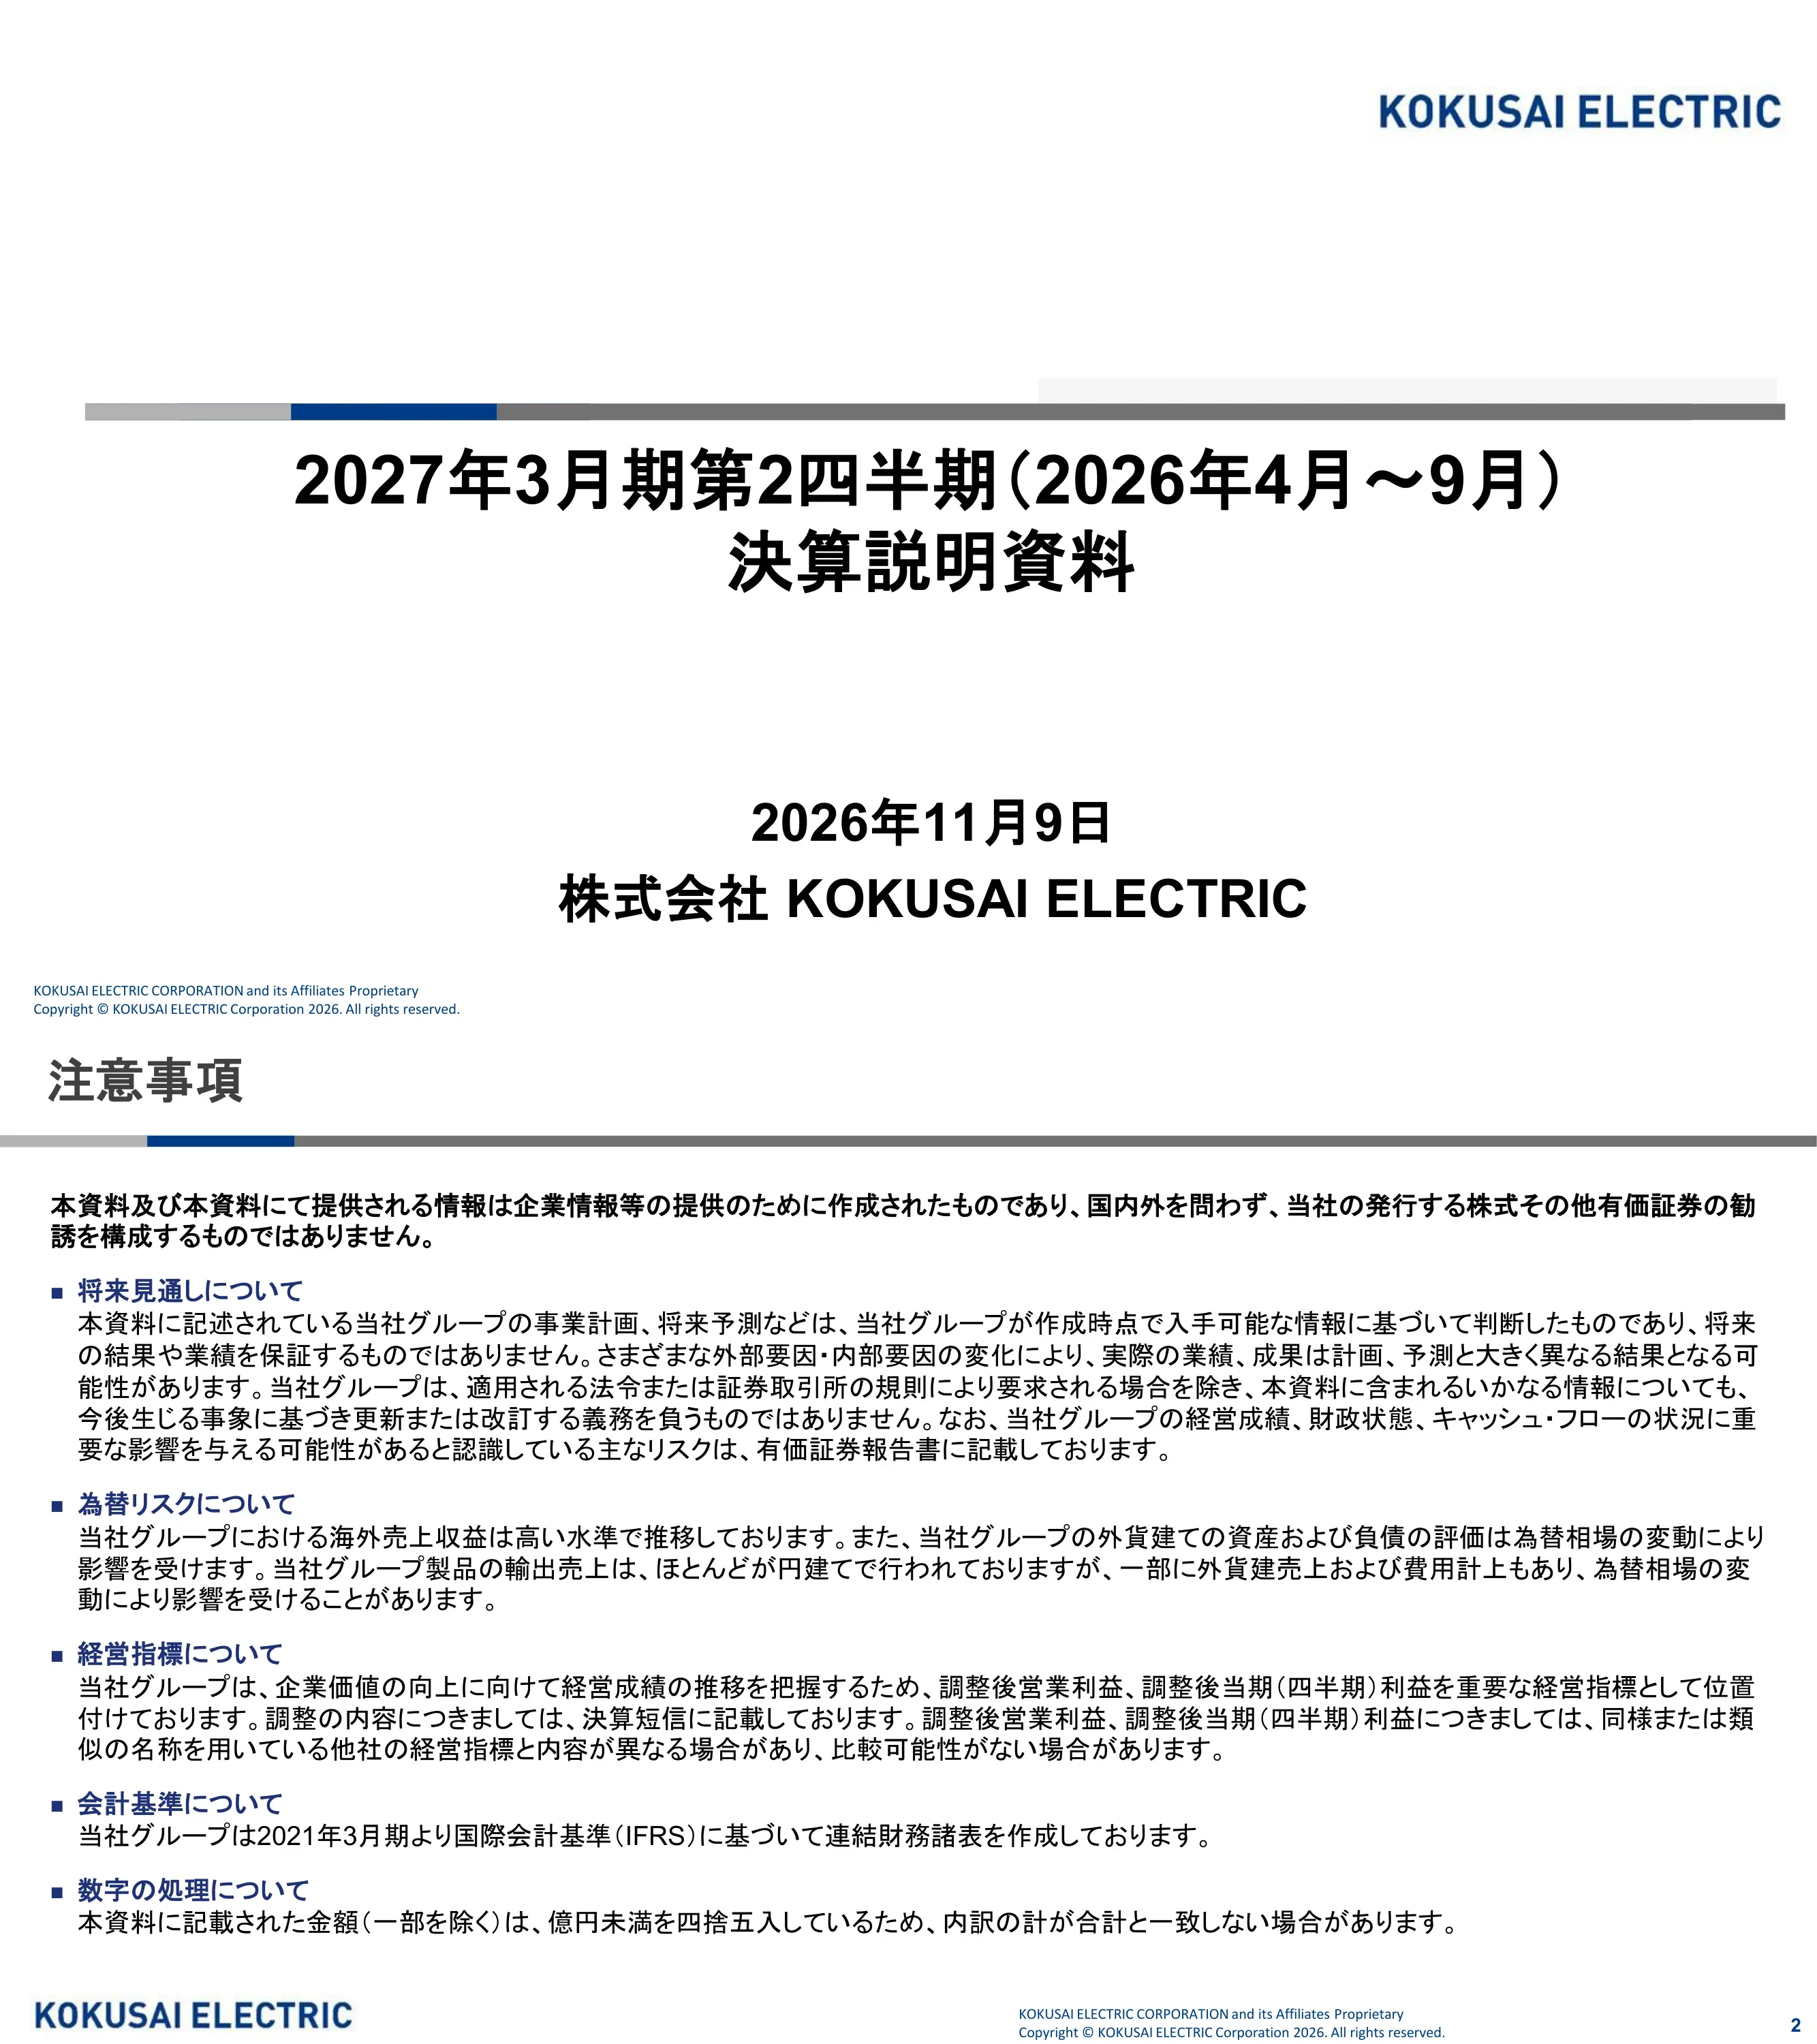
Cover slide for the Q2 (April-September 2026) results presentation of KOKUSAI ELECTRIC, dated November 9, 2026.
Centered Japanese title and date over a tri-color rule, logo top right
Standard disclaimer: the material is not a solicitation to buy securities, forward-looking statements are not guarantees, and FX risk is noted. Adjusted operating profit and adjusted profit are key metrics; IFRS has been used since the fiscal year ended March 2021; amounts are rounded to the nearest 100 million yen.
Single text page with five bold blue subheadings and body paragraphs
Section divider introducing the consolidated results overview for Q2 of the fiscal year ending March 2027.
Full-width navy band with white chevrons and centered title
AI-related high-performance logic and DRAM kept device-maker investment high, NAND is mainly generation-change investment, and consumer, automotive and industrial recovery is gradual. Q2 revenue and profit rose YoY on DRAM and logic/foundry equipment plus service sales; H1 gross margin fell on product mix. The outlook half is greyed out.
Two blue header bars; top section in bold black bullets, lower section dimmed
Q2 revenue 88.6 billion yen (886 in 100-million-yen units, +35.5% YoY, +17.5% QoQ); H1 revenue 164.0 billion yen (+40.0%). H1 gross margin 41.8% (down 0.4pt), adjusted operating profit 39.8 billion yen (24.3% margin, +57.2%), operating profit 36.8 billion yen, profit 25.9 billion yen, interim dividend 32 yen per share.
Large financial table with quarterly columns, YoY and QoQ change columns, Q2 and H1 columns highlighted in pink
Q2 revenue rose from 65.4 to 88.6 billion yen: global-account equipment +17.6 billion yen, China-account equipment +0.6, service +5.0. Adjusted operating profit rose from 14.4 to 22.5 billion yen, driven by gross profit +10.7 and SG&A -2.7 (volume +9.7, margin +1.0).
Two side-by-side waterfall charts with callout boxes for application splits
H1 revenue rose from 117.2 to 164.0 billion yen (+40%): global-account equipment +38.6 billion yen, China-account equipment -1.9 (a major maker pausing investment), service +10.1. Adjusted operating profit rose from 25.3 to 39.8 billion yen (+57%); gross margin decline cost 0.6 billion yen.
Two side-by-side waterfall charts with callouts
Q2 revenue of 88.6 billion yen split NAND 13%, DRAM 37%, logic/foundry 28%, other 2%, service 20%. H1 total 164.0 billion yen: equipment 129.7 billion yen and service 34.4 billion yen; DRAM 35%, logic/foundry 27%, NAND 13%, service 21%.
Stacked column chart of six quarters plus H1 comparison columns, data table below
Q2 global-account revenue was 57.7 billion yen (65% share) versus 30.9 billion yen for China-based makers (35% share, up from 25% in Q1). The accounts split is defined by device-maker headquarters outside or inside China.
Two stacked column charts side by side with share-ratio rows below
Q2 revenue rose YoY in every region; China was 39% of Q2 (34% of H1, down from 47%). H1 overseas revenue was 151.9 billion yen and Japan 12.1 billion yen; regional mix includes Taiwan 18%, Korea 28% and US 6% in H1.
Quarterly stacked columns by country plus H1 panel, overseas vs Japan table
Total assets at end of Q2 were 390.1 billion yen, up 30.4 billion yen from March 2026 on higher cash and receivables. Total equity rose 17.9 billion yen to 237.2 billion yen; cash 69.7 billion yen, interest-bearing debt 44.5 billion yen.
Two stacked column charts (assets in blue, liabilities/equity in pink and orange)
Equity ratio at Q2 end was 60.8%, up 0.2pt from the prior quarter. Net cash rose 18.6 billion yen to 25.2 billion yen as cash reached 69.7 billion yen against interest-bearing debt of 44.5 billion yen.
Left combo bar-and-line chart, right paired bar chart
Q2 operating cash flow was 27.6 billion yen, investing -6.0 billion yen and free cash flow 21.6 billion yen. Financing outflow of 9.9 billion yen reflected long-term loan repayment and share buybacks; ending cash 69.7 billion yen.
Bar chart with free cash flow line above a data table
Q2 R&D was 5.3 billion yen (6.0% of revenue), capex 6.0 billion yen (6.7%), and depreciation 4.0 billion yen (4.5%). All tracked to plan, with the second half also expected to follow plan; large capex such as new plants and demo-room expansion is shown separately.
Left bar-and-line chart for R&D; right stacked bar chart for capex with depreciation line; tables below
Section divider introducing the consolidated forecast for the fiscal year ending March 2027.
Full-width navy band with white chevrons and centered title
Device makers are expected to accelerate capex for generation changes and capacity, led by high-performance devices, and to expand general-purpose investment as well. Results are tracking the full-year forecast revised at Q1; neither the forecast nor the dividend forecast changes.
Same two-bar layout as page 4 with the results half dimmed and the outlook half emphasized
Full-year forecast: revenue 340.0 billion yen (+44.6%), gross profit 146.2 billion yen (43.0% margin), adjusted operating profit 86.0 billion yen (25.3%, +80.7%), operating profit 79.4 billion yen, profit 55.5 billion yen. Dividend forecast is 65 yen per share, a 25.2% payout on adjusted profit.
Table with H1 actual, H2 forecast, full-year forecast (pink column) and YoY change
Revenue is forecast to rise from 235.1 to 340.0 billion yen (+45%): global-account equipment +67.8 billion yen, China-account equipment +26.6, service +10.6. Adjusted operating profit rises from 47.6 to 86.0 billion yen (+81%) on gross profit +49.4 and SG&A -11.0.
Two waterfall charts with callouts for NAND/DRAM/logic contributions
Global-account revenue is forecast up 49% with a 67% share, driven mainly by NAND and logic/foundry equipment. China-account revenue is forecast up 37% with a 33% share, driven mainly by DRAM equipment. Historical comparison runs from FY ending March 2023 to the forecast.
Two five-year stacked column charts with share rows below
Forecast growth versus prior year: NAND +49%, DRAM +61%, logic/foundry +65%, service +22%. Service share is forecast at 17%; total revenue 340.0 billion yen, equipment 281.4 billion yen and service 58.6 billion yen.
Single stacked column chart over five fiscal years with equipment/service table
Section divider introducing the forward-looking outlook section.
Full-width navy band with white chevrons and centered title
AI demand keeps driving device-maker capex; mature-node recovery is still awaited. For 2026 (vs 2025) the WFE market is forecast up 25% or more to roughly $140+ billion; NAND equipment about +25%, DRAM equipment about +40%, logic/foundry and other about +20%.
Two columns (device market vs WFE market) with arrows leading to boxed 2026 forecasts
Targets were revisited on May 13, 2026: revenue of 330 billion yen or more is now expected in FY ending March 2027, two years ahead; adjusted operating margin of 30% or more is targeted by FY ending March 2028. Equipment share about 80%, service about 20%, R&D 6% or more, ROE 25%+, ROIC 23%+; revised application mix is about NAND 20%, DRAM 40%, logic and other 40%.
Old vs revised target table on the left with a two-column stacked bar of application mix on the right
WFE market is expected to keep double-digit growth in CY27 (overall +30% or more, about $190 billion). The company aims to grow faster than WFE, with revenue rising from 235.1 to 340.0 billion yen and beyond; growth drivers are expanding sales of high-share advanced tools and boosting production capacity.
Left three-column bar chart with growth arrow; right market forecast box and two driver cards
Adjusted operating margin rises from 25.3% (FY ending March 2027 forecast) toward the 30% or higher target for FY ending March 2028. Three pillars: more POR wins on high-value products, TAM growth from device generation changes (batch ALD tools, single-wafer plasma treatment), and production scale-up with SG&A optimization.
Staircase of three pillar cards between a start box and a dark-blue target box, arrow running through
As devices advance, batch ALD tools evolve from large-batch to mini-batch in each process step. A table covers 3D NAND layer counts (up to 200, 200-500, 500+) for 2025-2029 across blocking layer, charge trap, tunnel dielectric, channel Si and other steps, with POR won vs POR targeted ticks; NAND equipment revenue bars (FY2023-FY2027 forecast) at left have no legible values.
Left bar chart of NAND equipment revenue; right checkmark matrix of process steps by year
POR counts grow with each DRAM generation, large-batch ALD tool model changes are advancing, and mini-batch ALD adoption is expected in 3D DRAM. Matrix covers D1a to D0a and beyond (2021 to 2028+) across bWL, top electrode, bottom electrode, capacitor support, gapfill and contact; equipment revenue bars have no legible values.
Left bar chart of DRAM equipment revenue; right checkmark matrix by process step and generation
High-difficulty film-deposition POR wins specific to GAA drive a large increase in POR count as devices evolve; advanced packaging and mature-node recovery are also expected. Roadmap spans FinFET (2024), GAA 2nm, 1.4nm, 1.0nm to CFET 0.7nm (2031) across gate spacer, inner spacer, hard mask, gapfill and treatment.
Left bar chart of logic/foundry equipment revenue; right checkmark matrix by node and year
The three existing sites (Toyama, Tonami and Cheonan Factory) run at 70-80% utilization. Capacity will be raised in stages by moving up to 2.5 shifts with more staff and longer hours, and by expanding cleanroom space at the Tonami site using existing buildings.
Three-panel left-to-right flow: current setup with factory photos, shift expansion icons, space expansion graphic
Multilayering, miniaturization and 3D structures of devices expand high-value product opportunities, supporting growth beyond the market. Timeline 2024-2031: NAND above 200, 400 and 600 layers; DRAM from advanced 2D (D1a-D0a) to VCT and 3D stacked; logic from FinFET to GAA to CFET. Catalysts are listed for short-to-mid term and long term.
Timeline bars on top, two text boxes (short-mid term and long term) below with a vertical catalyst label
Section divider introducing the appendix.
Full-width navy band with white chevrons and English title
Business activities include a joint discovery with Yokohama National University on a self-activating thin-film bonding mechanism and exhibiting at SEMICON Taiwan 2026 and SEMICON India 2026 (all September 2026). ESG items include publishing Integrated Report 2026, an MSCI ESG rating of AA for a second year, and joining the GX League.
Two bulleted lists (business activities, ESG) with two photos on the right
Global-account revenue is 69.0 billion yen in H1 FY ending March 2026 and 84.4 billion yen in H2 (shares 59% and 72%); China-account revenue 48.2 and 33.4 billion yen (41% and 28%). The FY ending March 2027 H1 shows 70% global and 30% China; H2 forecast 65% and 35%. Other bar values are not legible.
Two stacked column charts across four half-year periods with share rows
All regions are forecast to increase versus the prior year, with China at 38% of the FY ending March 2027 revenue of 340.0 billion yen. Overseas share is 92% and Japan 8%, compared with 90% and 10% in FY ending March 2026.
Five-year stacked column chart by country with overseas/Japan table
The high-value product ratio (batch ALD plus single-wafer treatment tools) is forecast at 68% for FY ending March 2027, versus 73% in FY ending March 2026 and 54% in FY2024. Adoption of batch ALD and single-wafer treatment tools is expected to accelerate with device generation changes.
Five-year stacked column chart by tool type with high-value ratio row
H1 revenue 164,043 million yen, gross profit 68,645 (41.8%), adjusted operating profit 39,838 (24.3%), operating profit 36,814, profit 25,901. R&D 9,767, capex 10,797, depreciation 7,948 million yen for H1.
Detailed quarterly table in million yen with FY ending March 2026 and FY2027 columns
Reconciliation from operating profit (H1: 36,814 million yen) to adjusted operating profit (39,838) via amortization of intangibles from business combination 2,952, restructuring costs 14 and other items; total adjustments 2,966. A second block reconciles profit to adjusted profit of 27,972 after tax adjustments of 953.
Two reconciliation tables with quarterly columns and footnote on asset book values
Total assets at Q2 end 390,090 million yen; cash 69,749, inventories 93,603, goodwill 59,065. Liabilities 152,940 and equity 237,150 million yen; equity ratio 60.8%, D/E ratio 0.2, net cash 25,250 million yen.
Assets table at left, liabilities/equity table at right, metrics table at lower right
H1 operating cash flow 39,680 million yen, investing -11,501, free cash flow 28,179 and financing -16,334. Cash rose from 56,543 to 69,749 million yen.
Single table with quarterly columns and color-coded row labels
In CY25 the company took the top share in the batch deposition tool market (49.2% in Tube Batch, a $1.9 billion market). Batch ALD tool share reached above 80% on a roughly $1.0 billion market in 2025, and the single-wafer treatment tool market ($2.8 billion) gives a 11.8% company share; share in plasma gate modification tools is 40-50%.
Left stacked bars of market share; middle category tree; right pie charts for 2023-2025
Defines technical terms: batch processing tool, single-wafer treatment tool, ALD, CVD, CFET, FinFET, GAA, HBM, POR (Process of Record, i.e. customer qualification of equipment), TAM, VCT and WFE.
Single-column bulleted glossary
Closing slide showing the white KE and KOKUSAI ELECTRIC logo on a light-blue background.
Full-bleed solid blue background with centered logo
关于此幻灯片和基础演示文稿内容的常见问题。
The deck is in Japanese. It is KOKUSAI ELECTRIC's results presentation (決算説明資料) for the second quarter of the fiscal year ending March 2027, dated November 9, 2026, and the original was published on TDnet, the Tokyo Stock Exchange's timely disclosure service. This gallery page describes it in English and translates titles and key figures.
Japanese companies name fiscal years by the calendar year in which they start for English-language convenience, so FY2026 here means the year from April 2026 to March 2027, called the fiscal year ending March 2027 (27/3期) in the deck. H1 FY2026 covers April-September 2026.
H1 revenue was 164.0 billion yen (+40.0% YoY), gross margin 41.8%, adjusted operating profit 39.8 billion yen (24.3% margin, +57.2%), operating profit 36.8 billion yen and profit 25.9 billion yen. Q2 alone had revenue of 88.6 billion yen and an adjusted operating margin of 25.3%. Free cash flow in H1 was 28.2 billion yen.
The company expects the wafer fab equipment (WFE) market in 2026 to grow 25% or more versus 2025 to about $140 billion or more, with NAND equipment about +25%, DRAM equipment about +40% and logic/foundry and other about +20%. For 2027 it expects another 30% or more to roughly $190 billion, led by AI-related high-performance devices.
AI-related high-performance logic and DRAM are driving generation-change and capacity investment, while NAND is mainly generation-change investment and consumer, automotive and industrial recovery is gradual. The full-year forecast expects equipment revenue growth of +49% for NAND, +61% for DRAM and +65% for logic/foundry, with service up 22%.
No. The forecast revised at Q1 is unchanged: revenue of 340.0 billion yen (+44.6%), adjusted operating profit of 86.0 billion yen (25.3% margin, +80.7%) and a dividend of 65 yen per share. The mid-term plan was also unchanged, with a 30% or higher adjusted operating margin targeted for the fiscal year ending March 2028.
Yes. It shows a full earnings flow: highlights, a results table with YoY and QoQ columns, waterfall bridges, quarterly stacked charts by application, account and destination, balance sheet and cash flow, forecasts, market outlook and device roadmaps, plus a detailed appendix and glossary. The consistent navy-and-grey styling and section dividers are easy to adapt.
The design and figures belong to KOKUSAI ELECTRIC and its cited sources (for example Gartner for market-share data on page 40). Use this gallery as inspiration for structure and layout and recreate the slides with your own content. For investment research, cite the original TDnet disclosure and check the company's own cautionary notes on forward-looking statements.

Create Your Own Slides
Turn your ideas into professional presentations in seconds with 2slides AI.
参考专业设计,选择您的风格,生成具有完美文本渲染的幻灯片。由 Nano Banana 提供支持——立即开始创建您的演示文稿。


