
所属合集: 咨询公司演示文稿范例
Deloitte Global's 2026 Gen Z and Millennial Survey, "Progress on Their Own Terms" (15th edition, published May 2026): a 53-page research report deck based on responses from 22,595 Gen Zs and millennials in 44 countries, covering financial pressure and delayed life decisions, how these generations view leadership, continuous learning, AI adoption and the organizational readiness gap, mental health and well-being, purpose and workplace friendship, and preparing for Gen Alpha's arrival in the workforce.
以这份演示文稿的封面作为风格参考,用您自己的内容生成幻灯片。 也可以在下方任选一页,以它的版式作为参考。
快速导航
标签
分享幻灯片
Deloitte Global's 2026 Gen Z and Millennial Survey, "Progress on Their Own Terms" (15th edition, published May 2026): a 53-page research report deck based on responses from 22,595 Gen Zs and millennials in 44 countries, covering financial pressure and delayed life decisions, how these generations view leadership, continuous learning, AI adoption and the organizational readiness gap, mental health and well-being, purpose and workplace friendship, and preparing for Gen Alpha's arrival in the workforce.
每张幻灯片页面的详细视图,包括布局、关键内容和视觉元素。
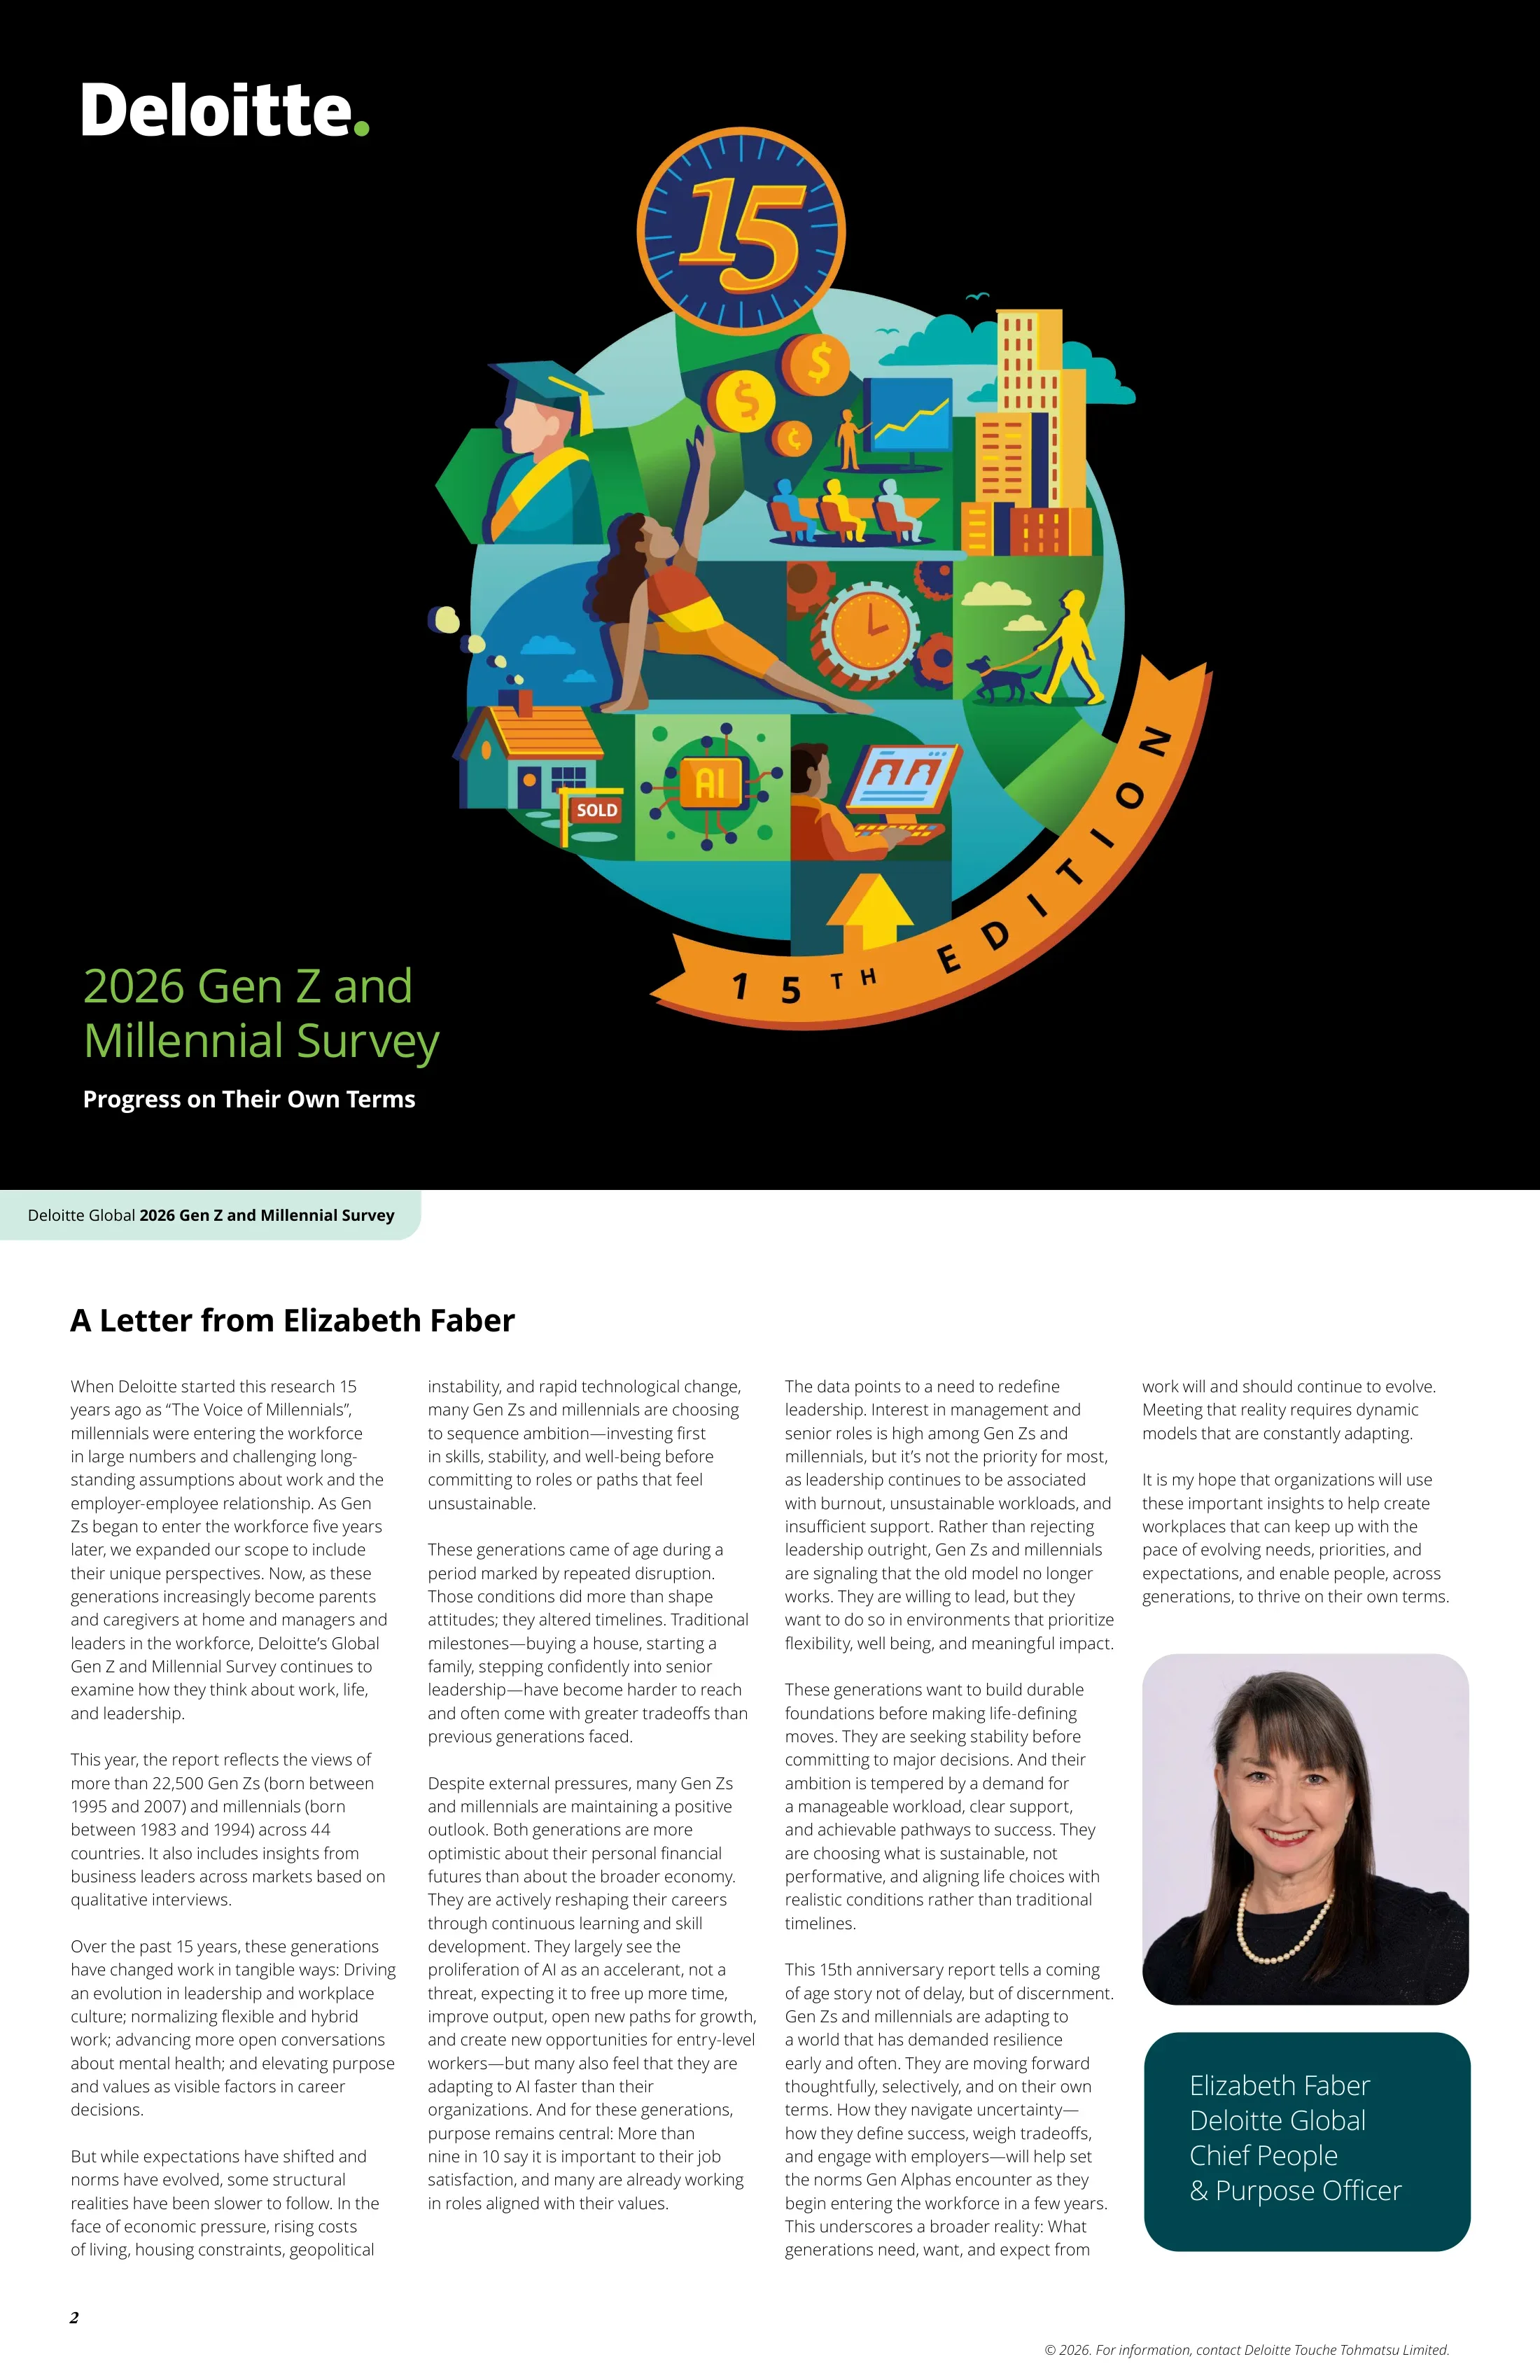
Cover of Deloitte Global's 2026 Gen Z and Millennial Survey with the subtitle 'Progress on Their Own Terms', marking the survey's 15th edition.
Full-bleed black background with the Deloitte logo top left, a large circular illustration in the center, and the title and subtitle stacked bottom left.
Foreword from Deloitte Global's Chief People & Purpose Officer explaining that the research began 15 years ago as 'The Voice of Millennials', that this edition covers more than 22,500 Gen Zs and millennials in 44 countries, and that these generations are sequencing ambition: investing in skills, stability and well-being before committing to roles that feel unsustainable.
Four narrow text columns across the page, with a portrait photo and a dark teal name card in the right column.
Summarizes three findings: cost of living is the top concern for the fifth year, with 69% of Gen Zs and 64% of millennials saying housing affects career decisions and 55%/52% delaying major life decisions; only 6% say leadership is their primary career goal, though 76% of Gen Zs and 67% of millennials are interested in senior leadership eventually and 69% feel they can drive change; and adaptability has become a core career capability.
Three text columns under the 'Executive Summary' heading, each section led by a bold action-title subheading.
AI adoption is accelerating faster than organizational readiness: 74% of Gen Zs and millennials use AI at work (up from 57% and 56%), 79% use it to find learning opportunities, and around 30% say their employer is not prepared. Mental health is improving (63% of Gen Zs and 66% of millennials rate it good, up from 52% and 58% in 2025), but about one-third feel stressed most of the time and 58%/54% report digital fatigue.
Two text columns on the left, a stacked column of a photo and colored rounded panels on the right.
Purpose and connection define the ideal workplace: 96% of Gen Zs and 97% of millennials say purpose matters to job satisfaction, about 40% have rejected an employer over ethics, and those with close work friends are more likely to plan to stay 5+ years (48% vs. 33% for Gen Zs; 61% vs. 43% for millennials). Only about half say their team could keep performing if a key expert left, as Gen Alpha approaches the workforce.
Two text columns on the left with a team photo and a mint panel on the right.
Lists the eight sections: 1 The 'Maybe Later' Reality: Financial Pressure and Delayed Decisions; 2 Leadership, Reconsidered; 3 Continuous Learning and Adaptability as a Career Strategy; 4 AI and the Readiness Gap; 5 Well-being as Infrastructure; 6 The Ideal Workplace: Where Purpose and Connection Converge; 7 The Future They're Preparing For; 8 Research methodology.
Full-bleed portrait photo with a white rounded card on the right holding the numbered chapter list under a mint header block.
Section opener for Chapter 1 on financial pressure and delayed life decisions.
Full-bleed darkened office photo with the chapter title in white top left and an oversized italic mint chapter number.
Cost of living is the top concern for the fifth consecutive year (38% of Gen Zs, 42% of millennials), ahead of crime/personal safety (19% each). 55% of Gen Zs and 52% of millennials have delayed major life decisions such as marriage, family, business or education for financial reasons; 69%/64% say housing affects career decisions and 51%/40% say they cannot afford a house.
Text block top left, dark navy callout with two ring charts top right, and a full-width 'Top concerns' ranking table below with teal (Gen Z) and green (millennial) bars.
53% of Gen Zs and 45% of millennials expect their finances to improve over the next 12 months (up from 49% and 41% in 2025). Living paycheck to paycheck fell from 52% to 47% for both; 34% of both struggle to pay living expenses (down from 37% and 35%); 51% of Gen Zs and 40% of millennials cannot afford to own a house.
Text top left, photo top right, and a full-width dark navy panel with six ring charts paired by statement.
Voice-of-respondent page with four quotes (Khalil, Rukaya, Tymon, Mel) on prices rising faster than salaries, lost buying power even on six-figure incomes, and housing being out of reach.
Dark green background with a mosaic grid of rounded mint quote cards and flat illustration tiles.
Recommends competitive pay and benefits addressing financial constraints (housing or relocation support, student debt assistance, flexible reward allocation), clear location and hybrid flexibility, and openly normalizing conversations about financial pressure.
Text column on the left with a photo and mint panel on the right.
Section opener for Chapter 2 on how Gen Zs and millennials view leadership.
Full-bleed darkened office photo, title top right, oversized mint numeral.
Most prefer steady progress over fast-paced growth. The chart shows 'I seek steady progress' at 44% Gen Z / 46% millennial (body text says 45% for millennials), fast-paced growth 25%/21%, willing to move laterally 12%/13%, prioritize flexibility and purpose 11%/14%, accept a more junior title 9%/7%.
Text top left, navy horizontal bar chart bottom left, quote card and colored panels on the right.
Only 6% of Gen Zs and millennials say a leadership position is their primary career goal. Barriers: stress and burnout (50%/49%), too much responsibility (50%/48%) and work/life balance (41%/46%). Still, 69% believe they can drive change in their organization, and only about a quarter say decisions are top-down.
Text block on the left, photo and colored panels on the right, quote card bottom right.
Reasons not pursuing leadership: stress/burnout 50% Gen Z, 49% millennial; too much responsibility 50%/48%; lack of work/life balance 41%/46%. Factors that would increase interest: higher compensation 53%/57%, flexible work 42%/44%, clearer path to leadership 36%/35%.
Two stacked ranking tables on the left with teal and green bar rows; photo and quote card on the right.
76% of Gen Zs and 67% of millennials are interested in senior leadership at some point; 80%/73% are interested in supervisory or management roles; 45% of Gen Zs and 61% of millennials already supervise others. Those already in senior roles report better mental health and work/life balance than junior staff.
Text top left, navy bar chart bottom left, two quote cards and a photo stacked on the right.
Nearly 30% of Gen Zs and about a quarter of millennials have a side job; 44% of Gen Zs and 48% of millennials with one cite financial necessity, more than a third say it builds skills and relationships, about 30% call it a hobby and roughly 25% say it lets them contribute to their community.
Short text column on the left with a portrait photo and mint panel on the right.
Quotes from Dalia, Nita, Zeina and Omar on wanting promotion on their own terms, valuing work/life balance over titles, and weighing management against staying close to hands-on work.
Dark green quote mosaic with rounded cards and illustration tiles.
Organizations should broaden what they reward beyond rapid vertical promotion, recognize lateral moves that build breadth, and redesign leadership roles so they are well supported and focused on enabling others rather than absorbing endless demands.
Text on the left; photo, quote card and blue panel stacked on the right.
Section opener for Chapter 3 on skills and adaptability.
Full-bleed darkened photo, title top left, oversized mint numeral.
Self-rated advanced skills. Gen Zs: work ethic 46%, collaboration 45%, empathy/emotional intelligence 45%, adaptability 43%, critical thinking 42%. Millennials: work ethic 51%, collaboration 49%, adaptability 46%, empathy 45%, critical thinking 45%.
Text top left, photo and quote card top right, full-width two-row skill ranking table at the bottom.
Cites Deloitte's 2026 Human Capital Trends finding that one in three workers had more than 15 major work changes in a year. Skills to develop, Gen Zs: public speaking 41%, leadership 37%, AI fluency 37%, communication 37%, creativity 37%. Millennials: AI fluency 42%, public speaking 36%, digital literacy/IT 35%, communication 35%, leadership 34%.
Text top left, photo and quote card top right, full-width ranking table below.
Gen Zs who agree vs. disagree that they share clear expectations with their manager: AI tool fluency 27% vs 19%, adaptability 46% vs 35%, time management 37% vs 28%, leadership 33% vs 21%, collaboration 47% vs 35%. Millennials: 25% vs 13%, 48% vs 35%, 42% vs 28%, 36% vs 23%, 51% vs 36%.
Tall navy chart panel on the left with two grouped bar charts (filled = agree, outlined = disagree); photo and quote card on the right.
Quotes from Gyatri, Dmitriy and Ella on continually learning and adding skills rather than only climbing the ladder.
Dark green quote mosaic with illustration and arrow tiles.
Make learning continuous and embedded in everyday work, equip managers to model curiosity and support learning in real time, and treat learning as part of performance rather than an add-on.
Text column on the left; photo and teal panel on the right.
Section opener for Chapter 4 on AI adoption and organizational readiness.
Full-bleed photo of a developer with projected code, title top left, oversized mint numeral.
74% of both generations use AI at work (from 57% and 56%). AI positively impacts personal life (83% Gen Z / 82% millennial) and work life (80%/79%); 68%/69% say AI improved what they produce and 69%/69% say it frees up time. Uses: content creation 42%/46%, data analysis 50%/53%, design and creativity 42%/43%, project management 37%/39%, strategy 38%/38%.
Text top left, navy column chart bottom left, tall navy panel of ring charts on the right.
30% of Gen Zs and 31% of millennials say their organization is not prepared for AI (up from about 20%). 62%/60% say workplace AI tools could be improved. Cites Deloitte's 2026 State of AI in the Enterprise (84% of companies have not redesigned jobs around AI) and Human Capital Trends (42% say AI's impact on culture is not evaluated). 68%/66% feel capable with AI versus 60% confidence in senior leaders.
Long text block on the left, photo and quote card on the right.
36% of Gen Zs and 34% of millennials do not trust AI outputs; 36%/38% say training is insufficient. Top barriers for Gen Zs: lack of knowledge and experience, compliance requirements, AI tools lacking creative capabilities. For millennials: lack of knowledge and experience, lack of effective training, compliance requirements.
Text top left, two side-by-side colored boxes (teal Gen Z, green millennial) listing barriers, quote card and photo on the right.
AI lets entry-level employees gain experience faster (26% Gen Z / 28% millennial), focus on higher-value tasks (25%/25%) and accelerates career growth (25%/25%); entry-level roles now need higher technical skills (24%/24%) and new entry-level roles are being created (23%/23%). About 20% report fewer entry-level hires (20%/17%).
Text top, navy horizontal bar chart below, quote card on the right.
Quotes from Ivan, Rafael, Ana and Leila expecting AI to automate routine work, shift them toward creativity and judgment, and make them orchestrators of AI-enabled teams.
Dark green quote mosaic with an AI-chip illustration.
Treat AI adoption as work redesign and change management, not a technology rollout: redesign roles and workflows, equip managers, and build trust, governance and training alongside deployment.
Text on the left, photo and mint panel on the right.
Section opener for Chapter 5 on mental health and well-being.
Full-bleed darkened photo, title top left, oversized mint numeral.
63% of Gen Zs and 66% of millennials rate mental health good or extremely good (from 52% and 58%). 34%/30% feel anxious or stressed most of the time and 48%/45% feel burned out. Top stress drivers, Gen Z: long-term financial future 44%, family health 41%, day-to-day finances 38%, relationships 36%, physical health 33%; millennials: 39%, 39%, 36%, 31%, 30%.
Text top left, photo top right, full-width ranking table below.
Job stressors, Gen Z: long working hours 51%, not recognized 47%, not enough time 46%, toxic culture 45%, unfair decisions 44%. Millennials: long hours 48%, not recognized 47%, unfair decisions 46%, restructuring 42%, not enough time 41%. Nearly 60% of Gen Zs and 54% of millennials report digital fatigue.
Text top left, quote card right, full-width ranking table at the bottom.
Employer takes mental health seriously rose from 54%/55% (2024) to 69%/69% (2026); employer has mental health policies 51%/53% to 65%/65%; confident the manager would not discriminate 57%/59% to 72%/72%; comfortable talking openly with manager 56%/59% to 68%/70% (Gen Z/millennial).
Text top left, quote card right, full-width navy panel with four small grouped column charts showing three years each with trend arrows.
71% of Gen Zs and 63% of millennials have needed time off for stress, but only 41% and 35% took it, and 21%/17% of those gave a different reason; 16% of both work through stress. Only up to a quarter consistently see managers support boundaries and well-being.
Text column on the left, yoga-class photo and quote card on the right.
Quotes from Sarah, Amira, Leslie and Julian on always-on messaging, the effect of supportive versus difficult bosses, wellness benefits and unlimited PTO, and keeping work a smaller part of one's identity.
Dark green quote mosaic with a yoga illustration.
Reduce the conditions that create stress (realistic workloads, clearer priorities, recognition), treat digital overload as a systemic risk with fewer integrated tools and protected focus time, and equip managers to spot overload early.
Text on the left; quote card and portrait photo on the right.
Section opener for Chapter 6 on purpose and belonging.
Full-bleed darkened team-meeting photo, title top right, oversized mint numeral.
96% of Gen Zs and 97% of millennials say purpose is important to job satisfaction, up 10 and 8 points over three years. Roughly 40% have rejected work or an employer on ethical grounds each year from 2023 to 2026; 54%/58% say their job is aligned with their values.
Text top left, navy ring-chart panel bottom left, photo and quote card on the right.
68% of Gen Zs and 73% of millennials say their job lets them make a meaningful contribution to society (the body text elsewhere gives 72% for millennials). Rejected an assignment/project on ethics: 41%/37%; rejected a potential employer: 41%/39%.
Two stacked navy chart panels on the left (ring charts and horizontal bars), portrait photo and quote card on the right.
69% of Gen Zs and 67% of millennials have at least one close friend at work. Hybrid workers are most likely to (73%/71%), followed by on-site (67%/65%) and remote (65%/56%).
Text top left, navy ring-chart panel bottom left, photo and quote card on the right.
Among Gen Zs, 48% with a close work friend plan to stay 5+ years vs 33% without; among millennials, 61% vs 43%. Life happiness rises from 52% to 60% (Gen Z) and 55% to 63% (millennials) with a close work friend.
Text top left, navy horizontal bar chart bottom left, photo of two colleagues on the right.
Quotes from Luca, Robert, Kristy and Monica on contributing to society, purpose outside work, happiness over pay, and employers that live their stated values.
Dark green quote mosaic with a video-call illustration.
Treat purpose and belonging as core to the employee experience, shown through everyday decisions, and design work for connection through onboarding, team design, collaboration norms and dedicated relationship time.
Text on the left, group selfie photo on the right.
Section opener for Chapter 7 on generational transition and Gen Alpha.
Full-bleed darkened portrait photo, title top left, oversized mint numeral.
By 2030 many baby boomers will have retired. 54% of Gen Zs and 60% of millennials say their team could maintain performance if a key expert retired tomorrow. Barriers to knowledge transfer: lack of incentives or recognition (32%), insufficient time (29%), confidentiality concerns (about 25%), plus missing templates and high turnover.
Text on the left, quote card and photo on the right.
Gen Alphas (born 2010-2025) are expected to enter the workforce in significant numbers between 2028 and 2030. Leaders expect them to be efficient and tech-savvy but worry that early reliance on technology could weaken critical thinking, communication and social skills; organizations should remove friction, flatten hierarchies and design AI-enabled roles that preserve foundational experience.
Text on the left, photo and two stacked quote cards on the right.
Quotes from Justina, Kari and Brian expecting Gen Alpha to be adaptable, efficient, tech-forward and entrepreneurial, with less hierarchy, but questioning whether information will translate into knowledge.
Dark green quote mosaic with a city skyline illustration.
Use the generational transition to rebuild how knowledge is shared (incentives, time, documentation tools and mentoring) and redesign roles so they build judgment, communication and collaboration alongside technical fluency.
Text on the left, photo and mint panel on the right.
The survey covered 14,384 Gen Zs and 8,211 millennials (22,595 in total) across 44 countries, collected via an online self-complete survey between 24 November 2025 and 15 January 2026. Qualitative interviews ran 18 December 2025 to 13 March 2026. Gen Z is defined as born January 1995 to December 2007 and millennials as born January 1983 to December 1994.
Full-bleed darkened photo with a large mint text card holding the methodology.
Back cover with the Deloitte logo, a description of Deloitte Touche Tohmatsu Limited and its member firms, a profile (serving nearly 90% of the Fortune Global 500, over 470,000 people in more than 150 countries and territories) and the external communications disclaimer.
White page with the logo and a narrow column of small legal text top left.
关于此幻灯片和基础演示文稿内容的常见问题。
It reports how Gen Zs and millennials think about work and life across seven chapters: financial pressure and delayed life decisions, leadership, continuous learning and adaptability, AI and the organizational readiness gap, well-being and mental health, purpose and workplace friendship, and the coming generational transition including Gen Alpha. A research methodology section closes the report.
Cost of living is the top concern for the fifth year (38% of Gen Zs, 42% of millennials). 74% of both generations now use AI at work, up from 57% and 56%, but about 30% say their employer is not prepared for AI. Only 6% say leadership is their primary career goal, although 76% of Gen Zs and 67% of millennials are interested in senior leadership eventually. Mental health is improving: 63% of Gen Zs and 66% of millennials rate it good or extremely good, up from 52% and 58%.
Deloitte Global publishes it every year. The 2026 edition, 'Progress on Their Own Terms', was released in May 2026 and is the 15th edition of research that started as 'The Voice of Millennials'. It surveyed 22,595 respondents (14,384 Gen Zs and 8,211 millennials) in 44 countries between November 2025 and January 2026.
It opens with a foreword, a three-page executive summary that uses short bold findings as subheads, and a table of contents. Each chapter then repeats the same sequence: a full-bleed photo divider with a large chapter number, data pages pairing short text with navy chart panels that compare the two cohorts in teal and green, a mosaic page of respondent quotes, and a closing 'Takeaways for business leaders' page. The repeating pattern is a good model for any long research or survey-results deck.
It mainly uses ring (donut) charts for single headline percentages, paired horizontal bar charts for Gen Z versus millennial comparisons, ranked 'top five' tables as colored bars, grouped column charts for 2024-2026 trends, and filled-versus-outlined bars to compare respondents who agree and disagree. Every chart carries the exact survey question as a footnote.
Respondents mostly see AI as helping entry-level workers: 26% of Gen Zs and 28% of millennials say it lets new employees gain experience faster, and 25% say it lets them focus on higher-value work. About 20% of Gen Zs and 17% of millennials say their organizations are making fewer entry-level hires.
Start from your survey results or written report and use 2Slides to turn the document or an outline into slides. Then follow the same structure: an executive summary with action-title headlines, chapter dividers, one chart per key statistic with the source question cited, and a takeaways slide at the end of each section.
The full PDF is published by Deloitte Global at https://www.deloitte.com/content/dam/assets-shared/docs/campaigns/2026/2026-genz-millennial-survey.pdf. Cite Deloitte as the source when you use its data.
Original full report PDF (15th edition, May 2026).

Create Your Own Slides
Turn your ideas into professional presentations in seconds with 2slides AI.
参考专业设计,选择您的风格,生成具有完美文本渲染的幻灯片。由 Nano Banana 提供支持——立即开始创建您的演示文稿。


