
所属合集: 投资者演示文稿案例 · 印度上市公司投资者演示文稿范例
Ambuja Cements Q2 FY2027 Investor Presentation (quarter ended 30 September 2026) — the Adani Group cement company's earnings deck filed with BSE/NSE on 29 October 2026, covering consolidated revenue of ₹9,197 crore, EBITDA of ₹1,271 crore (13.8% margin, ₹770 per tonne), a ₹376 crore hit from West Asia–driven energy costs, 113.5 MTPA capacity, a 29.7 MTPA expansion pipeline and the ACC/Orient Cement merger timeline.
以这份演示文稿的封面作为风格参考,用您自己的内容生成幻灯片。 也可以在下方任选一页,以它的版式作为参考。
快速导航
标签
分享幻灯片
Ambuja Cements Q2 FY2027 Investor Presentation (quarter ended 30 September 2026) — the Adani Group cement company's earnings deck filed with BSE/NSE on 29 October 2026, covering consolidated revenue of ₹9,197 crore, EBITDA of ₹1,271 crore (13.8% margin, ₹770 per tonne), a ₹376 crore hit from West Asia–driven energy costs, 113.5 MTPA capacity, a 29.7 MTPA expansion pipeline and the ACC/Orient Cement merger timeline.
每张幻灯片页面的详细视图,包括布局、关键内容和视觉元素。
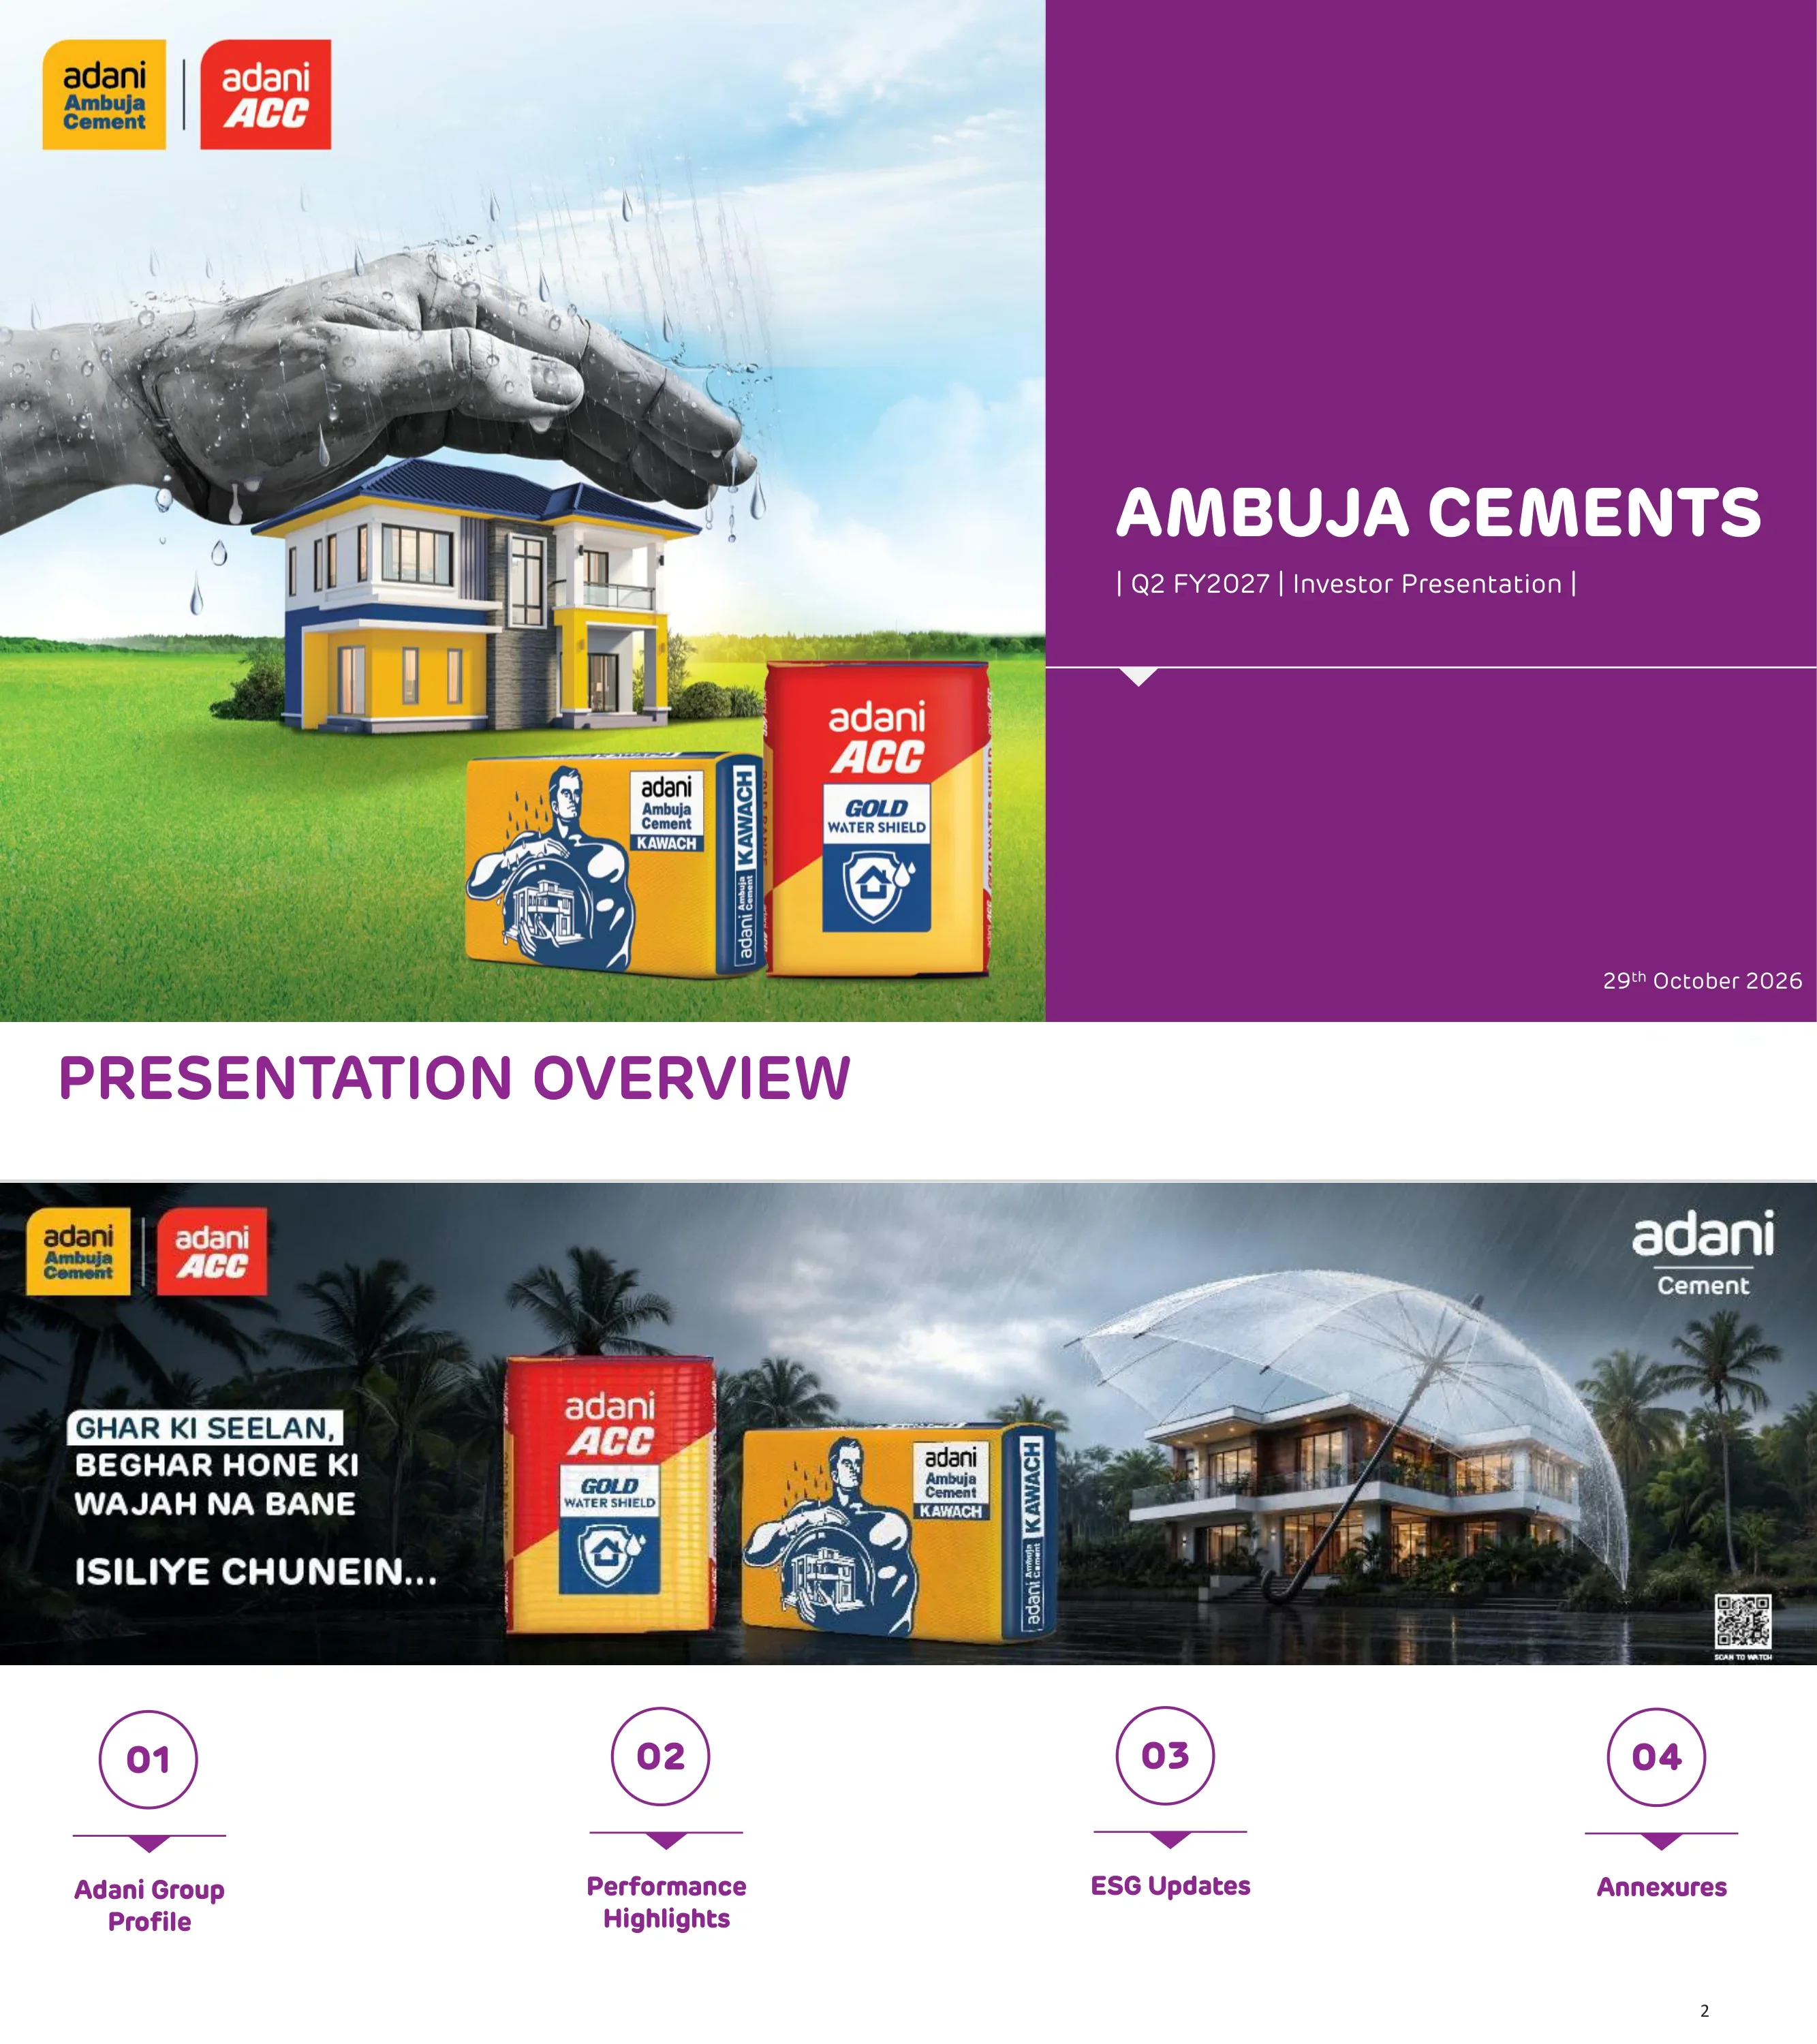
Title slide for Ambuja Cements' Q2 FY2027 investor presentation dated 29 October 2026, carrying the Adani Ambuja Cement and Adani ACC brand logos and a rain-protection campaign visual for Ambuja Kawach and ACC Gold Water Shield cement bags.
Split cover: product/campaign photograph on the left two-thirds, solid purple panel on the right with company name, deck title and date.
Agenda listing four sections — 01 Adani Group Profile, 02 Performance Highlights, 03 ESG Updates, 04 Annexures — beneath a Hindi-language advertising banner for the water-shield cement products.
Full-width campaign banner across the middle; four numbered circles with section labels in a row underneath.
Section divider introducing the Adani Group profile, illustrated with Navi Mumbai International Airport, captioned as a landmark project built using Adani Cement.
Section number and heading at top, full-bleed architectural photograph across the lower two-thirds with caption.
Group structure chart: Adani family holds 67.29% of Ambuja Cements, which owns 50.05% of ACC and 72.66% of Orient Cement; other listed companies include AEL (71.97%), AGEL (62.43%), APL (74.96%), APSEZ (66.03%), AESL (73.39%), ATGL (37.40%) and NDTV, framed as a multi-decade infrastructure and utility growth story.
Org-chart grid with four column headers (Flagship, Infrastructure & Utility Core, Primary Industry, Other), company boxes with ownership percentages, and a pink outline around AEL subsidiaries; dense footnotes.
Area chart of Adani portfolio EBITDA rising from ₹24,870 crore in FY19 to ₹94,834 crore in FY26 (21% CAGR), with cash after tax (FFO) of ₹67,995 crore (27% CAGR); an India map plots asset locations by company, and a callout cites a 375 million user base on the core infrastructure platform.
Two panels: stacked area chart left, dotted India map with company legend right, plus a blue stat tile.
Describes the group's development → operations → consumers model (origination, site development, construction, O&M), citing India's largest commercial port at Mundra, the longest private HVDC line in Asia and the world's largest renewable cluster at Khavda, plus long-term debt mix shifting from 55% PSU banks in March 2016 to a diversified Mar'26 mix.
Matrix with row labels (Activity, Performance, Capital Management, Enabler) and three column stages; photo strip, two donut charts and bullet text.
Section divider for performance highlights, illustrated with an aerial photo of the Ganga Expressway, a landmark project built using Adani Cement.
Heading with numbered circle at top, full-width aerial photograph below.
Plant map of Ambuja, ACC and Orient integrated plants, grinding units and bulk terminals, with Q2 FY27 operating facts: 113.5 MTPA cement capacity, 66.3% clinker factor, 24 integrated and 24 grinding units, 82% blended cement share, 125 ready-mix plants, 10 bulk terminals, 11 captive ships, 7.3% thermal substitution rate, 125,000+ channel partners, 973 MW green power and 228 MW WHRS capacity.
India map with labelled plant markers on the left; two-column grid of twelve KPI tiles on the right under a purple header.
Current capacity 113.5 MTPA after +4.6 MTPA commenced commercial production in Q2 FY27 — Dahej grinding unit (+1.2, Ambuja), Salai Banwa greenfield grinding unit (+2.4, ACC) and Kalamboli blending unit (+1.0, ACC); H2 FY27 pipeline of +5.6 MTPA (Bathinda 1.2 and Jodhpur Penna 2.0 ramping up, Warisaliganj 2.4 to be commissioned) and a 4.0 MTPA Maratha clinker line expected in Q1 FY28.
Four headline stat tiles across the top, three project cards with brownfield/greenfield badges, and a pipeline panel on the right.
Table of 14 projects adding 10.3 MTPA clinker and 29.7 MTPA cement capacity, from Maratha Line 2 (4.0 MTPA clinker, May'27) and Amravati (2.9 MTPA, Sep'27) to Assam, Mundra, Godda, Muzaffarpur, Hazira, Raigad, Kalyan, Dahanu and Dadri Line 2 by Mar'28–Dec'28; cement additions by region are West 15.2, East 11.6 and North 2.9 MTPA.
Wide data table on the left (unit, source, type, state, clinker, cement, completion), summary tiles and horizontal bar charts by region on the right.
Firmed-up expansion takes capacity from 68 MTPA at acquisition to 113 MTPA (Sep'26), 119 MTPA (FY27 target) and 155 MTPA by FY30 including debottlenecking; green power rises from 123 MW at acquisition to 1,201 MW now and 1,498 MW targeted by FY28 (61% share in Q2 FY27); cost per tonne moves from ₹4,447 (Mar'26 quarter) to ₹4,410 in Q2 FY27, ~₹4,250 for FY27E and ~₹4,000 for FY28E.
Banner headline, capacity bar chart left, clustered green-power bar chart with share table right, and a cost-reduction timeline along the bottom.
Timeline of the 'One Cement Platform' amalgamation of ACC and Orient Cement into Ambuja: board approval 22 Dec'25, stock-exchange NOCs 4 Jun'26, NCLT first-motion orders in July 2026, shareholder approvals 28–29 Sep'26, with final NCLT sanction and completion expected by January 2027; benefits cited are a simpler structure and operating synergies.
Horizontal milestone timeline with check-mark circles and a pending gavel icon, followed by two text cards with icons.
Macro and policy backdrop: RBI raised FY27 inflation forecast to 5.2% and GDP growth to 7.1%; tailwinds include blended-cement policy, CCTS, rail-freight reform and GST on cement cut from 28% to 18%; demand drivers include PMAY, Gati Shakti (352 projects worth ₹16.1 lakh crore) and data centres; FY27 cement demand growth is estimated at 6–7% with an elevated cost environment; demand split is 55% housing, 30% infrastructure, 15% commercial.
Three image-headed text columns on top; donut chart and two outlook callouts on the bottom row.
Line charts show imported petcoke rising from US$115/t (Sep'25) to US$188/t (Oct'26), South African coal from US$83/t to a peak of US$121/t, and the rupee weakening from 88.8 to about 95 per US dollar; commercial diesel rose 25–30% in six months and the escalated geopolitical impact was about ₹228 per tonne in Q2 FY27.
Three line-chart panels across the top, full-width 'Key Impact & Mitigation' bullet box below.
H1 FY27 vs H1 FY26: sales volume 33.6 vs 35.0 million tonnes, NSP ₹256 vs ₹259 per bag, cement cost ₹4,324 vs ₹4,244 per tonne, EBITDA ₹852 vs ₹1,064 per tonne, trade sale 76% vs 71%, clinker factor 65.0% vs 66.4%, EBITDA margin 15.3% vs 19.1% (18.3% and ₹1,018 PMT excluding geopolitical impact); premium products reached 35% of trade sales.
Four bar-chart tiles on top, three percentage-comparison tiles below, purple summary banner and footnote.
Q2 FY27 vs Q1 FY27 vs Q2 FY26: volume 16.5 / 17.1 / 16.6 million tonnes, NSP ₹255 / 257 / 258 per bag, cement cost ₹4,410 / 4,241 / 4,155 per tonne, EBITDA ₹770 / 931 / 1,061 per tonne, trade sale 74%, clinker factor 66.3%, EBITDA margin 13.8% (17.9% and ₹998 PMT excluding geopolitical impact); premium products at 37% of trade sales.
Same dashboard grid as the H1 slide with three-period bar charts and percentage tiles.
Six investment highlights: 113.5 MTPA capacity after +4.6 MTPA in Q2; 14 projects adding 29.7 MTPA cement and 10.3 MTPA clinker; cost targets of ₹4,250 PMT in FY27 and ₹4,000 PMT in FY28; digitalisation (geo-intelligent mapping, Gen-AI sales and payment automation); market leadership with 74% trade share, 82% blended cement and 37% premium share (target 40%); and AAA/A1+ credit ratings from CRISIL, CARE, India Ratings and ICRA.
Two rows of three numbered cards, each with a purple header, a large headline figure and supporting bullets.
Cement volumes of 16.5 million tonnes in Q2 FY27 (−1% YoY from 16.6), with trade sale share up 6 pp to 74%, blended cement 82% and premium cement 37% of trade sales; trade volumes grew 8.6% YoY as low-margin institutional volumes were rationalised.
Volume bar chart on the left, three small bar charts for trade, blended and premium mix on the right, commentary bullets beneath.
Revenue ₹9,197 crore in Q2 FY27 (flat YoY vs ₹9,175 crore; ₹9,500 crore in Q1), NSP ₹255 per bag (−1%), EBITDA including RMX ₹1,271 crore (−28% from ₹1,762 crore) and EBITDA ₹770 per tonne (−27%); management cites elevated fuel, logistics, diesel and packaging costs and expects volumes to grow ahead of the industry in H2 FY27.
2×2 grid of bar charts with YoY change brackets and a dashed commentary box on the right.
Raw material cost fell 28% YoY to ₹573 per tonne (H1: −15% to ₹624) on source-mix optimisation and BCFC fly-ash transport; power and fuel rose 13% to ₹1,463 per tonne (H1: +4% to ₹1,386) on global coal prices, with kiln fuel at ₹1.87/kcal and green power share up to 61%.
Two bar-chart panels on the left (quarterly and half-year), two line charts and two commentary boxes on the right.
Freight and forwarding rose 5% YoY to ₹1,290 per tonne and other expenses 18% to ₹944 per tonne, driven by packaging costs hit by the West Asia war and maintenance from planned kiln shutdowns; direct dispatch was 57% and primary lead 254 km, with plans to cut secondary lead from 38 km to 30 km and run 150 EV trucks by December 2027.
Left column of two bar-chart panels; right side has a dual line chart, a bullet list of logistics initiatives and a checklist commentary box.
Results table: Q2 FY27 volume 16.5 MnT, revenue ₹9,197 crore (0% YoY), EBITDA ₹1,271 crore (−28%), margin 13.8% (−5.4 pp), EBITDA ₹770/t, reported PAT ₹236 crore (−90% vs ₹2,336 crore), normalised PAT ₹300 crore (−54%), diluted EPS ₹0.78; H1 FY27 revenue ₹18,697 crore, EBITDA ₹2,860 crore, reported PAT ₹896 crore and normalised PAT ₹895 crore.
Full-width financial table with quarter-ended and half-year-ended column groups and YoY/QoQ change columns.
Reconciles reported to normalised PAT: Q2 FY27 reported ₹236 crore plus ₹85 crore voluntary severance scheme cost less ₹21 crore tax impact gives ₹300 crore; the Q2 FY26 base of ₹2,336 crore included a ₹1,697 crore income-tax provision reversal and ₹205 crore interest on income tax, normalising to ₹652 crore.
Reconciliation table with Add/Less sections across five period columns and a boxed footnote area.
Waterfall from Q2 FY26 EBITDA of ₹1,762 crore to Q2 FY27 ₹1,271 crore: maintenance −₹17 crore, volume −₹18 crore, price −₹80 crore and geopolitical impact −₹376 crore, which drove about 77% of the ₹490 crore decline.
Waterfall chart on the left two-thirds, 'Key takeaways' panel with large red decline figure on the right.
Volume build-up by company: Ambuja (incl. Sanghi, Penna) 11.5, ACC (incl. Rajpura) 9.9 and Orient 1.5 million tonnes for gross cement sales of 22.9 MnT in Q2 FY27, less 6.4 MnT intra-group MSA sales, giving net cement sales of 16.5 MnT and net CLC volume of 16.7 MnT.
Single table with three quarterly columns and shaded subtotal rows.
H1 FY27 cash-flow synopsis: operating cash flow ₹2,916 crore, financing outflow ₹737 crore (including ₹569 crore dividend), investing outflow ₹2,879 crore driven by ₹2,963 crore capex; cash fell from ₹1,770 crore to ₹1,070 crore, and the company remains debt free with AAA (Stable)/A1+ ratings.
Cash-flow table on the left, three-bar cash balance chart on the right, purple banner at the bottom.
Section divider for ESG, illustrated with the Chenab Railway Arch Bridge, a landmark project built using Adani Cement.
Heading at top with numbered circle, full-width photograph below.
ESG ratings for Ambuja and ACC: S&P CSA net scores 80 and 82, CDP B/A/A and A/A/A, Sustainalytics risk 21.4 (rank 7/109) and 21.0 (6/109), MSCI BBB for Ambuja, CareEdge ESG 1+ (80.3 and 84.1), CRISIL 60 and 62, NSE 61 and 68; strategy is continued engagement with rating agencies and better disclosure.
Intro bar, three headline stat cards, a ratings table with agency logos, and a 'Strategic implication' footer.
Q2 ESG KPIs: scope 1 CO₂ of 584 kg/t (Ambuja, −2.7% YoY) and 541 (ACC); green power 30.3% (Ambuja; 61% at consolidated level including sold power) and 34.4% (ACC); waste-derived resources 2.41 and 2.17 million tonnes; water positive 24.7x and 5.46x; trees planted 2.48 and 4.60 million; CSR outreach 3.72 and 2.76 million people.
2×3 grid of KPI cards, each with a theme tag, metric name and Ambuja/ACC values with YoY arrows.
Governance overview: committee matrix showing independent-director composition and chairs, more than 50% independent directors and 100% of statutory committees chaired by IDs; board of five independent directors (Purvi Sheth, Ameet Desai, Rajnish Kumar, Maheshwar Sahu, Praveen Garg) and non-independent directors Gautam Adani (Chairman), Karan Adani and Vinod Bahety (WTD and CEO).
Committee checklist table and governance-pathway box on the left; board of directors portrait grid on the right.
Q2 FY27 CSR results: 55 water-harvesting structures and 40.89 micro-irrigation coverage; 125 agriculture trainings and 3,057.905 biomass supplied to Ambuja plants; 47 new self-help groups and 1,420 youth trained; 19,872 truckers and allied population reached, 4,577 screened for NCDs and 527 WASH sessions.
Four photo-headed columns (Water, Agriculture, Livelihood, Health & WASH) with stacked figures, plus a summary bullet box.
Three event photos: industry partnerships with CREDAI and NAREDCO, a long-service awards ceremony, and the annual dealer conference strengthening channel relationships.
Three equal photo columns with headings and captions.
Awards in the quarter: 10 awards at the CII 27th Energy Excellence Summit 2026, three ET Digi+ awards for marketing and branded content, and 11 awards at the 8th ICC Occupational Health & Safety Awards 2026.
Three award collages with captions beneath.
Section divider for the annexure, set over a photo of the Samruddhi Highway.
Full-bleed highway photograph with a centred white title box and numbered circle.
P&L for FY26 and H1 FY27: revenue ₹40,656 crore and ₹18,697 crore, total operating expenses ₹34,117 crore and ₹15,837 crore, operating EBITDA ₹6,539 crore and ₹2,860 crore, reported PAT ₹5,637 crore and ₹896 crore, normalised PAT ₹2,647 crore and ₹895 crore; H1 insights list 33.6 MnT volume, ₹852/t EBITDA and 15.3% margin.
P&L table with dotted row separators on the left, H1 insight figures in a sidebar on the right.
Balance sheet at 31 Mar 2026 and 30 Sep 2026: total assets ₹89,607 crore and ₹91,564 crore, including PP&E ₹34,711 crore, CWIP ₹9,727 crore and goodwill ₹13,546 crore; total equity ₹72,238 crore and borrowings only ₹55 crore at 30 Sep 2026.
Dense two-column balance-sheet table with section headings for assets, equity and liabilities.
Ambuja standalone Q2 FY27: volume 11.4 MnT, revenue ₹6,121 crore (+10% YoY), EBITDA ₹746 crore (+3%), margin 12.2%, EBITDA ₹653/t, reported PAT ₹114 crore (−90%), EPS ₹0.46; H1 FY27 revenue ₹12,449 crore and EBITDA ₹1,681 crore; prior periods restated for the Sanghi and Penna mergers.
Same quarter/half-year results table format as the consolidated slide, with a restatement note.
Standard forward-looking statements disclaimer: the presentation is not an offer of securities, Ambuja makes no warranty on accuracy, information is current only as of the date, and securities may not be sold in the United States without registration under the US Securities Act of 1933.
Single rounded grey text box filling the slide under the title.
Closing slide with Ambuja Cements Limited's registered office (Adani Corporate House, Shantigram, Ahmedabad), website, CIN and the Head of Investor Relations as contact, over a photo of the Bandra–Worli Sea Link.
Full-bleed bridge photograph with a purple contact panel at lower left and brand logos at top.
关于此幻灯片和基础演示文稿内容的常见问题。
For the quarter ended 30 September 2026, consolidated revenue was ₹9,197 crore (flat YoY), EBITDA was ₹1,271 crore (down 28%) at a 13.8% margin, EBITDA per tonne was ₹770, and reported PAT was ₹236 crore (₹300 crore normalised) on sales volume of 16.5 million tonnes.
The EBITDA bridge on slide 24 attributes the ₹490 crore YoY decline mainly to a ₹376 crore impact from geopolitical energy costs linked to the West Asia war (higher petcoke, coal, diesel and packaging prices), plus ₹80 crore from price, ₹18 crore from volume and ₹17 crore from maintenance. Excluding that impact, Q2 EBITDA margin would have been 17.9%.
It is Ambuja Cements' 'Q2 FY2027 Investor Presentation' dated 29 October 2026, filed with the Indian stock exchanges (BSE/NSE). Indian fiscal year FY27 runs from April 2026 to March 2027, so Q2 FY27 is July–September 2026. The exchange cover letter has been removed from this copy.
Capacity stood at 113.5 MTPA after 4.6 MTPA was commissioned in Q2 FY27. A further 5.6 MTPA is due in H2 FY27, and 14 awarded projects add 29.7 MTPA of cement and 10.3 MTPA of clinker capacity, taking the company to 149 MTPA and about 155 MTPA by FY30 with debottlenecking.
Shareholders approved both amalgamation schemes on 28–29 September 2026. The 'One Cement Platform' now awaits final NCLT sanction, with completion expected by January 2027.
Yes. Financials are in ₹ crore (Rs Cr), unit economics in ₹ per tonne (PMT), selling price in ₹ per bag, and volumes and capacity in million tonnes (MnT) and million tonnes per annum (MTPA).
Yes. The page offers the original PDF and a PPTX version converted from it, so you can reuse layouts such as the KPI dashboards, EBITDA waterfall, capacity pipeline table and PAT reconciliation in your own earnings or investor deck. The PPTX is a machine conversion, so check fonts and charts after opening.
Investors and analysts following Indian cement and Adani Group companies, finance students learning how Indian listed companies present quarterly results, and IR or strategy teams looking for a clear template for unit economics, cost bridges and capacity roadmaps.
Original exchange filing including the cover letter.

Create Your Own Slides
Turn your ideas into professional presentations in seconds with 2slides AI.
参考专业设计,选择您的风格,生成具有完美文本渲染的幻灯片。由 Nano Banana 提供支持——立即开始创建您的演示文稿。


