
Thuộc bộ sưu tập Ví dụ bài thuyết trình cho nhà đầu tư · Mẫu thuyết trình nhà đầu tư Nhật Bản
Tokuyama Corporation H1 FY2026 (fiscal year ending March 2027) earnings presentation: results for April–September 2026, a revised full-year forecast reflecting the sale of the domestic cement and soil-stabilizer sales business, dividend outlook, and progress on the Medium-Term Management Plan 2030. This is a Japanese-language deck (決算説明会資料) published on TDnet, the Tokyo Stock Exchange's timely-disclosure system, on October 29, 2026; all amounts are in ¥100 million (億円).
Dùng trang bìa của bài trình bày này làm mẫu phong cách cho các slide tạo từ nội dung của bạn. Hoặc chọn bất kỳ trang nào bên dưới để lấy bố cục của trang đó làm tham chiếu.
Điều Hướng Nhanh
Thẻ
Chia sẻ slide
Tokuyama Corporation H1 FY2026 (fiscal year ending March 2027) earnings presentation: results for April–September 2026, a revised full-year forecast reflecting the sale of the domestic cement and soil-stabilizer sales business, dividend outlook, and progress on the Medium-Term Management Plan 2030. This is a Japanese-language deck (決算説明会資料) published on TDnet, the Tokyo Stock Exchange's timely-disclosure system, on October 29, 2026; all amounts are in ¥100 million (億円).
Xem chi tiết từng trang slide, bao gồm bố cục, nội dung chính và các phần tử trực quan.
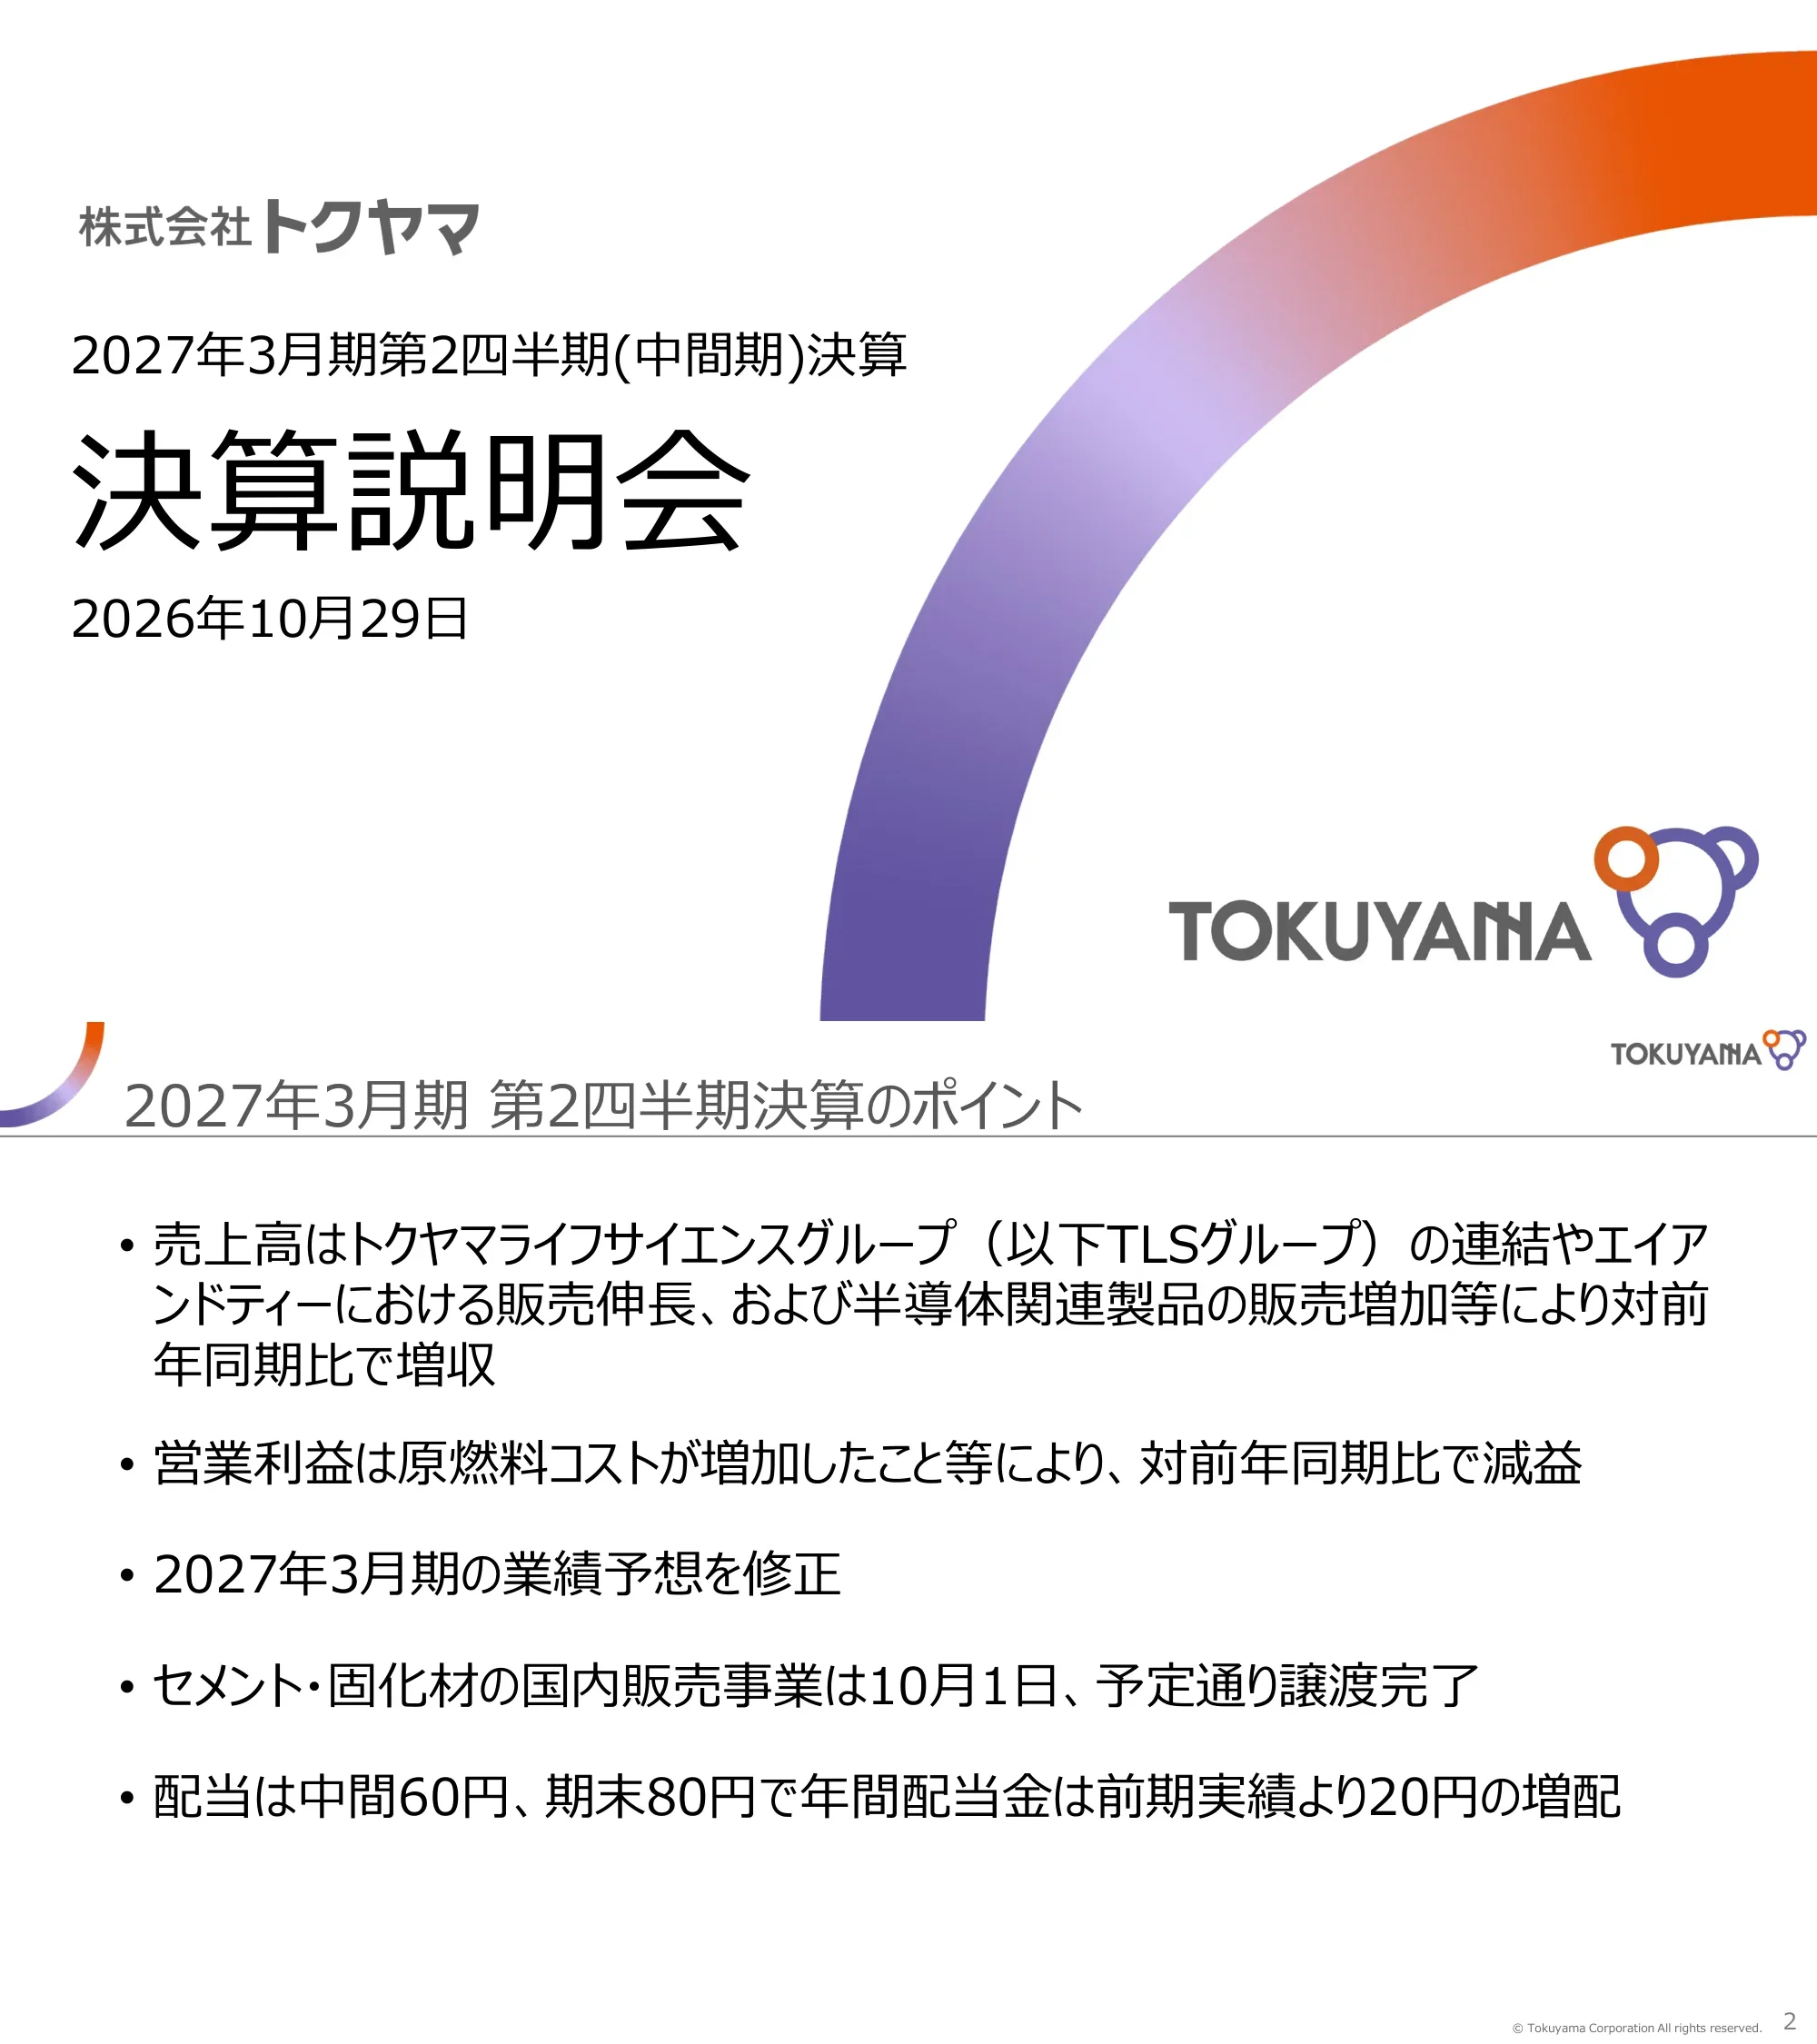
Title slide reading 'Tokuyama Corporation — Results for the Second Quarter (Interim Period) of the Fiscal Year Ending March 2027 — Financial Results Briefing (決算説明会)', dated October 29, 2026.
Left-aligned title stack (company name, period line, large 決算説明会 heading, date) on white, with a large purple-to-orange gradient arc sweeping across the right half and the TOKUYAMA logo bottom right.
Five headline bullets: net sales rose year on year on the consolidation of the Tokuyama Life Science (TLS) group, sales growth at A&T and higher semiconductor-related product sales; operating income fell on higher raw material and fuel costs; the full-year forecast was revised; the domestic cement and soil-stabilizer sales business was transferred as planned on October 1; dividend set at ¥60 interim and ¥80 year-end, a ¥20 increase in the annual dividend over the prior year.
Single-column bulleted list in large type under a title bar, with the brand arc fragment in the top-left corner.
Agenda: 1. Q2 FY2027/3 results (highlighted), 2. FY2027/3 forecast, 3. Topics, plus Appendix (補足資料).
Full-bleed purple background with translucent arc shapes; numbered agenda list with the current section bold and underlined.
H1 net sales ¥1,786 (100M yen) vs ¥1,637, up ¥149 (+9%); cost of sales ¥1,179; SG&A ¥471; operating income ¥135 vs ¥191, down ¥55 (−29%); ordinary income ¥135 vs ¥189 (−28%); extraordinary items +¥12 vs −¥11; profit before tax ¥148; interim net income attributable to owners ¥99 vs ¥121 (−18%). EPS ¥139.26 vs ¥168.81; FX ¥159/$ vs ¥146/$; domestic naphtha ¥107,700/kl vs ¥64,600/kl. Drivers listed: TLS consolidation and semiconductor product sales (+), raw material/fuel costs (−), gain on sale of investment securities (+).
Five-column table (line item, prior H1, current H1, change in amount and %, main factors) with key profit lines in bold blue; light-blue header band.
Total assets ¥5,904 (100M yen) at end-September 2026 vs ¥5,696 at end-March (+207) on higher inventories and PP&E; shareholders' equity ¥2,882 (+51); equity ratio 48.8% (−0.9pt); interest-bearing debt ¥1,655 (+35) on short-term borrowings; D/E ratio 0.57 and net D/E ratio 0.41, both unchanged; book value per share ¥4,053.86 vs ¥3,934.76.
Balance-sheet comparison table with March-end, September-end, change and main factors; footnote defines net D/E ratio.
H1 segment sales and operating income (100M yen): Chemicals 527 / 16 (OI −39, −70%); Cement 332 / 42 (OI −5); Electronic & Advanced Materials 465 / 67 (sales +39, +9%; OI −2); Life Science 290 / 53 (sales +97, +51%; OI +12, +32%); Eco Business 25 / 0; Others 207 / 8. Segment total 1,848 / 189; eliminations and corporate −61 / −53; consolidated 1,786 / 135.
Wide segment table with color-coded segment markers (blue, navy, orange, pink, green, grey) and a dark-teal consolidated total row.
Waterfall from H1 prior-year operating income of 191 to 135: raw material and fuel unit prices −89 (higher naphtha), volume +12 (Electronic & Advanced Materials and Life Science volume up, chemical volume down), selling prices +76 (higher petrochemical prices), unit consumption/operating rate and other −24, other −29.
Horizontal waterfall chart with dark-teal start and end bars and light-blue floating delta bars, each annotated with its driver.
Chemicals sales 527 vs 523, operating income 16 vs 56; margin fell from 10% to 3%. Quarterly sales 248, 268, 270, 246, 280 and OI 28, 21, 18, 5, 11 (25.2Q–26.2Q). Environment: Middle East-related naphtha procurement issue resolved in Q1; Q2 naphtha price as assumed but procurement prices stay high thereafter; PVC exports weak. Caustic soda, VCM, PVC and soda ash/calcium chloride all saw lower profit on higher manufacturing and logistics costs.
Left: blue segment tab, YoY paired bar chart with margin line, five-quarter bar chart below. Right: business environment and qualitative notes by product.
Cement sales 332 vs 324, operating income 42 vs 48; margin 14% vs 18%. Quarterly sales 163, 178, 166, 160, 171 and OI 23, 24, 22, 25, 17. Domestic demand remains weak and coal and logistics unit costs are rising; domestic shipments fell but price revisions secured sales, while higher manufacturing costs cut profit.
Same template as page 8 with navy segment tab and navy/light-blue bars.
Semiconductor industry stays strong, led by AI; the key is when this spreads upstream. Polysilicon for semiconductors: downstream wafer shipments growing but digestion of polysilicon inventory in the supply chain is key, with supply-demand balance expected to improve in 2027–28. IC chemicals growing but passing through higher raw-material costs is lagging. Fumed silica growing for CMP. Thermal-management materials growing, mainly for semiconductor equipment.
Orange segment tab, headline statement, then a two-column product/environment table; CMP footnote.
Sales 465 vs 425, operating income 67 vs 69; margin 17% vs 20%. Quarterly sales 213, 208, 282, 223, 242 and OI 41, 34, 52, 31, 36. Polysilicon profit fell on lower volume and larger inventory valuation losses; IC chemicals profit fell despite higher high-purity IPA volume due to raw-material costs; fumed silica profit rose on solid volume and cost reductions at Tokuyama Chemicals (Zhejiang); thermal-management materials profit rose on solid volume for semiconductor equipment.
Segment template in orange: YoY bars with margin line, quarterly bars, qualitative notes by product on the right.
Sales 290 vs 192, operating income 53 vs 40; margin 22% vs 26%. Quarterly sales 101, 143, 157, 146, 143 and OI 23, 16, 21, 26, 26. Dental materials growing in emerging markets after Europe and the US; diagnostics firm in Japan with China recovering; new plastic-lens materials launched, expected to contribute from H2. Dental profit up on solid sales and FX; diagnostics profit up on TLS group consolidation and clinical lab system sales at A&T.
Segment template in pink with environment bullets and qualitative notes.
Sales 25 vs 26, operating income 0.5 vs 2; margin 2% vs 11%. Quarterly sales 12, 15, 19, 10, 14 and OI 0, 1, 2, △0, 1. Ion-exchange membrane profit fell on lower membrane and equipment shipments; waste gypsum board recycling improved on steady collection.
Segment template in green with qualitative notes only on the right.
Agenda divider highlighting section 2, FY2027/3 forecast.
Purple section divider identical to page 3 with section 2 bold and underlined.
Reason for revision: the transfer of the domestic cement and soil-stabilizer sales business is reflected in the H2 forecast; ¥370 (100M yen) consideration and ¥320 gain on sale are fixed, and an impairment loss of about ¥120 on the cement business will be booked. Cement segment sales and profit decline, but higher Life Science sales and Others profit leave sales and operating income unchanged from the original forecast. Assumptions: FX H1 actual ¥159/$, H2 ¥160/$ (unchanged); domestic naphtha H1 actual ¥107,700/kl, H2 raised from ¥82,000/kl (July 29) to ¥92,000/kl (October 29).
Text explanation paragraphs followed by a two-row assumption table (FX, naphtha) in blue tones.
Revised FY2027/3 forecast versus the July 29, 2026 forecast: net sales ¥3,920 (unchanged), operating income ¥340 (unchanged), ordinary income ¥340 (unchanged), net income attributable to owners ¥465 vs ¥260 (+205, +79%) on the cement-business transfer gain net of impairment. EPS ¥648.80 vs ¥361.38. FX H1 actual 159, H2 160; naphtha H1 actual 107,700, H2 assumption 92,000 (previous: Q1 actual 116,500, Q2–Q4 86,000).
Forecast comparison table with red-boxed callout 'Revised from July 29, 2026 forecast'; driver column on the right.
Waterfall from FY2026/3 actual operating income of 370 to a forecast 340: raw material and fuel unit prices −218 (higher naphtha), volume +37 (Electronic & Advanced Materials and Life Science volume up), selling prices +195 (higher petrochemical prices), unit consumption/operating rate and other −24, other −21.
Waterfall chart in the same style as page 7.
Revised segment forecasts (sales / OI, 100M yen): Chemicals 1,200 / 95 (OI −5); Cement 600 / 55 (sales −70, OI −15); Electronic & Advanced Materials 1,080 / 160 (sales +15); Life Science 670 / 120 (sales +40, OI +5); Eco Business 70 / 5; Others 430 / 20 (OI +5). Segment total 4,050 / 455; eliminations −130 / −115; consolidated 3,920 / 340, unchanged.
Segment table matching page 6 with red revision callout and dark consolidated footer.
Policy: stable, continuous dividends targeting DOE of 4% (FY2030). FY2027/3 interim dividend paid as planned at ¥60; year-end planned at ¥80, an increase. Six-year table (fiscal 2021–2026): interim 35.0, 35.0, 35.0, 50.0, 60.0, 60.0; year-end 35.0, 35.0, 45.0, 50.0, 60.0, (80.0); payout ratio 18.0, 53.8, 32.4, 30.8, 38.9, (21.6)%; DOE 2.4, 2.3, 2.5, 2.9, 3.3, (3.4)%.
Policy headline, shaded callout with two bullets, then a dividend history table with the forecast year in blue.
Agenda divider highlighting section 3, Topics.
Purple section divider with section 3 bold and underlined.
Profile of the acquiring entity: Tokuyama Taiheiyo Co., Ltd., Bunkyo-ku, Tokyo, President Tetsuro Isomura; subsidiaries Tokuyama Tsusho and Tokuyama M-Tech; 48 seconded employees. On the transfer gain: ¥370 (100M yen) consideration received on completion, consolidated adjustments, then a ¥320 gain on sale booked in Q3; details refer to the October 1, 2026 disclosure.
Left: two-column company profile table in blue shades. Right: boxed flow diagram with down arrows explaining the gain recognition.
Three cards: 01 Financial impact — ¥370 (100M yen) consideration and ¥320 gain to be booked in Q3, with an impairment loss of about ¥120 on cement-related assets. 02 Post-transfer operations — OEM supply of cement and soil stabilizer manufactured by Tokuyama for the domestic market to Taiheiyo Cement started October 1. 03 Scope — succession of logistics assets such as tankers, contracts and shares of related subsidiaries is under discussion with Taiheiyo Cement.
Three equal numbered cards with left accent bars, category tags and bold headline plus supporting bullet.
Progressing as planned. Semiconductor polysilicon: Tokuyama Vietnam processing/cleaning to start FY2027 and OTSM (Malaysia, equity-method) deposition to start FY2028, raising capacity about 50% combined. Thermal-management aluminum nitride: granules start February 2028 (+50%) and powder April 2028 (+30%) at the Advanced Technology Commercialization Center (Yamaguchi). IC chemicals: IPA at FTAC (Taiwan) phase 2 from September 2028 (+100%), a recovered-IPA plant at FTAC from H2 FY2027, and TMAH at Hantok Chemical (Pyeongtaek, Korea, equity-method) from September 2027, aiming for 50% more capacity in the future.
Three horizontal bands by product line, each with teal rounded start-date badges paired with site names and capacity increases.
Closing brand slide with the corporate slogan 'もっと未来の人のために' (roughly 'For the people of the future') above the TOKUYAMA logo.
Centered slogan and logo on a white background.
Section divider titled 補足資料 (Appendix).
Purple full-bleed divider with translucent arcs.
Extended P&L: net sales 1,786 vs 1,637; operating income 135 vs 191; ordinary income 135 vs 189; extraordinary items 12 vs △11; profit before tax 148 vs 178; income taxes 49 vs 56; non-controlling interests △0; interim net income attributable to owners 99 vs 121 (−21, −18%).
Summary P&L table with change in amount and %, profit lines highlighted in bold blue.
Total assets 5,904 vs 5,696 (+4%): current assets 2,261, PP&E 1,946, intangibles 746, investments and other 950. Total liabilities 2,829 vs 2,718 (+4%): current 1,323, non-current 1,506. Net assets 3,075 vs 2,978 (+3%).
Two stacked tables (assets; liabilities and net assets) with March-end, September-end and change columns.
Non-operating income 41 vs 32 (interest and dividends 7, other 33); non-operating expenses 41 vs 34 (interest paid 10 vs 5, other 30); net non-operating △0 vs △2. Extraordinary income 16 vs 7; extraordinary losses 3 vs 18; net extraordinary 12 vs △11. Net financial income △3 vs 0.
Grouped table with light-blue income blocks and teal expense blocks.
Capex: H1 141 vs 120, full-year forecast 409 vs 327 actual; depreciation H1 117 vs 98, full year 242 vs 209; R&D H1 94 vs 81, full year 213 vs 177.
Simple table with prior-year H1/full-year actuals, current H1 actual/full-year forecast and change columns.
Full-year capex forecast cut from 461 (original) to 409 (△52); depreciation 238 to 242; R&D unchanged at 213; H1 actuals 141, 117 and 94. A stacked horizontal bar chart compares the segment mix of capex between the July 29 and October 29 forecasts. Main reasons for the cut: FTAC phase 2 expansion spending carried into the next year and a review of the investment plan following the cement business transfer.
Table on top with framed revised-forecast columns; stacked horizontal bars below left; boxed list of main reduction factors at right.
Net sales for fiscal 2017–2025 with domestic/overseas split: 3,080, 3,246, 3,160, 3,024, 2,938, 3,517, 3,419, 3,430, 3,494, and a fiscal 2026 forecast of 3,920 (overseas peaked at 1,017 in 2022). Operating income line: 412, 352, 342, 309, 245, 143, 256, 299, 370, forecast 340; net income attributable to owners: 196, 342, 199, 245, 280, 93, 177, 233, 222, forecast 465.
Upper stacked column chart for sales; lower dual-line chart for operating and net income with dashed forecast segments.
Quarterly consolidated sales for fiscal 2025 Q1–Q4 and fiscal 2026 Q1–Q2: 818, 819, 877, 979, 856, 930; operating income 78, 112, 55, 123, 60, 74. Segment breakdowns for Chemicals, Cement, Electronic & Advanced Materials, Life Science and Eco Business are given for each quarter.
Two stacked tables (sales, operating income) with dark consolidated rows and color-coded segment markers.
Ten-year clustered columns: capex 159, 185, 237, 264, 333, 356, 297, 246, 327 and a fiscal 2026 forecast of 409; depreciation 139 to 209, forecast 242; R&D 79 to 177, forecast 213. A note states that depreciation of PP&E switched from declining-balance to straight-line from fiscal 2023.
Clustered column chart in three blue shades with dashed outline for forecast year.
Interest-bearing debt by fiscal year-end 2017–2025 and end-September 2026: 1,399, 1,289, 1,163, 984, 1,092, 1,424, 1,057, 1,106, 1,620, 1,655, split into short-term borrowings, long-term borrowings and bonds (bonds 250 at the latest two points). D/E ratio line: 1.1, 0.8, 0.7, 0.5, 0.5, 0.6, 0.4, 0.4, 0.6, 0.6.
Stacked columns for debt components with a D/E ratio line plotted above.
Operating, investing and free cash flow for fiscal 2017–2025: operating CF 618, 385, 523, 433, 259, △118, 558, 523, 509; investing CF reached △1,229 in fiscal 2025, giving free CF of △719. Fiscal 2026 forecast bars are shown with dashed outlines but carry no value labels.
Clustered column chart across positive and negative values, with alternating shaded year bands.
Repeat of the corporate slogan and logo slide that closes the appendix.
Centered slogan and logo on white.
Notice regarding this material: provided for information, not solicitation; based on currently available information and subject to uncertainty; the company accepts no liability for investment decisions relying on forecasts; reproduction or redistribution without permission is prohibited.
Centered bold heading with four short paragraphs of body text.
Các câu hỏi phổ biến về slide này và nội dung trình bày cơ bản.
Tokuyama's fiscal year runs from April to March. This deck covers the second quarter (interim period) of the fiscal year ending March 2027 (2027年3月期), i.e. April–September 2026, which this page calls H1 FY2026. It was presented on October 29, 2026.
Yes. The original is a Japanese-language results-briefing deck (決算説明会資料) disclosed on TDnet, the Tokyo Stock Exchange's timely-disclosure system. The page-by-page analysis here translates slide titles and key figures into English; amounts stay in the company's unit of ¥100 million (億円).
Net sales rose 9% to ¥178.6 billion (1,786 in ¥100 million units) while operating income fell 29% to ¥13.5 billion (135) on higher raw material and fuel costs, especially naphtha. Interim net income attributable to owners was ¥9.9 billion (99), down 18%.
To reflect the October 1, 2026 transfer of its domestic cement and soil-stabilizer sales business: ¥37.0 billion consideration, a ¥32.0 billion gain on sale booked in Q3 and an impairment of about ¥12.0 billion. Net sales (¥392.0 billion) and operating income (¥34.0 billion) stay unchanged, while net income attributable to owners rises from ¥26.0 billion to ¥46.5 billion.
AI keeps the semiconductor industry strong, but polysilicon inventory in the supply chain still has to be digested, with supply-demand improvement expected in 2027–28. H1 polysilicon profit fell on lower volume and inventory valuation losses, while fumed silica for CMP and thermal-management materials grew.
An interim dividend of ¥60 and a planned year-end dividend of ¥80, ¥20 more for the year than the prior year. The policy targets a dividend on equity (DOE) of 4% by fiscal 2030; the forecast DOE for this year is 3.4%.
The gallery page offers the original PDF and an editable PPTX converted from it. The layouts — segment slides with bar charts and margin lines, waterfall bridges and forecast-revision tables — work well as templates for your own results presentation. Replace the company data and branding with your own.
Page 6 (segment sales and operating income), page 18 (revised segment forecast), page 32 (quarterly segment data), pages 7 and 17 (operating income waterfalls) and pages 31–35 (ten-year trends in sales, profit, capex, debt and cash flow).
Original Japanese-language results briefing deck dated October 29, 2026.

Create Your Own Slides
Turn your ideas into professional presentations in seconds with 2slides AI.
Tham khảo thiết kế chuyên nghiệp, chọn phong cách của bạn và tạo slide với kết xuất văn bản hoàn hảo. Được hỗ trợ bởi Nano Banana—bắt đầu tạo trình bày của bạn ngay bây giờ.
Đại Lý AI Của Bạn Cho Slide. Tiết kiệm thời gian, tỏa sáng nhanh hơn với việc tạo bài thuyết trình thông minh.


© 2026 2slides. Bảo lưu mọi quyền.