
Thuộc bộ sưu tập Ví dụ bài thuyết trình cho nhà đầu tư · Mẫu thuyết trình nhà đầu tư Úc
TechnologyOne FY2026 Full Year Results Presentation - a 61-page investor deck from Technology One Ltd (ASX: TNE), the Australian enterprise SaaS company, covering results for the period ended 30 September 2026. It was lodged with the ASX on 17 November 2026. Figures are in Australian dollars (A$) unless the slide says otherwise. It reports Total ARR up 18% to $652.1m, profit before tax up 20% to $217.6m, a 32% PBT margin, a record 40.5 cps total dividend, and the company's SaaS+, Plus and Guide AI strategy.
Dùng trang bìa của bài trình bày này làm mẫu phong cách cho các slide tạo từ nội dung của bạn. Hoặc chọn bất kỳ trang nào bên dưới để lấy bố cục của trang đó làm tham chiếu.
Điều Hướng Nhanh
Thẻ
Chia sẻ slide
TechnologyOne FY2026 Full Year Results Presentation - a 61-page investor deck from Technology One Ltd (ASX: TNE), the Australian enterprise SaaS company, covering results for the period ended 30 September 2026. It was lodged with the ASX on 17 November 2026. Figures are in Australian dollars (A$) unless the slide says otherwise. It reports Total ARR up 18% to $652.1m, profit before tax up 20% to $217.6m, a 32% PBT margin, a record 40.5 cps total dividend, and the company's SaaS+, Plus and Guide AI strategy.
Xem chi tiết từng trang slide, bao gồm bố cục, nội dung chính và các phần tử trực quan.
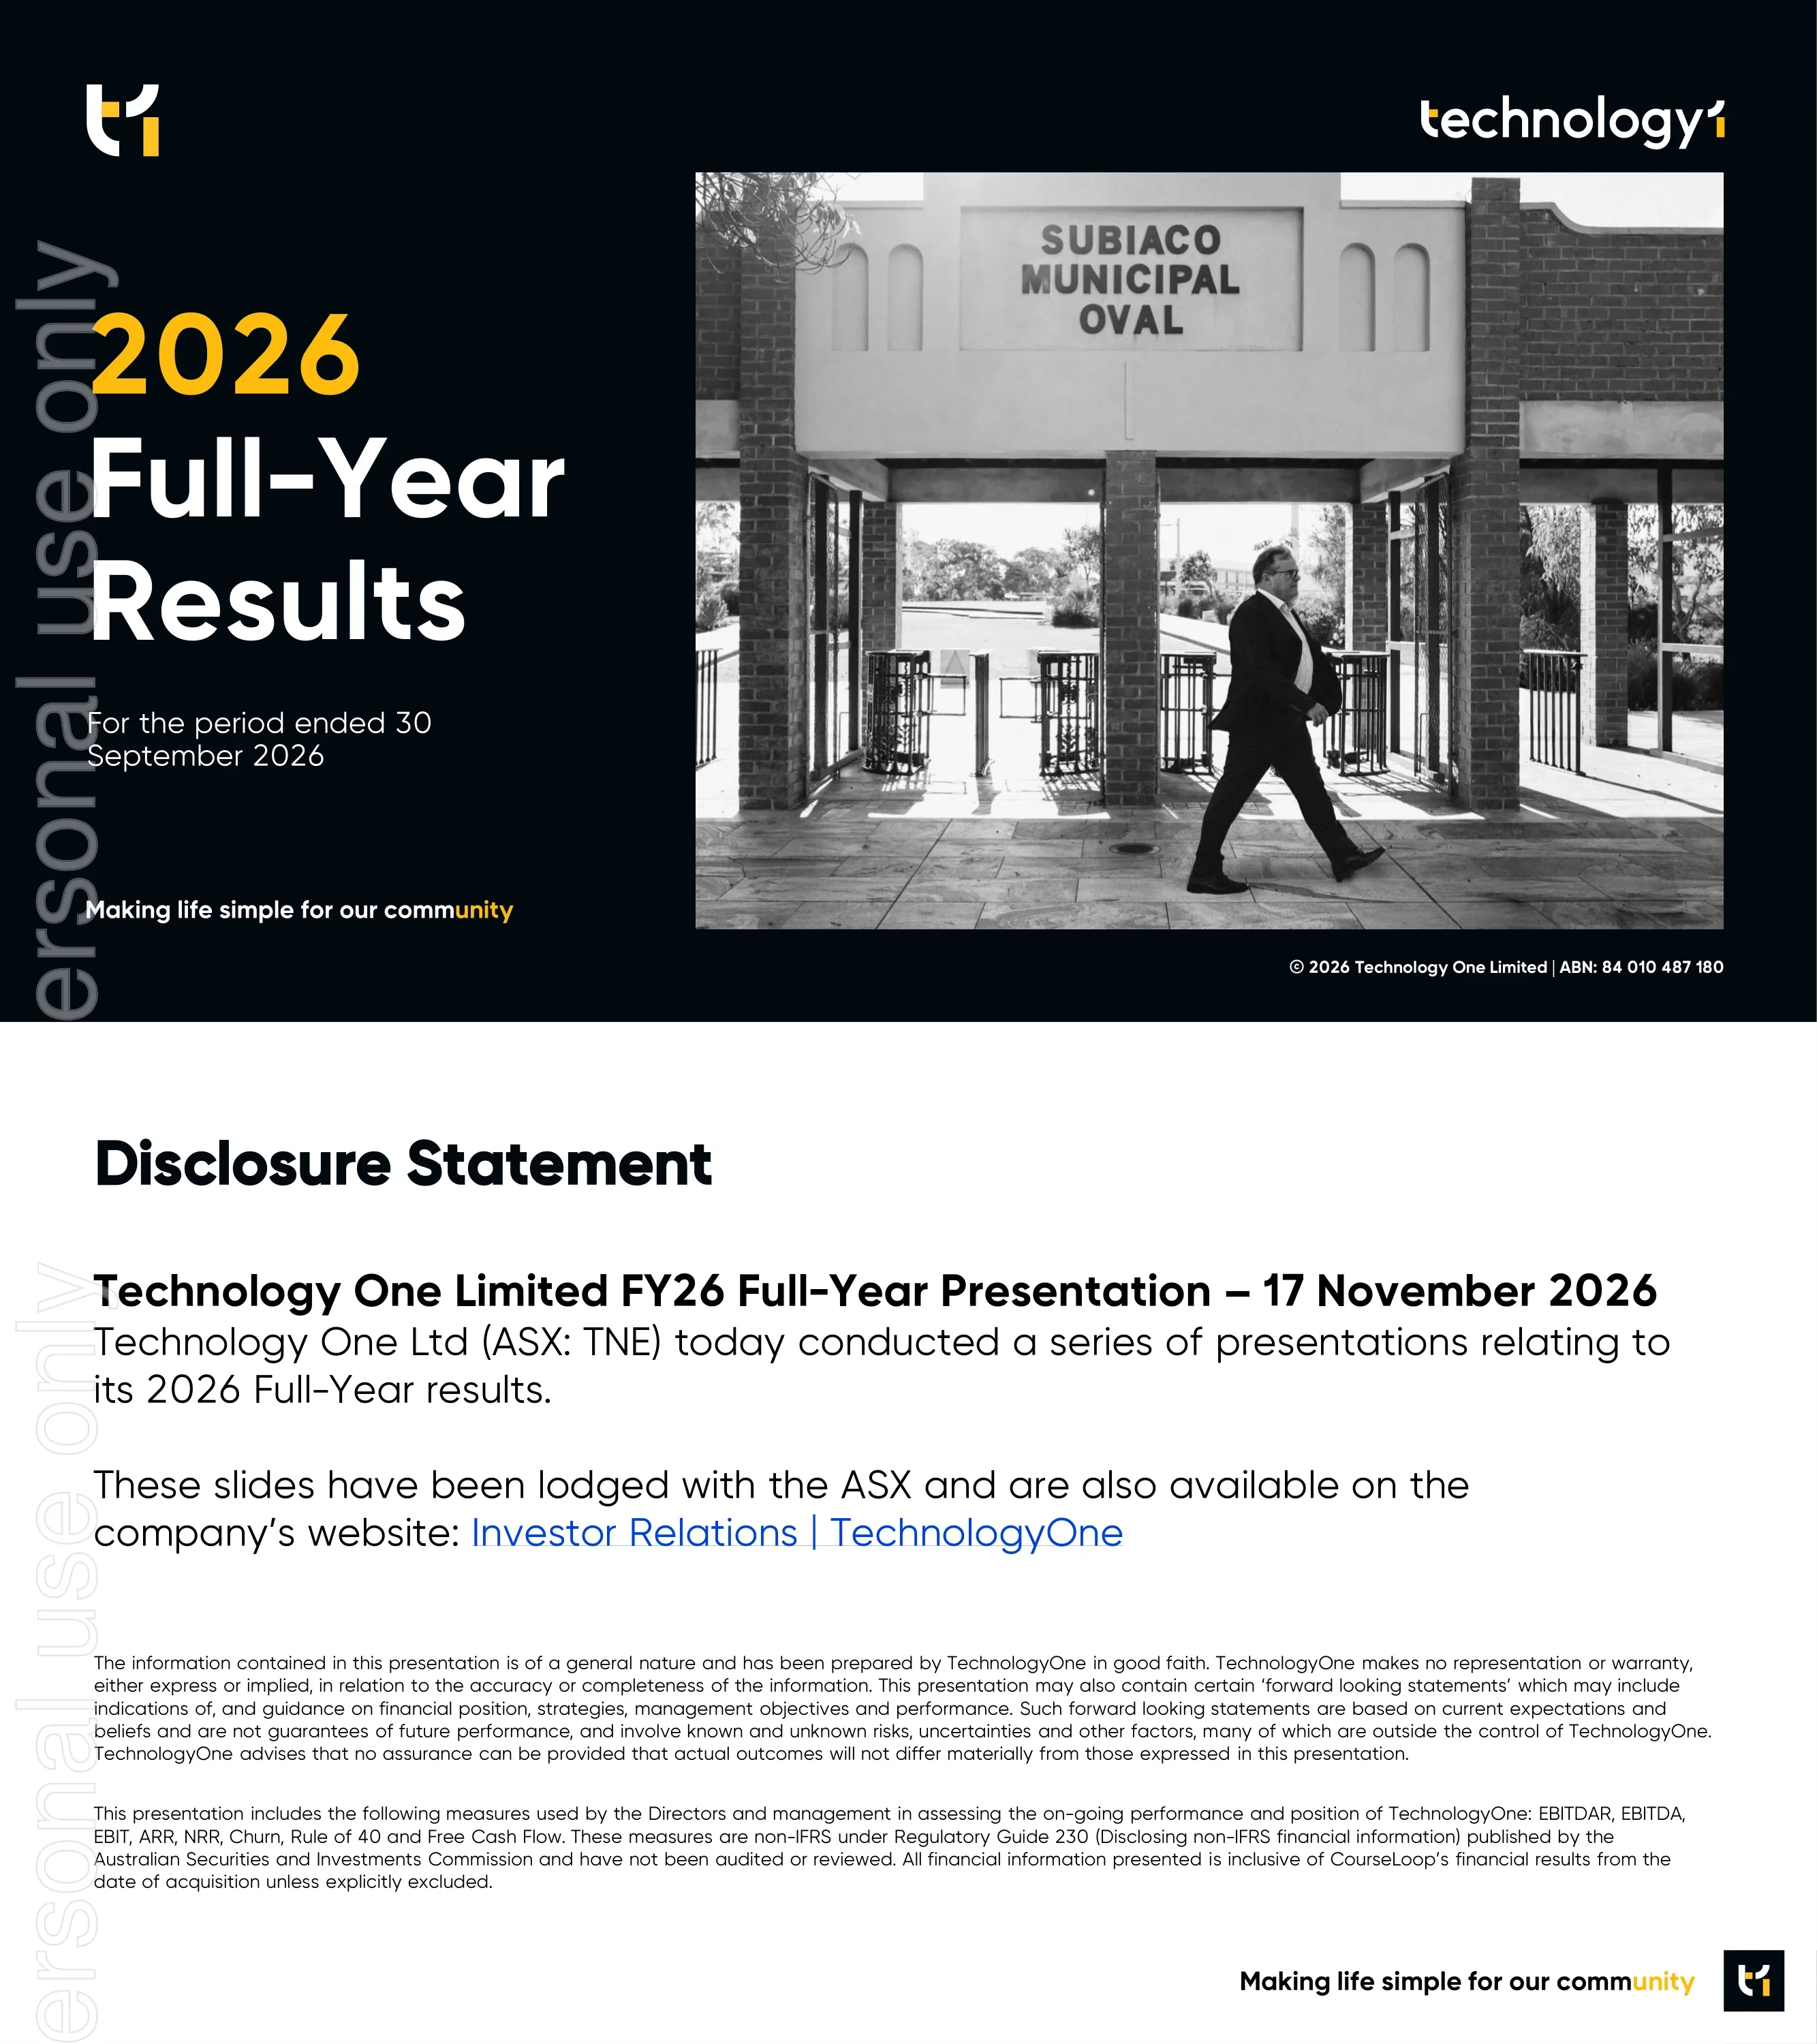
Cover slide reading 2026 Full-Year Results for the period ended 30 September 2026, with the tagline Making life simple for our community and a copyright line for Technology One Limited, ABN 84 010 487 180.
Dark background with large left-aligned title and a framed black-and-white photograph on the right; logos at top corners.
States that Technology One Ltd (ASX: TNE) presented its 2026 Full-Year results on 17 November 2026 and that the slides were lodged with the ASX and are on the investor relations website. Lists non-IFRS measures (EBITDAR, EBITDA, EBIT, ARR, NRR, Churn, Rule of 40 and Free Cash Flow) as unaudited and unreviewed, and notes figures include CourseLoop from the date of acquisition.
White text-only slide with a large heading, a bold intro block and two small-print paragraphs.
Introduces three presenters: Edward Chung (CEO and Managing Director), Giovanni Rizzo (Acting CFO) and Ben Malpass (EVP UK and EVP Local Government).
Dark panel with the title at left and three circular headshots with names and roles in a row at right.
Agenda with three items: FY26 Highlights, FY26 Financial Results and Significant Achievements, and Building the Future and Long-Term Outlook.
Left half is a large customer photograph; right half is a dark panel with a bulleted agenda.
Three cards: Vision - Making life simple for our community; Purpose - Our passion is to solve the complex; Mission - Better our community, from its citizens to students, by leveraging our team's innovation, drive and determination.
Three equal rounded cards on a dark background, each with a white header and supporting paragraph.
Long-run line chart from 2000 to 2026 of share price (A$), total revenue (A$) and profit before tax (A$), with growth-guidance bands of 10%-15%, 12%-16%, 13%-17% and 18%-20%. Chart data points are not labelled with values.
Full-bleed dark chart with a legend at left and dashed guidance boxes across the top.
Four KPI cards: ARR growth 18% to $652.1m (FY25: $554.6m), Profit before Tax growth 20% to $217.6m (FY25: $181.5m), PBT margin 32% (FY25: 30%), and a record total dividend of 40.5cps (FY25: 36.6cps) with the final dividend up 63% on FY25.
Four tall cards in a row, each with a large amber figure, green check line and a white FY25 comparison footer.
States that forex headwinds equated to a 1% impact on total ARR growth and 7% on UK ARR growth. Table: ARR $652.1m (18%) with $8.0m forex impact giving $660.1m (19%) at constant currency; UK ARR $61.0m (18%), $3.8m impact, $64.8m (25%); NRR 116% (1 pt), 1 pt impact, 117% (2 pts).
Dark slide with three bullets above a six-column table, the last two columns highlighted in amber.
Technology-generation timeline from Gen 1 RDMS, Gen 2 PC and Gen 3 Internet to Gen 4 SaaS and Gen 5 AI, with the End of On-Premise marker, a $500m ARR label and product icons (Finance One, Power of One, STM, P&R, Spatial, SAM, UK, Timetable and Scheduling, DXP, Curriculum Management, SaaS+, Plus, Guide).
Rising area graphic from grey through amber to purple with icons placed along the curve and generation labels along the bottom.
Grid of the licensable product range including App Builder Studio, Business Analytics, Corporate Performance Management, Curriculum Management, DxP Essentials, DxP Local Government, Financials, Human Resources, Payroll, Property and Rating, Spatial, Student Management, Supply Chain Management and Timetabling and Scheduling, plus Plus and Guide. Footer reads 39 Years of Industry Focus. $1 Billion+ Investment.
Three-row grid of white icon tiles with two purple tiles at the left, amber and white footer statement.
Matrix of ERP modules (FIN, HRP, SCM, EB, EAM, SAM, SPAT, ECR, CPM, PP, ECM, P&R, Curr, T&S, STM, DXP, Guide, Plus) showing TechnologyOne covering every column on SaaS+ with implementation in Months and ERP in 30 days, versus best-of-breed and other vendors with partial coverage and implementation in Years. No numeric values are shown other than 30 days.
Grid with amber dots for TechnologyOne and grey dots for competitor rows, grouped by Basic ERP, Advanced ERP, Mission Critical LG, Mission Critical Edu and B2B2C.
Product launch slide for Plus alongside the technology1 5.0 badge, showing an Ask Plus conversational input on a phone.
Purple gradient banner with Plus logo, large phone mockup at top right and technology1 5.0 lockup below.
Lists a five-layer architecture: Conversational Experiences, Enterprise intelligence, Enterprise Memory, Connected platform and Systems of Record, each with a matching diagram.
Left column of labels joined by plus signs; right side of stacked diagram blocks.
Section slide headed AI Momentum Delivers Record Results, showing a Plus home screen mockup with a Good morning greeting, in-focus task tiles and quick-start prompts.
Large left title with AI icon and a glowing product screenshot at right.
Repeat of the agenda slide: FY26 Highlights, FY26 Financial Results and Significant Achievements, Building the Future and Long-Term Outlook. This is the same slide as page 4, used as a section divider.
Photo at left and bulleted agenda at right.
Summary table: Total ARR $652.1m vs $554.6m (18%), UK ARR $61.0m (18%), NRR 116% vs 115%, SaaS and Recurring Revenue $631.4m (14%), Total Revenue $680.8m vs $610.0m (12%), EBITDA $304.3m (19%), PBT $217.6m (20%), PAT $163.4m (19%), 12-month rolling FCF pre-tax $246.4m (9%), Cash and Investments $299.7m, Rule of 40 55.4%, PBT margin 32.0%, EPS 50.03 cps and DPS 40.50 cps. Figures are in A$m.
Left side has bullets and four black KPI tiles; right side is a full-height results table with FY26, FY25 and variance columns.
Strong profit growth of 20% with a profit margin of 32%. Total revenue 680.8M vs 610.0M (+70.8M), SaaS Fees 583.4M (+15%), total expenses 463.2M vs 428.5M and Profit Before Tax 217.6M vs 181.5M (+36.0M). Figures in A$M.
Line-item table with FY26 and FY25 columns, a variance bar chart and numbered commentary at right.
Half-yearly new ARR bars from H1 FY21 ($11.8m) to H2 FY26 ($54.1m), including H1 FY25 $40.9m, H2 FY25 $43.5m and H1 FY26 $43.4m. Notes record new sales ARR despite forex headwinds; hatched portions on FY26 bars are unlabelled.
Twelve alternating grey and amber vertical bars with rotated value labels.
Three donut charts: By Vertical (Local Government 41%, Education 25%, Government 14%, Health Services 8%, Asset Intensive 7%, Financial Services and Corporate 5%), By Region (Australia 84.0%, United Kingdom 9.0%, New Zealand 7.0%) and By Product across 22 licensable products and over 600 licensable modules.
Three white cards with black headers, each containing a donut chart with outside labels.
Total ARR of $652.1m up 18% (FY25: $554.6m). FY26 ARR by vertical: Local Government $268.1m (+23%), Education $162.9m (+16%), Government $91.9m (+12%), Health and Community Services $52.6m (+16%), Asset and Project Intensive Industries $46.2m (+16%), Financials and Corporate $30.4m (+8%).
Bullets at top, six dashed vertical labels and a grouped bar chart of FY23-FY26 bars per vertical with FY26 highlighted.
City of Darebin: full OneCouncil solution with a standard SaaS+ implementation, selected as innovation partner on a long term 10-year agreement, serving over 150,000 residents and leveraging DxP, Invoice IQ, Plus and AI.
Customer logo at left with a 2x2 grid of dark info cards.
Australia, New Zealand and SEAP ARR grew to $591.1m (+18%) from $502.8m, and UK ARR to $61.0m (+25% on constant currency) from $51.8m. Earlier years shown: ANZ $303.2m, $366.4m and $435.5m for FY22-FY24; UK $17.5m, $26.5m and $34.7m.
Two side-by-side cards with five-year bar charts and an FX impact hatch on the UK bar.
FY26 UK ARR up 25% on constant currency (up 18% reported to $61.0m); 4 Student Management opportunities came to market and all were won; 6 new large council deals won. UK new sales ARR was $12.4m in FY26 against $13.1m in FY25.
Left text boxes with bullets; right two bar charts for UK ARR and UK New Sales ARR.
Stockport is a major unitary authority in Greater Manchester and TechnologyOne's second local government signing there, unseating global competitors. Largest UK councils are now adopting TechnologyOne software, with 6 new significant UK LG councils won in FY26.
Council crest logo at left with a 2x2 grid of dark cards.
SRUC signed a long-term 10-year agreement for the full OneEducation suite, including the first Guide agreement signed in the UK. University of Winchester signed a long-term 5-year agreement, the 8th Student Management customer acquired in the UK in the last 3 years.
Two large rounded cards, each with a logo, an amber agreement-length header and three paragraphs.
Mission critical products for Local Government and Higher Education; Advanced ERP products drive deeper penetration; B2B2C products drive new transactional revenue streams. Shows the product tile grid with Plus and Guide.
Bullets at top and a grid of grey icon tiles with two purple tiles at right; product donut thumbnail at top right.
NRR is 116% in FY26 (117% at constant currency), within the target range of 115% to 120%; churn is 0.8% against a target of 1% or less, with a 99%+ customer retention rate. Ten-year NRR labels range from 107% (FY20) to 119% (FY23).
Two line charts on the left with target bands and a grey rounded bullet box on the right.
Total ARR grew from $153.9m in FY17 to $652.1m in FY26, with average ARR per customer rising from $174k to $506k (FY25: $443k). Phases labelled On-prem to SaaS, SaaS to SaaS+, and Plus and AI.
Bar and line combination chart with a gradient background shifting from white to amber to purple.
SaaS+ resonates with the market: deep vertical knowledge, preconfigured solutions, in-house delivery team and one single subscription fee, with reduced customer risk and go-live with ERP in 30 days. 100% of new agreements are sold as SaaS+, which lifts ARR by 40%.
Dark slide with large SaaS+ logo and bullets at left, a callout arrow and a stat card at right.
Central Coast Council is NSW's largest council with 350,000 residents and 2,500 staff, on a 10-year OneCouncil agreement. SaaS+ Phase 1 went live in 8.5 months and it is live with Invoice IQ AI.
White circular council name at left and a 2x2 grid of dark cards.
The drive to ERP in 30 days will increase margins: implementation fell from 140 days (FY24) to 126 days (FY25) and 105 days (FY26), with releases 27A, 27B and 28A targeting 30 days by FY28. Powered by AI.
Declining curve from amber to purple across FY24-FY28 with an ERP in 30 Days badge at lower right.
SaaS+ is delivering exactly as planned and slightly ahead of schedule; the company is exiting a period of headwinds from the investment, and the 32% PBT margin (up 2 points) evidences margin increase that will continue. The PBT Margin Impact curve has a We are here marker; no axis values are labelled.
Three headline lines above a conceptual dip-and-rise curve with a callout.
Significant R&D investment for future growth, including Plus, Guide, ERP in 30 days, SaaS+, App Builder and new products such as Invoice IQ. R&D investment of $180m (before capitalisation) is 26% of total income.
Large dark panel with six product tiles at left; right side mosaic of dark tiles with a purple 26% tile.
Statement slide: AI is an Accelerant for our customers and for our business.
Full dark slide with three-line large white text and purple Ai.
Idea-to-productisation time is collapsing: a traditional ERP product took 85 months, DxP 42 months and Plus just 9 months to general availability (text: from 7+ years for the core platform, to 3.5 years for DxP, to just 9 months for Plus).
Left bullets and a three-curve S-curve chart with labelled end points on a 0-90 month axis.
Illustrative projected customer uptake of Plus across FY26-FY29, with a footnote that the chart is for illustrative purposes only and actual adoption rates after FY26 are not known or forecast. Axis tick values are partly overlapped and not fully legible.
Left area chart with rising dotted line; right a Plus interface screenshot.
100 Plus sales in FY26, with $30m additional new ARR product uptake from Plus deals. Described as the fastest customer uptake of a product and fastest to reach $1 million in ARR in company history, with $1 million new ARR within 4 months of launch.
Large highlighted purple-bordered card at left and four smaller stat cards at right.
James Cook University signed a landmark 10-year deal with TechnologyOne and acquired every product and module in the OneEducation suite to create a rich data ecosystem that Plus can leverage. Quote calls it a case study of partnership, innovation and the vertical strategy.
University logo at left with two text columns on a dark background.
Record $180 million invested in R&D in FY26, 26% of revenue against a 20-25% target. FY26 total shows $98.8m capitalised for traditional ERP products, $3.2m capitalised AI costs (2%) and $77.9m maintenance expense (43% expensed, 55% capitalised). Bars for FY21-FY25 are also labelled.
Bullets and a ratio line above a stacked bar chart on the left; right column of dark cards for Ai, Plus, Guide, ERP in 30, SaaS+, App Builder Studio and Invoice IQ.
Consistent strong free cashflow generates levers for shareholder wealth: free cash flow of $190.5m in FY26 (FY25: $184.2m, FY17: $39.0m), a 19% CAGR, and FCF as a percentage of NPAT of 117% (FY25: 134%).
Grey bar chart FY17-FY26 with a gold percentage line above and CAGR arrow.
Strong operating cashflow: Operating Cash Flow 323.9M vs 294.5M, Free Cash Flow 190.5M vs 184.2M, dividends paid 124.1M, on-market share purchases 87.0M, and closing cash 299.7M vs 319.6M. Figures in A$M; the slide is slightly pixelated at this resolution.
Line-item table with variance bars and numbered commentary on the right.
Final dividend 32.5 cps and total dividend 40.50 cps (FY25: 36.60), up 11%. Payout ratio on total ordinary dividend 81% (FY25: 63%), final dividend franked to 85% (FY25: 65%), payout range lifted to 65-75%, ten-year dividend CAGR 17%.
Bullets above a ten-year stacked bar chart of interim, final and special dividends with a CAGR arrow.
FY25 versus FY26 framework: payout range 55-65% to 65-75%; franking 65% to 85% on the final dividend; IP-related M&A from the CourseLoop acquisition to a disciplined approach; stable equity base from $30 million buying 0.8 million shares to $87 million buying 2.8 million shares.
Two columns - black FY25 and amber FY26 - each with four numbered items and green arrows.
Strong free cash flow, no debt and a robust pipeline enable capital management options: $494 million FCF generated over the past 3 years with over $320 million returned to shareholders, $117 million spent on market buying shares for staff equity plans and over $80 million invested in M&A. FY26 bars show $132.3m ordinary dividends and $87.0m on-market purchases.
Numbered list above a stacked bar chart FY17-FY26 with an FCF percent line.
Rule of 40 equals 55% in FY26 (FY23 53%, FY24 52%, FY25 59%), above the target of 40%. Free cash flow margin is 38% on rolling FCF of $246.4m, and ARR is up 18% to $652.1m, driven by strong NRR.
Three stacked cards at left and a four-bar chart with a dashed target line at right.
Strong balance sheet with no debt and significant cash: Cash and Investments 299.7M (319.6M), Total Assets 910.3M vs 891.4M, Deferred revenue 335.8M (+14%), Net Assets and Total Equity 424.8M vs 450.7M. Figures in A$M; the slide is pixelated at this resolution.
Line-item balance sheet with variance bars and four numbered comments.
Mosaic summary: record profit, revenue and ARR; final dividend up 63% to 32.5 cps; R&D investment of $180m, up 17% pcp; Total ARR up 18% to $652m; PBT up 20% to $217.6m; Rule of 40 +55%; UK ARR up 25% (constant currency) to $61.0m; Our Investments Continue to Deliver with Plus and Guide.
Bento-style grid of coloured tiles in white, grey, purple, amber and olive.
Agenda slide repeated before the final section: FY26 Highlights, FY26 Financial Results and Significant Achievements, Building the Future and Long-Term Outlook. Same layout as pages 4 and 15.
Photo at left and bulleted agenda at right.
Total Addressable Market $13.5b+ with multiple platforms for growth: NRR of 115-120% and economies of scale driving profit margins to 35%+. Grow (APAC whitespace, new logos, rateables and students, pricing, UK), Build (SaaS+ lifts ARR by 40%, R&D doubles APAC ARR whitespace) and Buy (strategic acquisitions).
Concentric circle graphic at left with an ARR core and three dashed text boxes at right connected by lines.
Total Addressable Market exponentially increases with Plus and Guide, shown as $13.5b++ with purple rings expanding beyond the ARR core.
Purple concentric rings at left and a short title and figure at right on black.
Competitive strengths: vertical expertise and IP (mission-critical software, defence in depth, 20% to 25% of revenue in R&D), compliance software, SaaS+ and ERP in 30 Days, industry-leading 99% customer retention and a 39-year execution record. An iceberg shows the interface above 39 years of data below.
Two-column table of levers and strengths with an iceberg diagram at right.
Five levers: New Pricing Model (new transaction and advertising revenue), AI Enhancement to ERP, Data Advantage, Product Up-take and Network Effect, where Guide expands the customer surface area from about 100 staff per council to every ratepayer and student. The iceberg adds an AI Deepens the Moat section.
Numbered lever table with five rows and an extended iceberg diagram in purple.
Photo collage celebrating TechnologyOne's people, with the headline People are our power.
Large title at top left with a grid of eight black-and-white event and team photos.
Long-Term Outlook: $1B+ ARR by FY30, supported by 22 products, an exponentially larger Total Addressable Market, Plus, Guide and SaaS+, and multiple platforms for growth.
Wide amber banner above four dark cards.
Logo slide with the technology1 wordmark and tagline Making life simple for our community, marking the end of the main presentation.
Centered logo and tagline on a dark background.
Appendix list: A FY26 Profit by Segment, B R&D - Disciplined and Transparent, C Drivers for Long Term Growth, D Glossary.
Black framed panel with logos at the top corners and a four-line list.
Strong Group profit of $217.6m, up 20% on pcp. Software $179.0m (FY25 $162.2m), Consulting $4.7m ($8.8m), Corporate $33.9m ($10.6m); APAC $212.1m (FY25 $180.0m, +18%), UK $5.5m ($1.5m, +267%).
Left grouped bar chart by segment; right two stacked FY25 versus FY26 bar charts for APAC and UK.
FY26 R&D investment $179.9m, capitalisation ($102.0m), amortisation $63.1m and P&L impact $141.0m; FY25 $153.7m, ($84.4m), $53.1m and $122.5m. Table gives FY23-FY26 percent capitalised of 54.1%, 54.5%, 54.9% and 56.7% with a 5-year amortisation period.
Two waterfall charts at left and a four-year data table at right.
Diversified revenue streams by product, vertical (Local Government 41%, Education 25%) and region (Australia 84.0%), supporting a strong, loyal customer base: sticky mission critical solution, 99%+ retention, 90%+ of revenue SaaS and recurring, and a global SaaS ERP solution.
Three donut chart cards over four grey banner bars with a black label column at left.
Glossary of terms such as ARR, ARR Sales, APAC, Churn, EBITDA, EBITDAR, Free Cash Flow, NRR, PBT, Rule of 40, SaaS+ (Solution as a Service) and TAM, with Rule of 40 defined as ARR growth plus the 12-month rolling pre-tax FCF margin.
Two-column term and definition list under a title.
Final slide with the technology1 logo and the tagline Making life simple for our community.
Centered logo and tagline on black.
Các câu hỏi phổ biến về slide này và nội dung trình bày cơ bản.
It is a 61-page deck lodged with the ASX on 17 November 2026 covering results for the period ended 30 September 2026. It includes the FY26 results summary, profit and loss, cash flow, balance sheet, ARR by vertical and region, NRR and churn, R&D and capital management, a long-term outlook and four appendices. Figures are in A$ unless stated.
TechnologyOne's financial year runs from 1 October to 30 September. FY26 therefore covers October 2025 to September 2026, and the deck's cover states the period ended 30 September 2026.
Total ARR rose 18% to $652.1m (FY25: $554.6m), profit before tax rose 20% to $217.6m (FY25: $181.5m), PBT margin was 32% (FY25: 30%), total revenue was $680.8m, and NRR was 116%. The deck says ARR, PBT and PBT margin all achieved the top of the guidance range.
The deck shows a record total dividend of 40.5 cps (FY25: 36.6 cps) with the final dividend up 63% to 32.5 cps, franked to 85%. The payout ratio range was lifted to 65-75% and the payout on total ordinary dividend was 81%.
TechnologyOne defines Rule of 40 as ARR growth plus the 12-month rolling pre-tax free cash flow margin, a non-IFRS and unaudited measure. The result was 55% in FY26 versus 59% in FY25, against a target above 40%, with a 38% FCF margin on rolling FCF of $246.4m.
SaaS+ is Solution as a Service, a single-subscription delivery model that the deck says lifts ARR by 40% and accounted for 100% of new agreements. Plus is an AI conversational layer, with 100 Plus sales in FY26, and Guide extends it from staff to residents and students.
Yes. It gives labelled multi-year figures for ARR, average ARR per customer ($174k in FY17 to $506k in FY26), NRR (target 115-120%), churn (0.8% in FY26), free cash flow, R&D as a percentage of revenue (26%) and dividends, which are useful comparison points for SaaS metrics.
Its structure is a good reference: dark title and section slides, large KPI cards with prior-year comparisons, variance waterfall tables with numbered commentary, donut and bar charts, case-study slides and a glossary appendix, all in a navy, amber and purple palette.

Create Your Own Slides
Turn your ideas into professional presentations in seconds with 2slides AI.
Tham khảo thiết kế chuyên nghiệp, chọn phong cách của bạn và tạo slide với kết xuất văn bản hoàn hảo. Được hỗ trợ bởi Nano Banana—bắt đầu tạo trình bày của bạn ngay bây giờ.
Đại Lý AI Của Bạn Cho Slide. Tiết kiệm thời gian, tỏa sáng nhanh hơn với việc tạo bài thuyết trình thông minh.


© 2026 2slides. Bảo lưu mọi quyền.