
Thuộc bộ sưu tập Ví dụ bài thuyết trình cho nhà đầu tư · Mẫu thuyết trình nhà đầu tư Ấn Độ
Pidilite Industries Q2 FY27 Earnings Presentation ("Building Bonds"): results for the quarter ended 30 September 2026 (July–September 2026) and the first half of FY27, filed with BSE/NSE by the Indian maker of Fevicol, M-Seal, Fevikwik, Araldite, Dr. Fixit and Roff. Standalone net sales were Rs 3,982 Cr (+21.7%) with 10.7% underlying volume growth, while EBITDA margin compressed to 20.4% on input-cost inflation. All amounts are in Indian rupees crore (₹ Cr, shown as "Rs ... Cr" on the slides).
Dùng trang bìa của bài trình bày này làm mẫu phong cách cho các slide tạo từ nội dung của bạn. Hoặc chọn bất kỳ trang nào bên dưới để lấy bố cục của trang đó làm tham chiếu.
Điều Hướng Nhanh
Thẻ
Chia sẻ slide
Pidilite Industries Q2 FY27 Earnings Presentation ("Building Bonds"): results for the quarter ended 30 September 2026 (July–September 2026) and the first half of FY27, filed with BSE/NSE by the Indian maker of Fevicol, M-Seal, Fevikwik, Araldite, Dr. Fixit and Roff. Standalone net sales were Rs 3,982 Cr (+21.7%) with 10.7% underlying volume growth, while EBITDA margin compressed to 20.4% on input-cost inflation. All amounts are in Indian rupees crore (₹ Cr, shown as "Rs ... Cr" on the slides).
Xem chi tiết từng trang slide, bao gồm bố cục, nội dung chính và các phần tử trực quan.
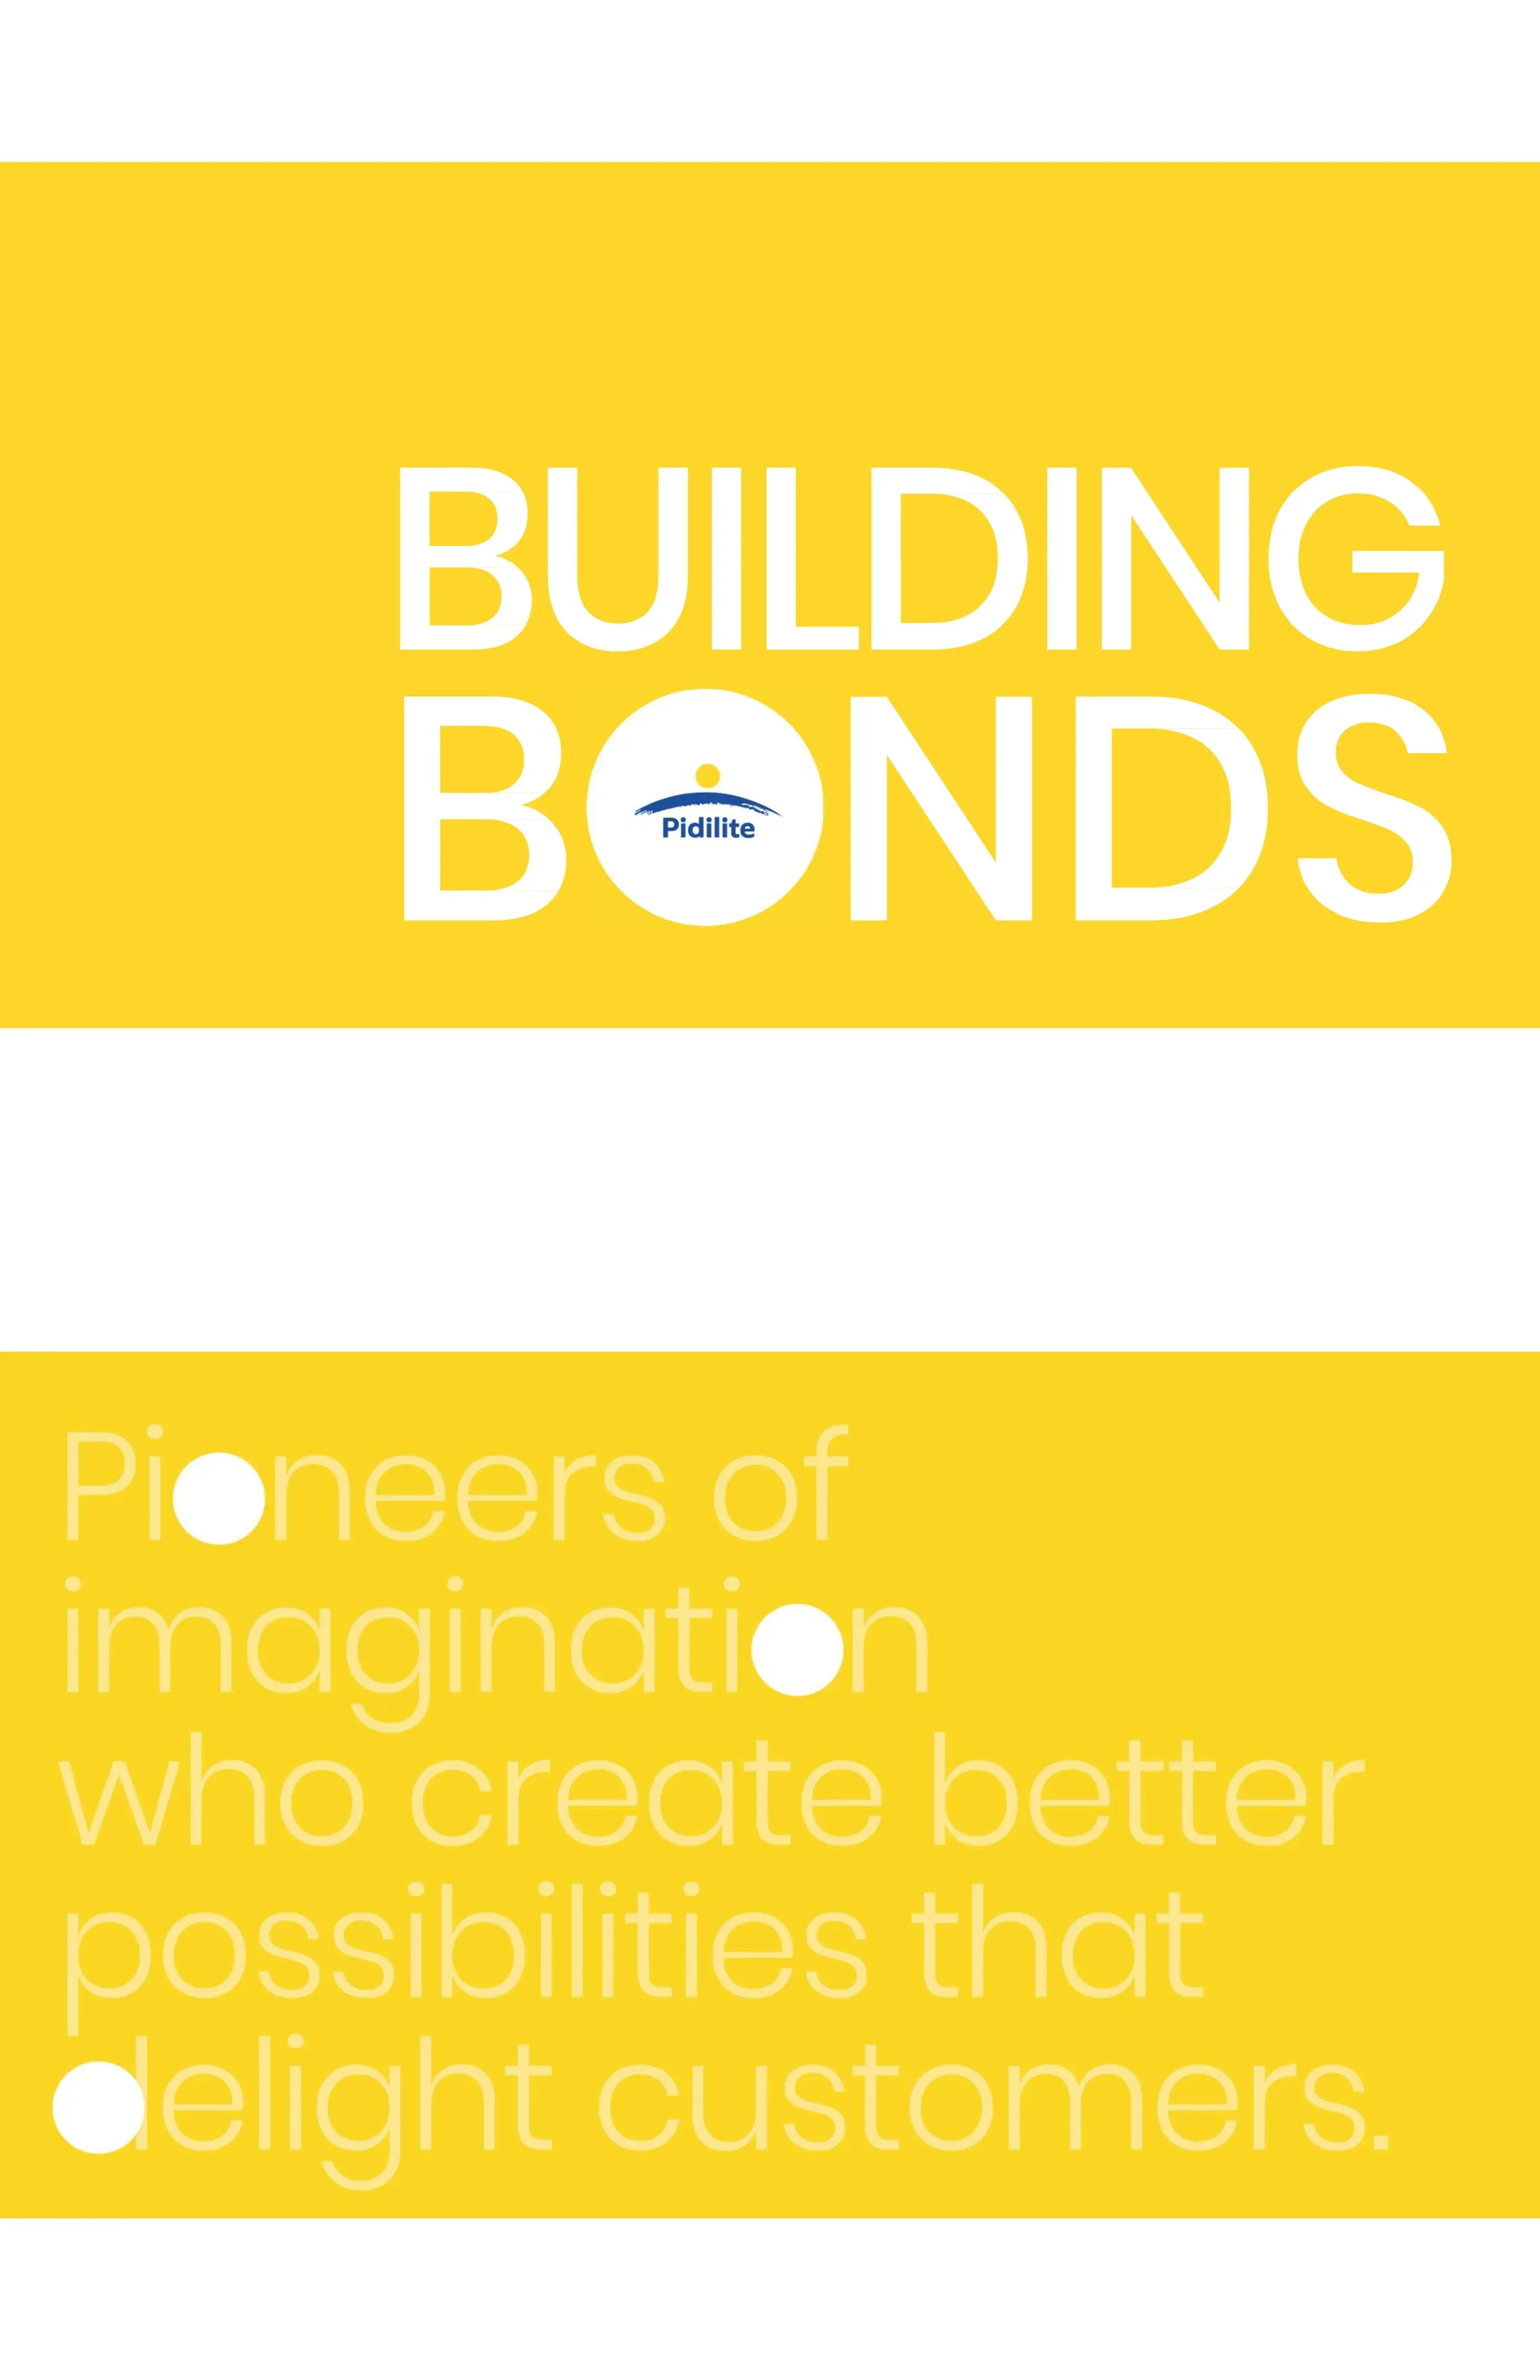
Brand cover with the tagline "BUILDING BONDS" in large white capitals, with the Pidilite logo set inside the letter O of BONDS.
Full-width yellow band across the slide with oversized white typography; white margins above and below.
Purpose line: "Pioneers of imagination who create better possibilities that delight customers."
Yellow band with large pale-yellow light-weight text; several letters replaced by solid white dots.
Deck title page labelled "Q2 FY 27 – Earnings Presentation", confirming the period covered is the second quarter of fiscal 2027.
Black-and-white photo of hands holding a tablet showing charts, with a white quarter-circle in the lower left carrying the title.
Brand portfolio grouped into Core (Fevicol, M-Seal, Fevikwik, Araldite), Growth (Dr. Fixit, Pidilite Emerging India, WD-40, Dr. Cipy, Pidilite Joineries, Roff, Fevicryl, ICA Pidilite) and Pioneer (Haisha, UnoFin, Jowat, Fevi Seal, Litokol, Tenax).
Three horizontal rows separated by thin yellow lines; a large yellow circle labels each tier on the left with brand logos arranged in a grid to the right.
Forward-looking statement caution citing general economic conditions, foreign exchange fluctuations, competitive product and pricing pressures and regulatory developments.
Half-circle yellow header shape top left, body paragraph centred, large yellow semicircle rising from bottom right.
Agenda: 1 Performance Overview (financial performance, new product introduction, marketing initiatives, awards & recognition); 2 Detailed Financial Performance (standalone, segment, subsidiaries, consolidated); 3 Sustainability Journey; 4 Performance Outlook; 5 Company Information.
Numbered yellow circles connected by lines to yellow horizontal bars, each ending in an icon circle; sub-bullets under the first two items.
Section divider introducing the Performance Overview.
Full yellow band with centred white bold title and three white dots in the top right corner.
Q2 FY27: net sales Rs 3,982 Cr grew 21.7% with underlying volume growth (UVG) of 10.7%; C&B revenue +20.7% with UVG 11.1%; B2B revenue +21.8% with UVG 9.2%; EBITDA margin 20.4% despite input cost headwinds; PAT +10.4%. H1 FY27: net sales Rs 8,219 Cr +22.0% with UVG 11.0%; EBITDA margin 23.5% with EBITDA up 14%; PAT +19.5%.
Two bulleted blocks (Q2 and H1) under underlined sub-headings, with the house half-circle header and bottom-right yellow semicircle.
Tiles: Q2 FY27 net sales Rs 3,982 Cr (+21.7%), EBITDA Rs 811 Cr (20.4%, +0.5%), PBT Rs 842 Cr (+8.0%), PAT Rs 647 Cr (+10.4%); H1 FY27 net sales Rs 8,219 Cr (+22.0%), EBITDA Rs 1,932 Cr (23.5%, +14%), PBT Rs 1,962 Cr (+18.2%), PAT Rs 1,477 Cr (+19.5%). Footnotes define net sales (excludes other operating revenue), EBITDA (before non-operating income) and PBT.
Grid with grey metric labels on the left and two columns of yellow rounded tiles (Q2 FY27, H1 FY27), each split by a dashed line into value and green up-arrow growth.
Q2 FY27 consolidated: net sales Rs 4,285 Cr +21.1%; domestic subsidiaries +22.2%; international subsidiaries +21.8%; EBITDA +3.1% over Q2 FY26 with margin 20.5%; PAT +7.1%. H1 FY27: net sales Rs 8,826 Cr +21.2%; domestic subsidiaries +16.8%; international subsidiaries +17%; EBITDA margin 23.5%; PAT +19.6%.
Same two-block bullet layout as the standalone highlights page.
Q2 FY27: net sales Rs 4,285 Cr (+21.1%), EBITDA Rs 878 Cr (20.5%, +3.1%), PBT Rs 829 Cr (+5.3%), PAT Rs 626 Cr (+7.1%). H1 FY27: net sales Rs 8,826 Cr (+21.2%), EBITDA Rs 2,071 Cr (23.5%, +15.6%), PBT Rs 2,005 Cr (+17.6%), PAT Rs 1,510 Cr (+19.6%).
Identical tile grid to the standalone summary for easy comparison.
Launch of Araldite White X and Wud X epoxy adhesives (320 g packs) targeting woodworking and premium stone installations, offering colour matching, faster application cycles and a professional-grade finish to support premium pricing and repeat demand.
Split layout: product pack photos on white at left, navy blue panel at right with brand name and descriptive copy.
Dr. Fixit Kwik N Ezee Klear: a transparent patch-repair waterproof PU-based coating for DIY roof and exterior crack repair, quick drying and applied with a brush included in the pack.
Split layout with product bucket image on the left and a yellow text panel on the right.
Roff rolled out the 'Jailer' campaign highlighting the importance of choosing the right tile installation system; the creative uses the line "Humare liye kuch bhi!!" and promotes Roff's Strong Grip.
Headline sentence above a wide campaign creative (actor still with green diagonal panel) sitting on a grey band.
Dr. Fixit's humour-led campaign 'Waterproofing Ka Baap!' prescribing a dose of waterproofing, featuring Dr. Fixit LW+ 101 and Pidifin 2K products.
Centred headline above a large campaign key visual on a grey band.
Fevicol MR launched a limited-edition Spider-Man collection in collaboration with Marvel, with Hindi tagline artwork and three special-edition bottles.
Headline above a framed blue promotional creative on a grey band.
Dr. Fixit supported Warkaris at the Pandharpur Wari pilgrimage with an on-ground monsoon initiative: mobile drying stations, walking roof shades and tents.
Three colour-blocked photo cards (cyan, orange, blue) side by side over a yellow band.
"Faith Meets Ingenuity: M-Seal Became Kawad Yatra 2026's Unsung Hero" – M-Seal's Kavad Yatra Journey campaign, "a story shaped by faith and jugaad".
Headline above two stacked web-banner creatives on an orange-to-yellow gradient, over a yellow band.
Impactful events and exhibitions: PPS x Design Directories, PPS x Design Dialogues, PIL IP x ITPO Footwear, and PIL IP x Productronica.
Four event photos in a row, each with a yellow semicircle label underneath, set on a yellow band.
Fevicol Kursi Pe Nazar won the INDIAA Awards 2026 (Home Décor, Infrastructure & Fittings); Fevikwik Anniversary won in Home Care Essentials, Miscellaneous Home Goods & Stationery; Fevicol IPL 2026 won Gold at DG+ for Excellence in Brand Awareness & Recall; the Pidilite & Jiostar Tribute to Piyush Pandey won Gold at DG+ for Excellence in Storytelling & Narrative Marketing.
Four trophy photos in a row with captions and award descriptions below on a yellow band.
Section divider introducing the detailed standalone, segment, subsidiary and consolidated financials.
Full yellow band with centred white title and three white dots.
In Rs crore, Q2 FY26 vs Q2 FY27: net sales 3,272 vs 3,982 (+21.7%); material costs 1,497 vs 2,106 (+40.7%); A&SP 141 vs 123 (-12.6%); staff costs 414 vs 449 (+8.5%); other expenses 429 vs 505 (+17.8%); EBITDA 807 vs 811 (+0.5%), margin 24.7% vs 20.4%; PBT 780 vs 842 (+8.0%); PAT 586 vs 647 (+10.4%). H1: net sales 6,740 vs 8,219 (+22.0%); EBITDA 1,695 vs 1,932 (+14.0%), margin 25.2% vs 23.5%; PAT 1,236 vs 1,477 (+19.5%).
Bordered table with yellow header rows (Q2 and H1, each FY26 / FY27 / Growth), grey shading on EBITDA, PBT and PAT rows.
C&B: Q2 FY27 revenue Rs 3,198 Cr (+20.7%), PBIT Rs 841 Cr (+2.5%); H1 revenue Rs 6,656 Cr (+21.6%), PBIT Rs 1,968 Cr (+14.1%). B2B: Q2 revenue Rs 820 Cr (+21.8%), PBIT Rs 115 Cr (-3.4%, red down arrow); H1 revenue Rs 1,641 Cr (+18.8%), PBIT Rs 285 Cr (+13.7%).
Tile grid split into C&B and B2B blocks under grey segment headers; one red down-arrow tile flags the B2B PBIT decline.
C&B segment revenue grew 20.7% for the quarter with PBIT up 2.5%; B2B segment grew 21.8% for the quarter while PBIT declined 3.4%.
Two-column bullet text separated by a thin vertical yellow line.
C&B domestic subsidiaries: Q2 FY27 net sales Rs 178 Cr (+22.1%), EBITDA Rs 30 Cr (16.7%, +18.5%); H1 net sales Rs 333 Cr (+19.5%), EBITDA Rs 56 Cr (16.8%, +19.0%). B2B: Q2 net sales Rs 94 Cr (+22.4%), EBITDA Rs 1 Cr (0.8%, +112.9%); H1 net sales Rs 186 Cr (+12.2%), EBITDA Rs 7 Cr (3.6%, +755.4%). Figures exclude consolidation adjustments.
Same tile grid as the segment overview, with C&B and B2B blocks.
Middle East & Africa: Q2 FY27 net sales Rs 119 Cr (+25.3%), EBITDA Rs 16 Cr (13.8%, +131.7%); H1 net sales Rs 212 Cr (+16.8%), EBITDA Rs 31 Cr (14.4%, +120.2%). Asia: Q2 net sales Rs 107 Cr (+18.1%), EBITDA Rs 23 Cr (21.4%, +19.9%); H1 net sales Rs 211 Cr (+17.1%), EBITDA Rs 48 Cr (22.9%, +28.1%).
Tile grid split into Middle East & Africa and Asia blocks.
In Rs crore, Q2 FY26 vs Q2 FY27: net sales 3,540 vs 4,285 (+21.1%); material costs 1,598 vs 2,211 (+38.3%); A&SP 150 vs 132 (-11.8%); staff costs 471 vs 511 (+8.6%); other expenses 485 vs 566 (+16.7%); EBITDA 851 vs 878 (+3.1%), margin 24.0% vs 20.5%; PBT before share in associates & JV 788 vs 829 (+5.3%); PAT 585 vs 626 (+7.1%). H1: net sales 7,283 vs 8,826 (+21.2%); EBITDA 1,792 vs 2,071 (+15.6%); PAT 1,263 vs 1,510 (+19.6%).
Bordered table mirroring the standalone P&L, with yellow headers and grey subtotal rows.
Section divider for the sustainability section.
Full yellow band with centred white capitals and three white dots.
Core pillars: Environment (combatting climate change & sustainable innovation), Social (servicing people and communities), Governance (responsible value creation). Future actions: 2025-2027 value chain integration (onboarding partners into ESG framework, quantifying Scope 3, product life cycle assessments); 2027-2029 business transformation (decarbonisation aligned with SBTi, partner emission reduction, path to net zero); 2030 competitive edge (achieve 2030 goals, ESG value for suppliers, new business opportunities).
Two yellow circles on the left (Our Core Pillars, Future Actions) linked to a grey pillar panel and a yellow-outlined three-column roadmap with year tags and icons.
FY'19 baseline vs FY'26: water use intensity 2.38 to 0.75 kl/MT (68% reduction); energy use intensity 1.80 to 0.51 GJ/MT (72% reduction); renewable energy mix 40.0% to 48.4% (9% increase); waste disposal intensity 22.02 to 3.62 kg/MT (82% reduction); volume produced 4,00,327 to 13,88,052 MT (247% increase) while absolute Scope 1+2 emissions rose from 50,126 to 55,394 tCO2 (11% increase).
Pillar header panel above a yellow-outlined grid of five small bar charts comparing baseline and current year.
Section divider introducing management's outlook.
Full yellow band with centred white title.
Management says growth momentum continued in Q2 FY27 with broad-based double-digit UVG leading to 20%-plus revenue growth; despite very high material inflation it delivered steady margins in H1 FY27 and expects the momentum to continue into H2; it will keep investing in brands, innovation and distribution.
Square-bullet list under the half-circle header with a yellow semicircle at bottom right.
Section divider for company background pages.
Full yellow band with centred white title.
Portfolio framework: Core (established brands with high market maturity and strong share, target 1-2X GDP growth), Growth (emerging categories with significant potential, 2-4X GDP), Pioneer (nascent categories with huge market creation opportunity, 100 Crores revenue in 3 years).
Three yellow circles on a horizontal yellow timeline with black icon badges; descriptions and targets in columns below.
Share of total standalone sales, 2021-22 to 2025-26: C&B 80%, 81%, 82%, 81%, 82%; B2B 20%, 19%, 18%, 19%, 18%.
Two side-by-side column charts: yellow bars for C&B, blue bars for B2B, with data labels.
Standalone FY 2025-26 sales mix: C&B 81.6%, B2B 18.0%, others 0.4%. By product: adhesives & sealants 53.4%, construction & paint chemicals 22.6%, industrial resins/construction chemicals (project) 9.7%, art & craft materials and others 5.6%, industrial adhesives 4.9%, pigment & preparations 3.4%, others 0.4%.
Nested donut/pie chart with leader-line labels and a legend on the right.
Brand established in 1959; pioneer in consumer & specialty chemicals; portfolio spans adhesives & sealants, construction chemicals, art & craft products and polymer emulsions; other big brands include M-Seal, Fevikwik, Fevistik, Roff, Dr. Fixit, Fevicryl, Araldite, Araldite Karpenter and Araseal.
Half-slide black-and-white photo of the Pidilite signage on the left, text blocks separated by rules on the right.
Operates in 80+ countries with 8 regional offices, 3 regional distribution centres and 45 warehouses; 32 plants, 29 co-makers and 6 international set-ups (Thailand, Dubai, Egypt, Bangladesh, Sri Lanka & Kenya); R&D centres: 5 in India, 1 in Singapore.
Three columns under grey header pills, each with line icons and large numerals.
Domestic: 15 subsidiaries (incl. 1 partnership), 6 associates; standalone revenue Rs 12,570 Cr, subsidiaries Rs 952 Cr. International: 19 subsidiaries (5 direct, 14 step-down), 1 joint venture; export (standalone) Rs 918 Cr, subsidiaries Rs 715 Cr. 9000+ employees (standalone), 5900+ distributors, 850+ products, 6200+ SKUs.
India map and globe in yellow circles on a horizontal line with figures beside each; grey footer band with icon statistics.
Shareholding pattern at 30 September 2026: promoters 69.18%, others 14.48%, FPIs 12.42%, mutual funds 3.92%. Stock price chart rebased to 100 compares Pidilite with the Sensex from 1 October 2025 to 30 September 2026. Dividend payout ratio: FY22 43%, FY23 45%, FY24 45%, FY25 49%, FY26 70% (including a special interim dividend of Rs 5 post bonus; 48.9% excluding it).
Pie chart on the left; line chart and dividend column chart stacked on the right, separated by a yellow vertical rule.
Investor relations contact: investor.relations@pidilite.co.in; Manisha Shetty, Company Secretary; Ramkrishna Mandir Road, Andheri (E), Mumbai 400 059; repeat of the forward-looking statement disclaimer.
Full-bleed black-and-white photo of the headquarters with a white quarter-circle holding the logo and contact details; disclaimer strip at bottom right.
Các câu hỏi phổ biến về slide này và nội dung trình bày cơ bản.
It covers the quarter ended 30 September 2026 (July–September 2026) and the first half of FY27. Pidilite's fiscal year runs April to March, so FY27 is April 2026 to March 2027.
Pidilite Industries filed the deck with the Indian stock exchanges (BSE/NSE) on 28 October 2026 alongside its Q2 FY27 results. The version here has the exchange cover letter removed.
Standalone net sales were Rs 3,982 Cr (+21.7%) with 10.7% underlying volume growth, EBITDA Rs 811 Cr at a 20.4% margin, and PAT Rs 647 Cr (+10.4%). Consolidated net sales were Rs 4,285 Cr (+21.1%) and consolidated PAT Rs 626 Cr (+7.1%). All amounts are in Indian rupees crore.
The deck cites input cost headwinds: standalone material costs rose 40.7% in the quarter, taking EBITDA margin from 24.7% to 20.4%. Management says timely pricing actions and cost discipline kept H1 FY27 EBITDA margin at 23.5%.
C&B revenue was Rs 3,198 Cr (+20.7%) with PBIT up 2.5%; B2B revenue was Rs 820 Cr (+21.8%) while PBIT declined 3.4% to Rs 115 Cr. Slide 35 shows C&B has been about 80–82% of standalone sales over five years.
Yes. Both the original PDF and a PPTX version are available. The PPTX was converted from the PDF, so expect some layout differences; the slide images on this page are rendered from the original PDF.
It is a good reference for a consumer-brand earnings deck: a single bold yellow accent, a recurring half-circle header motif, KPI tiles with growth arrows, full P&L tables, and marketing slides that show campaign creatives next to the numbers.
Yes. Slides 29–30 set out Pidilite's sustainability pillars and roadmap to 2030, and compare FY'19 baseline with FY'26 for water, energy and waste intensity, renewable energy share and absolute Scope 1+2 emissions.
Original exchange filing of the presentation, including the cover letter.

Create Your Own Slides
Turn your ideas into professional presentations in seconds with 2slides AI.
Tham khảo thiết kế chuyên nghiệp, chọn phong cách của bạn và tạo slide với kết xuất văn bản hoàn hảo. Được hỗ trợ bởi Nano Banana—bắt đầu tạo trình bày của bạn ngay bây giờ.
Đại Lý AI Của Bạn Cho Slide. Tiết kiệm thời gian, tỏa sáng nhanh hơn với việc tạo bài thuyết trình thông minh.


© 2026 2slides. Bảo lưu mọi quyền.