
Thuộc bộ sưu tập Ví dụ bài thuyết trình cho nhà đầu tư
MetLife Q3 2026 earnings presentation (3Q26 Earnings Call Presentation, presented by CFO John McCallion), filed with the SEC as an exhibit to Form 8-K (Exhibit 99.4). The 25-slide deck covers MetLife's third-quarter 2026 results: adjusted EPS excluding notable items of $2.85 (up 22%), adjusted ROE of 19.6%, a direct expense ratio of 11.9%, the annual actuarial assumption review, segment earnings, variable investment income, value of new business, hyperscaler and data center exposure, the commercial mortgage loan portfolio, cash and capital, and full non-GAAP reconciliations. The slides in the SEC filing are images, so all figures here were read from the slide images.
Dùng trang bìa của bài trình bày này làm mẫu phong cách cho các slide tạo từ nội dung của bạn. Hoặc chọn bất kỳ trang nào bên dưới để lấy bố cục của trang đó làm tham chiếu.
Điều Hướng Nhanh
Thẻ
Chia sẻ slide
MetLife Q3 2026 earnings presentation (3Q26 Earnings Call Presentation, presented by CFO John McCallion), filed with the SEC as an exhibit to Form 8-K (Exhibit 99.4). The 25-slide deck covers MetLife's third-quarter 2026 results: adjusted EPS excluding notable items of $2.85 (up 22%), adjusted ROE of 19.6%, a direct expense ratio of 11.9%, the annual actuarial assumption review, segment earnings, variable investment income, value of new business, hyperscaler and data center exposure, the commercial mortgage loan portfolio, cash and capital, and full non-GAAP reconciliations. The slides in the SEC filing are images, so all figures here were read from the slide images.
Xem chi tiết từng trang slide, bao gồm bố cục, nội dung chính và các phần tử trực quan.
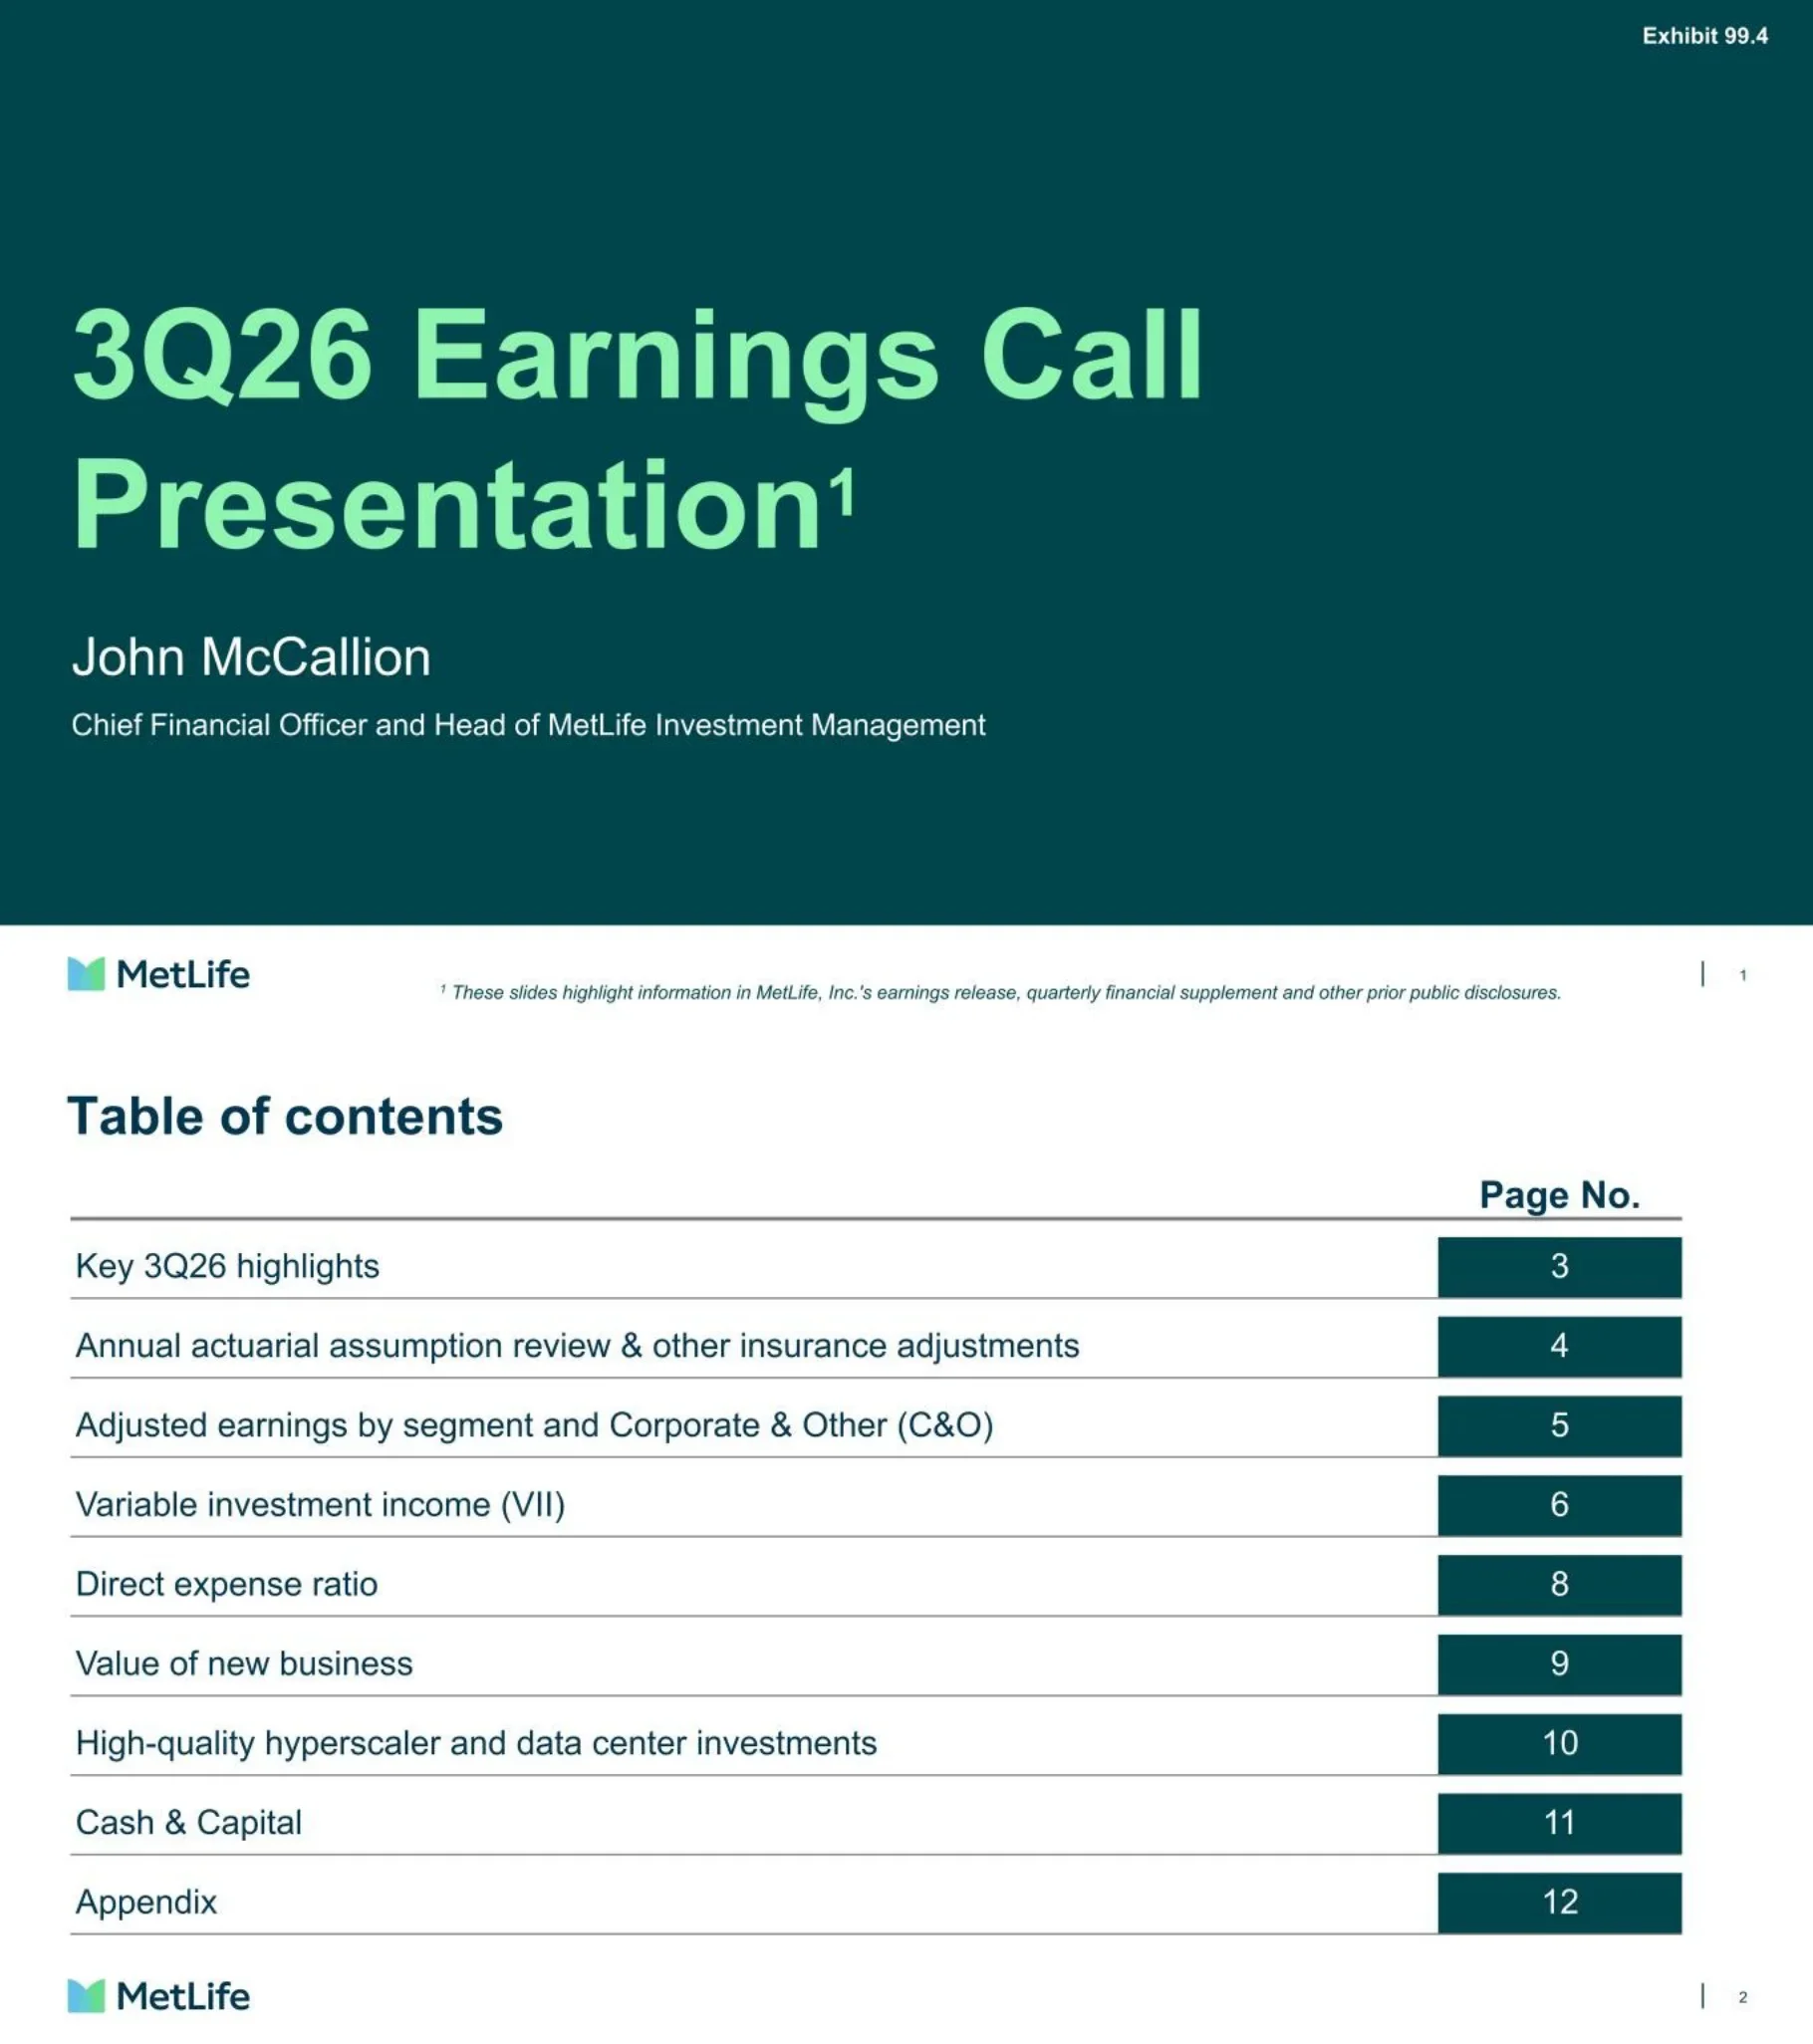
Cover slide of MetLife's third-quarter 2026 earnings call deck, presented by John McCallion, Chief Financial Officer and Head of MetLife Investment Management. The slide carries the 'Exhibit 99.4' label from the Form 8-K filing, and a footnote states the slides highlight information in MetLife, Inc.'s earnings release, quarterly financial supplement and other prior public disclosures.
Full-bleed dark teal background with a large two-line mint-green title on the left, presenter name and title below, and a white footer band with the MetLife logo, footnote and page number.
Nine-item agenda with page references: Key 3Q26 highlights (3), annual actuarial assumption review and other insurance adjustments (4), adjusted earnings by segment and Corporate & Other (5), variable investment income (6), direct expense ratio (8), value of new business (9), high-quality hyperscaler and data center investments (10), Cash & Capital (11) and Appendix (12).
Two-column table: agenda items left-aligned with thin rules between rows, page numbers in dark teal filled cells on the right under a 'Page No.' header.
Key 3Q'26 highlights. Adjusted EPS growth of 22% versus 3Q25 (excluding total notable items), well above the double-digit annual EPS target. Adjusted ROE of 19.6% (excluding total notable items), on track to exceed the annual 15-17% ROE target. Direct expense ratio of 11.9%, on track to beat the annual 12.1% target. Post-tax results table: net income $2,351 million ($3.67 per share); adjusted earnings $1,780 million ($2.78 per share); adjusted earnings excluding total notable items $1,826 million ($2.85 per share).
Three rounded KPI tiles in graded teal/navy shades with large percentages and captions underneath, plus a compact results table on the right with a highlighted adjusted-earnings block; footnotes at the bottom.
Impact table in $ millions post-tax by segment (adjusted earnings / non-adjusted earnings / net income): Group Benefits nil; RIS (Retirement and Income Solutions) (65) / (6) / (71); Asia 52 / nil / 52; Latin America (14) / nil / (14); EMEA (6) / (1) / (7); Corporate & Other (13) / (3) / (16). Total ($46) / ($10) / ($56), or ($0.07) / ($0.02) / ($0.09) per share. Highlights: RIS saw an unfavorable impact from lower mortality; Asia saw favorable impacts driven by economic and mortality updates.
Left: segment-by-column impact table with a dark teal header and light-cyan total and per-share rows. Right: 'Highlights' column with two bullet call-outs.
Segment table ($ millions, 3Q26 vs 3Q25, % change, % change at constant rate, key drivers): Group Benefits $523 vs $458 (+14%), favorable underwriting margins. Retirement & Income Solutions 478 vs 428 (+12%), investment margins and volume growth. Asia 550 vs 470 (+17%; +21% constant rate), favorable investment margins, equity markets and volume growth, unfavorable underwriting margins. Latin America 229 vs 223 (+3%; -5% constant rate), favorable volume growth, unfavorable equity markets. EMEA 114 vs 88 (+30%; +37% constant rate), volume growth. MetLife Investment Management 63 vs 58 (+9%), business growth. Corporate & Other (131) vs (159), favorable investment margins and preferred stock dividends, unfavorable expense margins. Total adjusted earnings ex. notable items $1,826 vs $1,566 (+17%, +17% constant rate); adjusted EPS ex. notable items $2.85 vs $2.34 (+22%).
Wide multi-column table: segment names on the left, numeric columns in the middle, and a split 'Key Drivers' header with Favorable and Unfavorable sub-columns on the right; totals in light-cyan bands at the bottom.
Stacked column chart of variable investment income ($ millions, pre-tax) split into private equity and other (real estate and other funds, prepayment fees): 3Q25 $483, 4Q25 $497, 1Q26 $518, 2Q26 $231, 3Q26 $720. Footnotes: quarterly target VII is $400 million based on full-year 2026 guidance of about $1.6 billion pre-tax; preliminary 3Q26 VII had been projected at no less than $600 million pre-tax in MetLife's Form 8-K dated September 24, 2026. The private equity / other split within each bar is not labeled with values.
Five-period stacked bar chart with light-cyan private equity segments over dark teal 'Other' bases, total labels above each bar and a legend underneath.
Post-tax VII ($ millions, assuming a 21% U.S. statutory tax rate) for five quarters 3Q25 / 4Q25 / 1Q26 / 2Q26 / 3Q26: Group Benefits 5 / 13 / 5 / 4 / 7; RIS 146 / 135 / 131 / 43 / 164; Asia 139 / 145 / 183 / 94 / 277; Latin America 2 / 6 / 10 / 7 / 1; EMEA nil / 1 / 1 / 1 / 2; MIM nil throughout; Corporate & Other 90 / 93 / 79 / 34 / 118; Total $382 / $393 / $409 / $183 / $569. VII-related assets at September 30, 2026: $18.8 billion total, of which Asia $9.0 billion (48%), RIS $5.0 billion (26%), Corporate & Other $4.2 billion (22%), Latin America $0.3 billion (2%), Group Benefits $0.2 billion (1%), EMEA $0.1 billion (1%).
Quarterly table on the left with dark teal header and light-cyan total row; separate grey-shaded panel on the right showing VII assets in $ billions and percentage of total.
Bar chart of the direct expense ratio excluding total notable items related to direct expenses and PRT: FY25 11.7%, 3Q25 11.6%, 3Q26 11.9%, against a dashed 12.1% 2026 target line.
Three-column bar chart with dark teal bars for prior periods, a light-cyan highlighted 3Q26 bar and an orange dashed target line labeled on the right.
Clustered column chart ($ billions, excluding MIM and C&O) comparing capital deployed with value of new business: 2021 $2.8 / $1.9; 2022 $3.7 / $2.3; 2023 $3.6 / $2.6; 2024 $3.4 / $2.6; 2025 $3.8 / $2.8. Internal rate of return 17%, 17%, 19%, 19%, 19%; payback period 6, 6, 5, 5, 5 years. Value of new business is defined as the present value of future profits net of the cost of capital and time value of guarantees from new sales.
Paired navy and mint-green columns for five years with value labels, a legend, and two data rows underneath for IRR and payback period separated by a dotted rule.
Invested asset exposure as of September 30, 2026 at estimated fair value. Hyperscalers (Moody's definition: Alphabet, Amazon, Meta, Microsoft, Oracle): $1.6 billion total, $1.4 billion public fixed income and $0.2 billion private fixed income; 100% investment grade (Aa3 average rating); ~17-year weighted average life. Data centers: $2.5 billion total, $1.0 billion public fixed income, $1.3 billion private fixed income, $0.2 billion real estate; over 95% of fixed income is investment grade; ~4-year weighted average life of fixed income. Total exposure $4.1 billion; each group is less than 1% of the $431 billion General Account AUM; no delinquencies or impairments.
Two side-by-side rounded panels (blue for hyperscalers, green for data centers), each with a donut chart, legend values and two stat cards; a full-width navy summary bar at the bottom.
Strong capital position and liquidity, with about $1.0 billion returned to shareholders in 3Q26. Holding company cash ($ billions): 3Q25 $4.9, 4Q25 $3.6, 1Q26 $3.9, 2Q26 $3.4, 3Q26 $3.4, against a $3.0-4.0 billion cash buffer. Capital: common stock dividends of $380 million and share repurchases of $650 million in 3Q26; year-to-date repurchases of $2.4 billion through October, including $265 million in October 2026. Expected total U.S. Statutory Adjusted Capital on an NAIC basis of about $17.0 billion at 9/30/26, up 3% from 6/30/26. Japan Economic Solvency Ratio (ESR) of 192% as filed for the fiscal year ended March 31, 2026.
Split layout: left column chart of holding company cash with a yellow dashed box marking the $3-4 billion buffer; right column of capital bullets with sub-bullets.
Section divider introducing the appendix with supplementary portfolio data, disclosures and non-GAAP reconciliations.
Full-bleed dark teal background with fine chevron line pattern, mint-green 'Appendix' title on the left and white MetLife logo bottom left.
CML portfolio as of September 30, 2026 ($38.3 billion at amortized cost). Concentrated in high-quality assets in larger primary markets; 70% average loan-to-value and 2.1x average debt service coverage ratio; 78% of the portfolio with LTVs of 80% or less; 93% with DSCRs of 1x or more; office loans average 85% LTV and 2.0x DSCR. LTV/DSCR matrix (share of portfolio): LTV under 65% = 56.8% (54.1% / 1.6% / 1.1% across DSCR >1.2x / 1.0-1.2x / <1.0x); 65-75% = 15.0%; 76-80% = 6.2%; over 80% = 22.0% (13.8% / 3.7% / 4.5%). DSCR column totals 85.8% / 7.0% / 7.2%. CML decreased 26% from $52.1 billion at year-end 2023 to $38.3 billion; office decreased 28% from $19.7 billion to $14.2 billion.
Bulleted portfolio facts on the left, an LTV-by-DSCR matrix on the right with grey-highlighted subtotal cells, and a boxed call-out across the bottom summarizing the portfolio reduction.
Standard safe-harbor language: forward-looking statements using words such as 'anticipate', 'believe', 'estimate', 'expect', 'target' and similar terms are based on assumptions and expectations involving risks and uncertainties, including the risk factors MetLife, Inc. describes in its SEC filings; results could differ and MetLife does not undertake to update these statements.
Single justified paragraph under a bold title, with the rest of the slide left white.
Explains that shorthand terms in the deck (net income, adjusted earnings, book value per share, ROE and related terms) should be read as the corresponding measures available to MetLife, Inc.'s common shareholders. Lists 21 non-GAAP measures and their most directly comparable GAAP measures, for example adjusted premiums, fees and other revenues vs premiums, fees and other revenues; adjusted earnings available to common shareholders vs net income (loss) available to common shareholders; direct expense ratio vs expense ratio; free cash flow of all holding companies vs MetLife, Inc. (parent company) net cash provided by (used in) operating activities.
Dense two-column mapping table with alternating light-cyan row shading: shorthand term to full definition at the top, then non-GAAP measure to comparable GAAP measure below.
States that forward-looking non-GAAP reconciliations are not provided because net investment and derivative gains and losses cannot be forecast without unreasonable effort; defines the constant currency basis (current-period average FX rates applied to the prior period); lists the family of adjusted earnings measures; explains adjusted earnings is MetLife's GAAP measure of segment performance used by the CEO as chief operating decision maker and in compensation; defines adjusted earnings as adjusted revenues less adjusted expenses, net of income tax, and describes exclusions for market volatility, asymmetrical and non-economic accounting, divested businesses and other adjustments. Reconciliations are referenced at investor.metlife.com.
Full-width small-print text with paragraphs and a bulleted list under an underlined italic subheading.
Details the asymmetrical and non-economic accounting adjustments (in-force reinsurance, investment hedge adjustments, foreign currency earnings hedges, inflation-indexed benefit adjustments, single premium annuity inception losses), defines divested businesses, and lists other adjustments, including excluding depreciation of wholly-owned real estate and real estate joint ventures from net investment income beginning 4Q25, unit-linked contract items, reinsurance activity, consolidated collateralized financing entities and synthetic GICs. Also defines investment portfolio gains (losses) and derivative gains (losses).
Full-width small-print bulleted text in several blocks, closing with an underlined italic subheading.
Definitions for return on equity and related measures (adjusted common stockholders' equity and its AOCI-related exclusions), the expense ratio family (expense ratio, direct expense ratio, adjusted expense ratio, and versions excluding notable items and PRT; direct expenses comprise employee-related costs, third-party staffing costs and general and administrative expenses), and assets under management (Total AUM, MIM General Account AUM, General Account AUM, Institutional Client AUM including separate account, reinsurance and third-party AUM).
Three underlined subheadings each followed by bulleted definitions with underlined defined terms; full-width small print.
Defines Asia General Account AUM (and at amortized cost), then 'Other items': how statistical sales are calculated for Group Benefits, RIS, and Asia/Latin America/EMEA; volume growth; PRT including U.K. funded reinsurance; institutional net flows; third-party mortgage loan activity; observable forward yield curves including the 10-year U.S. Treasury benchmark; notable items; holding company cash and liquid assets; and MetLife's free cash flow measure and free cash flow ratio.
Full-width small-print bulleted text under two underlined italic subheadings.
3Q26 vs 3Q25 ($ millions; per diluted share). Net income available to common shareholders $2,351 ($3.67) vs $818 ($1.22). Less: net investment gains (losses) (430) vs (325); net derivative gains (losses) 698 vs (929); market risk benefit remeasurement gains 320 vs 263; other adjustments 29 vs 20; provision for income tax (31) vs 223. Add: noncontrolling interests 15 vs 6; preferred stock redemption premium nil vs 12. Adjusted earnings available to common shareholders $1,780 ($2.78) vs $1,584 ($2.37). Less total notable items (46) vs 18. Adjusted earnings excluding total notable items $1,826 ($2.85) vs $1,566 ($2.34). Constant currency: $1,780 / $1,826 for 3Q26 and $1,582 / $1,564 for 3Q25. Diluted weighted average shares 639.9 million vs 669.1 million.
Financial-statement style reconciliation table with line items on the left and four numeric columns (amount and per-share for each quarter) under dark teal period headers, with single and double underlines on subtotals.
Segment reconciliation ($ millions). 3Q26 adjusted earnings / less notable items / excluding notable items: Group Benefits 523 / nil / 523; RIS 413 / (65) / 478; Asia 602 / 52 / 550; Latin America 215 / (14) / 229; EMEA 108 / (6) / 114; MIM 63 / nil / 63; Corporate & Other (144) / (13) / (131). 3Q25: Group Benefits 456 / (2) / 458; RIS 441 / 13 / 428; Asia 540 / 70 / 470; Latin America 148 / (75) / 223; EMEA 87 / (1) / 88; MIM 58 / nil / 58; Corporate & Other (146) / 13 / (159). Constant-currency 3Q25 figures for Asia, Latin America and EMEA: 526 / 165 / 82 reported and 456 / 240 / 83 excluding notable items. Constant-currency results are not shown for the other segments because the impact is not significant.
Two stacked segment tables (3Q26 above, 3Q25 below), each with seven segment columns under a dark teal period banner, plus constant-currency rows for the three international segments.
FY25 / 3Q25 / 3Q26 ($ millions): premiums, fees and other revenues $57,609 / $12,526 / $14,056; less asymmetrical and non-economic accounting 256 / 78 / 143; other (63) / (15) / (6); divested businesses 8 / 2 / nil; adjusted premiums, fees and other revenues $57,408 / $12,461 / $13,919.
Compact three-column reconciliation table in the upper left of an otherwise white slide.
FY25 / 3Q25 / 3Q26 ($ millions): capitalization of DAC (3,219) / (852) / (975); other expenses 13,904 / 3,568 / 3,965, adjusted other expenses 13,423 / 3,422 / 3,711; other expenses net of DAC 10,685 / 2,716 / 2,990; expense ratio 18.5% / 21.7% / 21.3%. Direct expenses 5,875 / 1,443 / 1,605 (5,835 / 1,443 / 1,605 excluding notable items). Adjusted other expenses net of adjusted DAC 10,204 / 2,570 / 2,736 (10,021 / 2,468 / 2,736 excluding notable items). Adjusted premiums, fees and other revenues excluding PRT 49,839 / 12,471 / 13,525 (PRT 7,569 / (10) / 394). Direct expense ratio 10.2% / 11.6% / 11.5%; excluding notable items and PRT 11.7% / 11.6% / 11.9%; adjusted expense ratio 17.8% / 20.6% / 19.7%; excluding notable items and PRT 20.1% / 19.8% / 20.2%.
Long three-column financial table split into three underlined sections (DAC reconciliation, other expenses reconciliation, other detail and ratios), with ratio rows at the bottom.
3Q26 ($ millions): total MetLife, Inc. stockholders' equity $22,226, less preferred stock 2,830, giving common stockholders' equity 19,396. Less unrealized investment gains (losses) (30,681), deferred derivative gains (losses) (1,749), future policy benefits discount rate remeasurement gains 14,844, MRB instrument-specific credit risk (110), defined benefit plans adjustment (1,336), and embedded derivatives on funds withheld 936, giving adjusted common stockholders' equity $37,492, or $37,538 excluding total notable items. Average common equity $22,004; average adjusted $37,149; average adjusted excluding notable items $37,172. Return on common equity 42.7%; adjusted ROE 19.2%; adjusted ROE excluding total notable items 19.6%.
Single-column financial table with three underlined sections (equity details, average equity, return on equity) under a 3Q26 header; footnotes at the bottom.
Closing brand slide with the MetLife logo centered.
Full-bleed dark teal background with concentric curved line pattern and a centered white MetLife wordmark and symbol.
Các câu hỏi phổ biến về slide này và nội dung trình bày cơ bản.
It is the 25-slide '3Q26 Earnings Call Presentation' MetLife, Inc. used for its third-quarter 2026 earnings call, presented by CFO John McCallion. It summarizes quarterly results, segment earnings, investment income, capital and non-GAAP reconciliations.
MetLife filed it with the SEC as Exhibit 99.4 to a Form 8-K. The slides in that exhibit are images, so the PDF here was put together from those filed slide images. The original filing is on SEC EDGAR, and MetLife's earnings materials are also on its investor relations site, investor.metlife.com.
The deck reports net income of $2,351 million ($3.67 per share), adjusted earnings of $1,780 million ($2.78 per share), and adjusted earnings excluding total notable items of $1,826 million ($2.85 per share). Adjusted EPS excluding notable items rose 22% from 3Q25, adjusted ROE was 19.6%, and the direct expense ratio was 11.9%.
3Q26 VII was $720 million pre-tax ($569 million post-tax), above the $400 million quarterly target and in line with the preliminary estimate of at least $600 million that MetLife disclosed in a September 24, 2026 Form 8-K. Higher private equity returns drove the result.
About $1.0 billion: $380 million in common dividends and $650 million in share repurchases. Year-to-date buybacks reached $2.4 billion through October 2026. Holding company cash ended the quarter at $3.4 billion, inside the $3.0 to $4.0 billion buffer.
Yes. The PDF is free to download. No editable PowerPoint file is attached to this entry.
Yes, it works well as a reference for structure and layout: KPI tiles against targets, a segment table with drivers, stacked bar charts for investment income, and an appendix of reconciliations. Replace MetLife's data and branding with your own, and do not present MetLife's figures as your own analysis.
They are MetLife's own reported figures as filed with the SEC. We checked that segment totals, reconciliation lines and ratios in the deck add up. For investment decisions, use the full earnings release and quarterly financial supplement from MetLife.
The original filed exhibit containing these slides.
Earnings release, quarterly financial supplement and reconciliations referenced in the deck.

Create Your Own Slides
Turn your ideas into professional presentations in seconds with 2slides AI.
Tham khảo thiết kế chuyên nghiệp, chọn phong cách của bạn và tạo slide với kết xuất văn bản hoàn hảo. Được hỗ trợ bởi Nano Banana—bắt đầu tạo trình bày của bạn ngay bây giờ.
Đại Lý AI Của Bạn Cho Slide. Tiết kiệm thời gian, tỏa sáng nhanh hơn với việc tạo bài thuyết trình thông minh.


© 2026 2slides. Bảo lưu mọi quyền.