
Thuộc bộ sưu tập Ví dụ bài thuyết trình cho nhà đầu tư
Meta Q3 2026 Earnings Presentation — Meta Platforms' 18-slide quarterly results deck for the third quarter of 2026 (published on investor.atmeta.com), covering advertising revenue and total revenue by user geography, Family of Apps and Reality Labs segment results, expenses as a percentage of revenue, effective tax rate, net income, diluted EPS, capital expenditures, Family daily active people (DAP), average revenue per person (ARPP), ad impressions and average price per ad growth by region, a free cash flow reconciliation and the limitations of key metrics. Q3 2026 total revenue was $64,601 million and advertising revenue $63,061 million, while operating margin fell to 20% and net income to $9,860 million after a $9.89 billion charge related to the August 2026 agreement with U.S. State Attorneys General; capital expenditures reached $34,906 million in the quarter and free cash flow was $(2,120) million.
Dùng trang bìa của bài trình bày này làm mẫu phong cách cho các slide tạo từ nội dung của bạn. Hoặc chọn bất kỳ trang nào bên dưới để lấy bố cục của trang đó làm tham chiếu.
Điều Hướng Nhanh
Thẻ
Chia sẻ slide
Meta Q3 2026 Earnings Presentation — Meta Platforms' 18-slide quarterly results deck for the third quarter of 2026 (published on investor.atmeta.com), covering advertising revenue and total revenue by user geography, Family of Apps and Reality Labs segment results, expenses as a percentage of revenue, effective tax rate, net income, diluted EPS, capital expenditures, Family daily active people (DAP), average revenue per person (ARPP), ad impressions and average price per ad growth by region, a free cash flow reconciliation and the limitations of key metrics. Q3 2026 total revenue was $64,601 million and advertising revenue $63,061 million, while operating margin fell to 20% and net income to $9,860 million after a $9.89 billion charge related to the August 2026 agreement with U.S. State Attorneys General; capital expenditures reached $34,906 million in the quarter and free cash flow was $(2,120) million.
Xem chi tiết từng trang slide, bao gồm bố cục, nội dung chính và các phần tử trực quan.
Cover slide titled 'Meta Earnings Presentation Q3 2026' with the investor relations URL investor.atmeta.com and the Meta logo.
Minimal white cover with a two-line left-aligned title in slate gray at mid-height, the URL in the bottom-left corner and the blue-and-black Meta logo in the bottom-right corner.
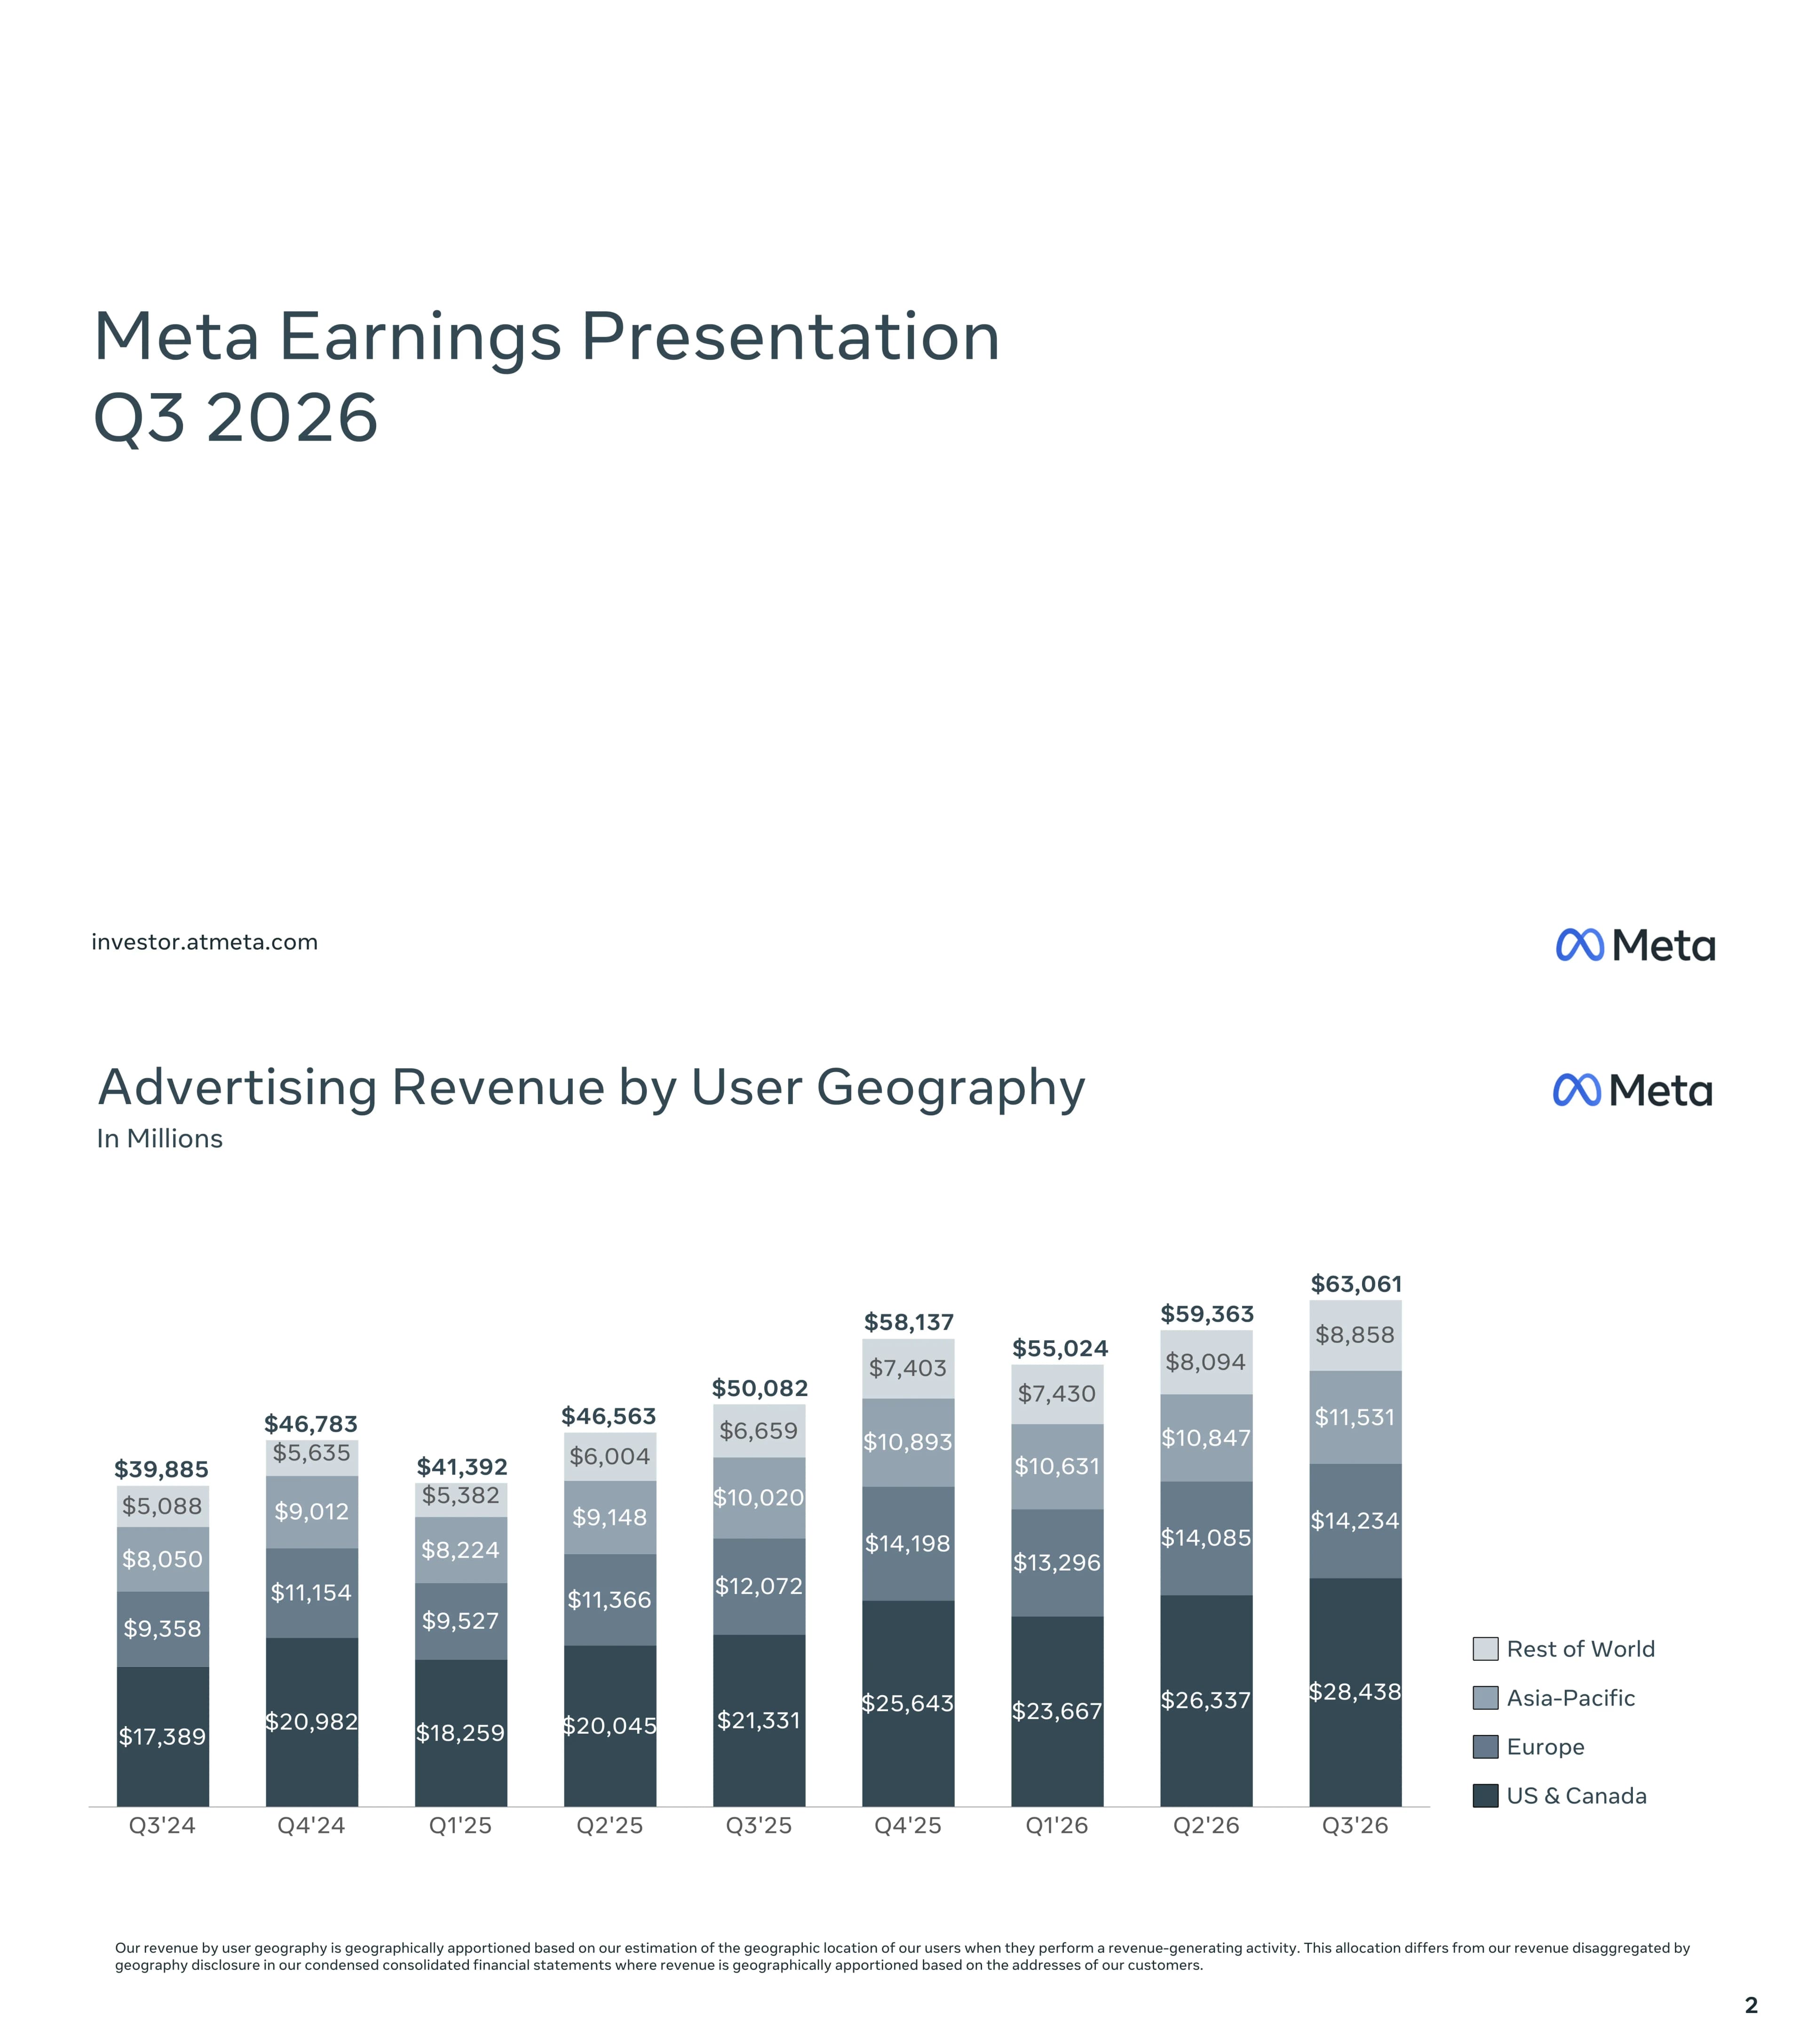
Stacked bars of advertising revenue (in millions) for Q3'24–Q3'26 split into US & Canada, Europe, Asia-Pacific and Rest of World. Totals rise from $39,885 in Q3'24 to $50,082 in Q3'25 and $63,061 in Q3'26; the Q3'26 split is US & Canada $28,438, Europe $14,234, Asia-Pacific $11,531 and Rest of World $8,858. A footnote explains revenue is apportioned by the estimated location of users when they perform a revenue-generating activity.
Nine-column stacked bar chart spanning most of the slide, bold totals above each bar, segment values printed inside each band, legend at the right, footnote at the bottom.
Total revenue (in millions) by user geography for nine quarters. Totals: $40,589 (Q3'24), $48,385 (Q4'24), $42,314 (Q1'25), $47,516 (Q2'25), $51,242 (Q3'25), $59,893 (Q4'25), $56,311 (Q1'26), $60,801 (Q2'26) and $64,601 (Q3'26). Q3'26 by region: US & Canada $28,905, Europe $14,462, Asia-Pacific $11,890, Rest of World $9,344.
Same stacked bar format as the previous slide — nine bars, totals above, regional values inside each band, legend on the right and a methodology footnote below.
Table (in millions, except percentages) of Family of Apps and Reality Labs results. Q3'26: Advertising $63,061, Other $1,097, Family of Apps revenue $64,158, Reality Labs revenue $443, total revenue $64,601; Family of Apps operating income $17,117, Reality Labs operating loss $(4,129), total income from operations $12,988 and operating margin 20% — down from 31% in Q2'26 and 40% in Q3'25. A footnote defines FoA (Facebook, Instagram, Messenger, WhatsApp and other services) and RL (virtual and augmented reality hardware, software and content).
Two stacked financial tables with nine quarterly columns; light-gray body rows, dark slate highlight rows for Total Revenue, Total Income from Operations and Operating Margin; segment definition footnote at the bottom.
Stacked bars showing cost of revenue, research & development, marketing & sales and general & administrative as a percentage of revenue. Q3'26 shows cost of revenue 21%, R&D 31%, marketing & sales 5% and G&A 23% — G&A jumping from 9% in Q2'26 and 7% in Q3'25 — making it the tallest bar in the series. Earlier quarters hold cost of revenue at 18% and R&D between 25% and 31%; Q2'26 R&D peaked at 36%.
Nine stacked percentage bars with in-band labels, legend at right; no subtitle or footnote, leaving the visual to carry the message.
Table (in millions, except percentages) of income before income taxes, provision (benefit) for income taxes and effective tax rate for nine quarters. Q3'26: income before taxes $13,001, provision $3,141, effective tax rate 24%. Q3'25 shows 87% due to a one-time $15.93 billion non-cash charge tied to the One Big Beautiful Bill Act (14% excluding it); Q1'26 shows (23%) due to an $8.03 billion benefit under U.S. Corporate Alternative Minimum Tax transitional relief (Treasury Notice 2026-7), 14% excluding it. Footnote 3 says excluding the $9.89 billion charge and tax effect related to the August 2026 agreement with U.S. State Attorneys General, the Q3'26 rate would have been 17%.
Three-row table with a dark slate effective-tax-rate row, superscript footnote markers on Q3'25, Q1'26 and Q3'26 column headers, and three numbered footnotes at the bottom.
Single-series bar chart of net income (in millions): $15,688 (Q3'24), $20,838 (Q4'24), $16,644 (Q1'25), $18,337 (Q2'25), $2,709 (Q3'25), $22,768 (Q4'25), $26,773 (Q1'26), $15,848 (Q2'26) and $9,860 (Q3'26). Footnotes give adjusted figures: Q3'25 would have been $18.64 billion excluding the tax charge, Q1'26 $18.74 billion excluding the tax benefit, and Q3'26 $19.05 billion excluding the $9.89 billion State Attorneys General charge net of tax.
Nine dark slate bars with bold value labels above, footnote markers on three quarter labels, and three footnotes at the bottom.
Bar chart of diluted EPS: $6.03 (Q3'24), $8.02 (Q4'24), $6.43 (Q1'25), $7.14 (Q2'25), $1.05 (Q3'25), $8.88 (Q4'25), $10.44 (Q1'26), $6.18 (Q2'26) and $3.83 (Q3'26). Footnotes: Q3'25 EPS would have been $7.25 excluding the tax charge; Q1'26 would have been $7.31 excluding the tax benefit; Q3'26 would have been $7.40 excluding the State Attorneys General charge net of tax (an increase of $3.57).
Mirrors the net income slide — nine slate bars with value labels and three footnotes beneath the axis.
Capital expenditures (in millions) compared quarterly and year-to-date: Q3'25 $19,374 vs. Q3'26 $34,906, and YTD 2025 $50,078 vs. YTD 2026 $85,824. Footnote: capex includes purchases of property and equipment and principal payments on finance leases.
Four wide bars grouped into 'Quarterly' and 'YTD' pairs, each group marked by a light gray label bar beneath the axis; definition footnote at the bottom.
Family DAP in billions: 3.29 (Q3'24), 3.35, 3.43, 3.48, 3.54 (Q3'25), 3.58, 3.56 (Q1'26), 3.60 and 3.64 (Q3'26). A footnote attributes the slight Q1'26 decline to internet disruptions in Iran (largely restored in Q2'26) and a restriction on access to WhatsApp in Russia. Further text defines a DAP as a registered, logged-in user of Facebook, Instagram, Messenger and/or WhatsApp who visited at least one Family product on a given day, and explains the machine-learning-based de-duplication of accounts.
Nine tall slate bars with labels above, a footnote under the axis and two dense definition paragraphs filling the lower third of the slide.
Family ARPP: $12.29 (Q3'24), $14.25 (Q4'24), $12.36 (Q1'25), $13.65 (Q2'25), $14.46 (Q3'25), $16.56 (Q4'25), $15.66 (Q1'26), $16.86 (Q2'26) and $17.72 (Q3'26). ARPP is defined as FoA revenue in a quarter divided by the average of DAP at the beginning and end of the quarter.
Nine-bar chart with dollar labels above each bar and a one-line definition footnote at the bottom.
Five small bar charts of year-over-year growth in ad impressions for Q3'25–Q3'26. Worldwide: 14%, 18%, 19%, 14%, 10%. US & Canada: 8%, 13%, 13%, 9%, 8%. Europe: 9%, 13%, 17%, 13%, 8%. Asia-Pacific: 23%, 24%, 23%, 17%, 14%. Rest of World: 9%, 14%, 17%, 12%, 8%. Growth decelerated in every region in Q3'26.
Small-multiples grid — three charts on the top row and two on the bottom — each with a light gray region label band under its five-bar axis; geography footnote at the bottom.
Five small bar charts of year-over-year change in average price per ad for Q3'25–Q3'26. Worldwide: 10%, 6%, 12%, 12%, 14%. US & Canada: 13%, 9%, 14%, 20%, 23%. Europe: 19%, 12%, 19%, 10%, 10%. Asia-Pacific: 1%, (2)%, 5%, 1%, 1%. Rest of World: 20%, 15%, 18%, 21%, 24%. Pricing growth accelerated worldwide to 14% while impression growth slowed.
Same small-multiples grid as the impressions slide, including a below-axis negative bar for Asia-Pacific Q4'25.
Section divider introducing the appendix.
White slide with the single word 'Appendix' left-aligned at mid-height and the Meta logo bottom right.
Non-GAAP reconciliation (in millions) from net cash provided by operating activities, less purchases of property and equipment, less principal payments on finance leases, to free cash flow. Q3'26: operating cash flow $32,786, purchases of property and equipment $33,942, finance lease payments $964, free cash flow $(2,120) — compared with $10,625 in Q3'25 and $784 in Q2'26. A footnote lists limitations of FCF as a non-GAAP measure.
Four-row, nine-column table with a dark slate Free Cash Flow total row and a non-GAAP disclaimer paragraph at the bottom.
Text slide under the 'Family Metrics' heading explaining that DAP and ARPP are estimated from internal data on user account activity, that methodologies require significant judgment, that estimates differ from third-party data, and that multiple accounts are attributed to individual people using algorithms and machine learning; Meta estimates the error margin is generally approximately 3% of worldwide DAP.
Full-width justified text in four paragraphs beneath the slide title, with a bold 'Family Metrics' subheading.
Continues the disclosure: DAP is estimated with machine learning models calibrated against user survey data using signals such as device information, IP addresses and user names, with fewer signals for encrypted WhatsApp. It describes 'violating' accounts (bots and spam) — in Q4 2025 Meta estimated less than 5% of worldwide DAP consisted solely of violating accounts after a methodology update — and a 'User Geography' section noting that location is estimated from IP address and self-disclosed location and can be distorted by proxy servers.
Two long justified paragraphs followed by a bold 'User Geography' subheading and a final paragraph.
Closing slide repeating the cover: 'Meta Earnings Presentation Q3 2026' with investor.atmeta.com and the Meta logo.
Identical to the cover — left-aligned two-line title, URL bottom left, logo bottom right.
Các câu hỏi phổ biến về slide này và nội dung trình bày cơ bản.
It is Meta Platforms' 18-slide results deck for the third quarter of 2026. It covers advertising and total revenue by user geography, Family of Apps and Reality Labs segment results, expenses as a percentage of revenue, effective tax rate, net income, diluted EPS, capital expenditures, Family DAP and ARPP, ad impressions and price-per-ad growth by region, a free cash flow reconciliation and an appendix on the limitations of key metrics.
According to the slides, total revenue was $64,601 million (advertising $63,061 million), total income from operations was $12,988 million with a 20% operating margin, net income was $9,860 million and diluted EPS was $3.83. Family daily active people reached 3.64 billion and ARPP was $17.72.
The footnotes point to a $9.89 billion charge related to the August 2026 agreement with U.S. State Attorneys General. Excluding that charge net of related tax effect, net income would have been $19.05 billion and diluted EPS $7.40, and the effective tax rate would have been 17% instead of 24%. General and administrative expense also rose to 23% of revenue on the expenses slide.
Capital expenditures, including principal payments on finance leases, were $34,906 million in Q3 2026 versus $19,374 million in Q3 2025, and $85,824 million year to date in 2026 versus $50,078 million in 2025. Free cash flow was $(2,120) million in the quarter as purchases of property and equipment of $33,942 million exceeded operating cash flow of $32,786 million.
Worldwide ad impressions grew 10% year over year (down from 14% in Q2'26), while average price per ad grew 14%. Price growth was strongest in Rest of World (24%) and US & Canada (23%); Asia-Pacific had the fastest impression growth (14%) but only 1% price growth.
Yes. The page offers the original PDF and a PPTX version converted from it, so you can reuse the table and chart layouts in PowerPoint or Google Slides. As a machine-converted file, some charts may come through as images or need minor formatting cleanup.
Yes. Its consistent structure — a single slate color family, one title style, nine-quarter trend charts with labeled values, highlighted total rows in tables and small-multiple regional charts — is a solid pattern for quarterly business reviews, board updates or investor relations decks.
The deck was published on Meta's investor relations site, investor.atmeta.com, alongside the earnings press release and conference call materials on October 28, 2026. Meta's quarterly results are also filed with the SEC.
Official investor relations site hosting Meta's quarterly earnings presentations, press releases and SEC filings.
Original PDF of the Q3 2026 earnings presentation as published by Meta's IR site.

Create Your Own Slides
Turn your ideas into professional presentations in seconds with 2slides AI.
Tham khảo thiết kế chuyên nghiệp, chọn phong cách của bạn và tạo slide với kết xuất văn bản hoàn hảo. Được hỗ trợ bởi Nano Banana—bắt đầu tạo trình bày của bạn ngay bây giờ.
Đại Lý AI Của Bạn Cho Slide. Tiết kiệm thời gian, tỏa sáng nhanh hơn với việc tạo bài thuyết trình thông minh.


© 2026 2slides. Bảo lưu mọi quyền.