
Thuộc bộ sưu tập Ví dụ bài thuyết trình cho nhà đầu tư · Mẫu thuyết trình nhà đầu tư Nhật Bản
Mercari Q1 FY2027 Earnings Presentation — A Japanese-language earnings deck from Mercari, Inc. covering the first quarter of fiscal year FY2027.6 (July to September 2026), with consolidated results (revenue 630 and core operating profit 150, both in ¥100 million (億円) units), segment reviews of Marketplace, Fintech and US, ESG updates, and financial appendices. The original was published on TDnet (the Tokyo Stock Exchange's Timely Disclosure network) on 2026-11-12.
Dùng trang bìa của bài trình bày này làm mẫu phong cách cho các slide tạo từ nội dung của bạn. Hoặc chọn bất kỳ trang nào bên dưới để lấy bố cục của trang đó làm tham chiếu.
Điều Hướng Nhanh
Thẻ
Chia sẻ slide
Mercari Q1 FY2027 Earnings Presentation — A Japanese-language earnings deck from Mercari, Inc. covering the first quarter of fiscal year FY2027.6 (July to September 2026), with consolidated results (revenue 630 and core operating profit 150, both in ¥100 million (億円) units), segment reviews of Marketplace, Fintech and US, ESG updates, and financial appendices. The original was published on TDnet (the Tokyo Stock Exchange's Timely Disclosure network) on 2026-11-12.
Xem chi tiết từng trang slide, bao gồm bố cục, nội dung chính và các phần tử trực quan.
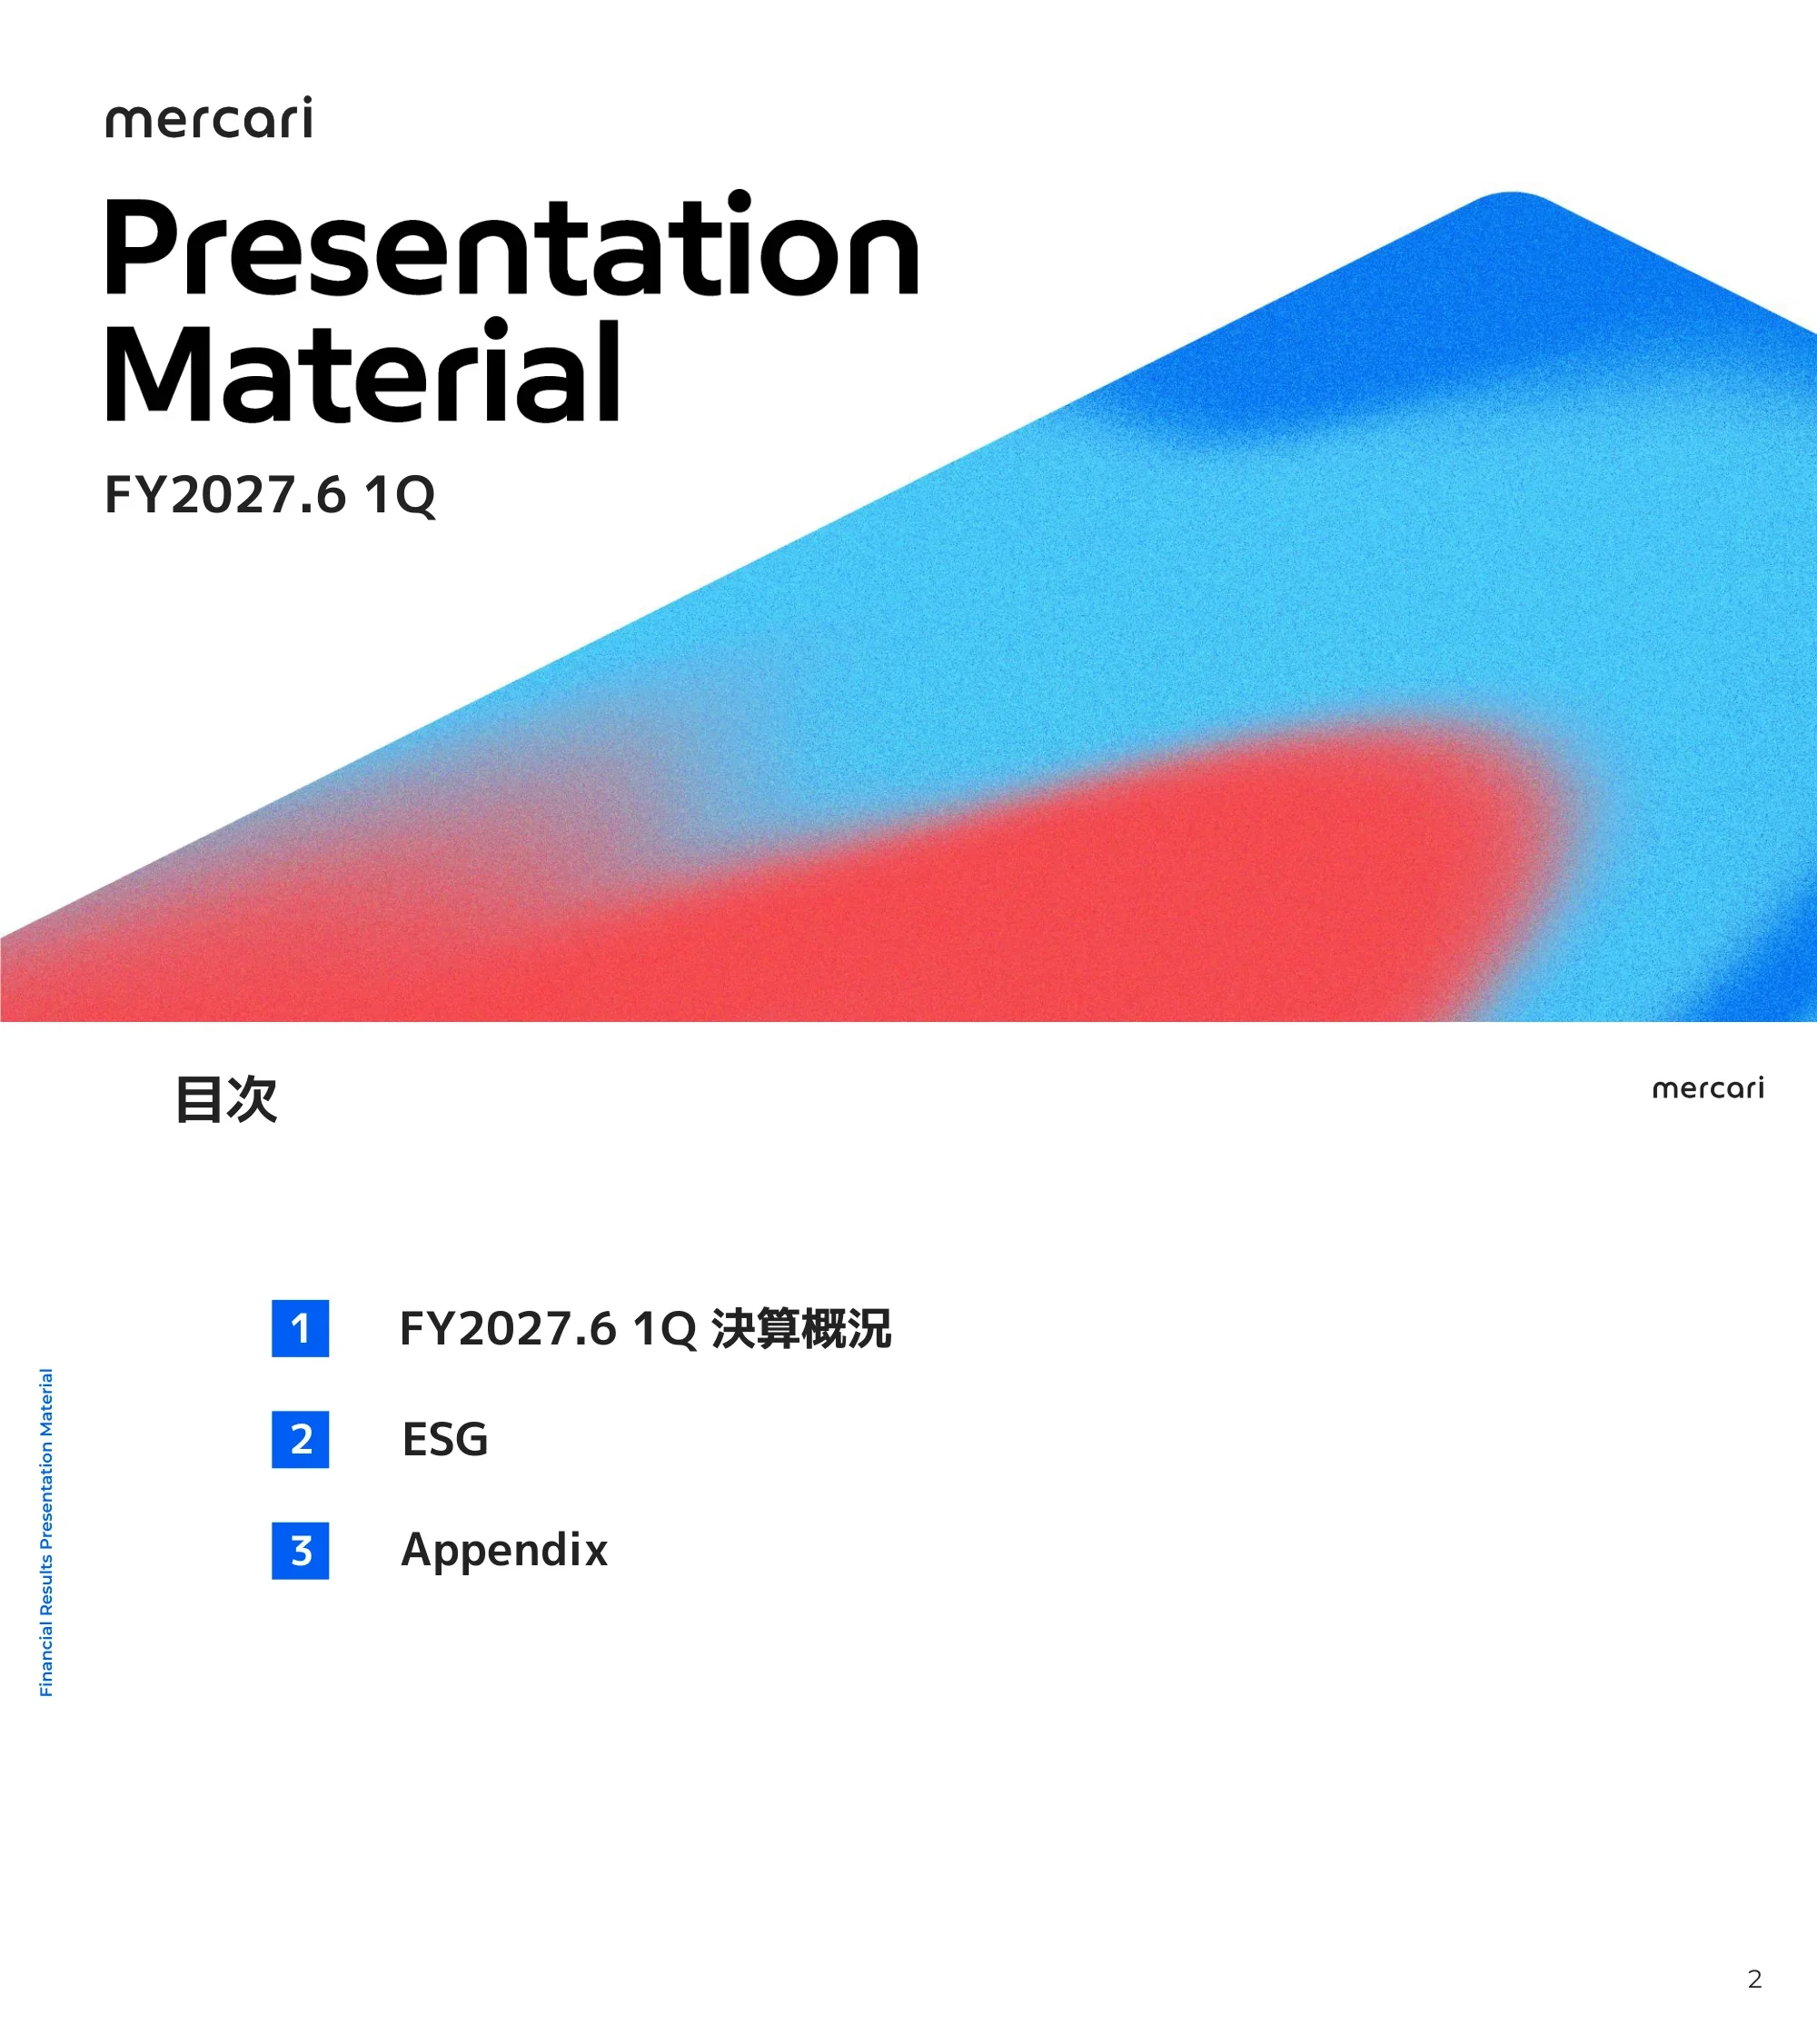
Cover slide of the Mercari financial results presentation material for the first quarter of fiscal year FY2027.6. It carries only the company name, the document title and the period label.
Left-aligned logo, large title and period label on a white background, with a blue-to-red gradient wedge across the lower right.
The deck has three sections: 1. FY2027.6 1Q results overview, 2. ESG, 3. Appendix.
Three numbered blue squares stacked vertically, each followed by a section name, with a rotated running header on the left edge.
States the group mission in Japanese with the English line 'Circulate all forms of value to unleash the potential in all people'.
Title at top left, a large central illustration of diverse people with an infinity-loop motif and floating item icons and coins, and the mission statement in two lines beneath.
Section divider introducing the first section, the Q1 FY2027.6 results overview.
Section title left-aligned in the middle of a white slide with a diagonal blue-to-red gradient band at the bottom.
Full-year consolidated forecast set at the start of the year: revenue 2,600-2,900 and core operating profit of 450 or more (¥100 million units, 億円). Q1 delivered revenue of 630 (+28% YoY) and core operating profit of 150 (+60% YoY), described as record highs, with Marketplace strong and Fintech growing around the Mercard card. Core operating profit is expected to fall quarter over quarter in Q2 as planned investments begin, and the full-year core operating profit forecast is unchanged.
Top panel with the initial full-year forecast and group policies, bottom panel with two KPI cards on the left (revenue and core operating profit) and two commentary boxes on the right, plus a footnote defining core operating profit.
Two nine-quarter bar charts. Revenue rose from 449 in Q1 FY2025.6 to 630 in Q1 FY2027.6 (+28% YoY), and core operating profit rose from 40 to 150 (+60% YoY), in ¥100 million units. The most recent prior quarters were 620 and 93 respectively. Footnotes explain that gains and losses on sales of intangible assets are now shown separately and included in core operating profit, with prior periods restated.
Two side-by-side column charts with quarter labels grouped by fiscal year, the latest bar highlighted in dark blue with a YoY callout, and small-print footnotes below.
Marketplace GMV 3,320 (+23% YoY) and core operating profit 115 (+30 YoY); Fintech receivables balance 3,891 (+45% YoY) and core operating profit 59 (+32 YoY); US GMV 194 million dollars (+0.3% YoY) and core operating profit 0.9 (-5 YoY). Amounts are in ¥100 million units unless stated.
Three vertical columns headed Marketplace, Fintech and US, each with two white KPI cards (volume metric above, core operating profit below) and footnotes defining GMV, core operating profit and receivables.
Initial policy: continue strengthening the core product experience while focusing on cross-border transactions, targeting GMV growth of +10% to +15% YoY and core operating profit of 450 or more. Q1 GMV grew +23% YoY with steady MAU growth and ARPU improvement, driven partly by entertainment and hobby categories. Core operating profit was 115 (+36% YoY) because no large marketing campaign ran in Q1; investment in marketing and services is planned from Q2 and the full-year guidance is unchanged.
Blue banner with the initial business policy at top, a pointer arrow, and three white commentary boxes stacked below.
GMV reached 3,320 (¥100 million units, +23% YoY) and MAU 2,394 (in units of 10,000 people, +4% YoY). Marketplace revenue was 341 (+26% YoY). Footnotes define GMV, MAU and note that results from a discontinued service are included from Q4 FY2025.6.
Left panel combines GMV columns with an MAU line across nine quarters; right panel shows revenue columns. Latest quarter is highlighted with YoY callouts.
Marketplace core operating profit was 115 (+36% YoY) with a margin of 34% (+3 percentage points YoY). The cost composition chart shows, for Q1 FY2027.6, advertising at 18%, other SG&A at 6% and payment fees at 23% of revenue, with the other cost categories shown as percentages in the stacked bars.
Left: columns for core operating profit with a margin line. Right: 100% stacked columns showing the mix of cost categories and profit for nine quarters, with a legend above.
Mercari continued building a safe marketplace, including a temporary listing ban on certain items related to a Pokemon card game expansion (from 2026-09-16, ended 11-10), and signed an information-sharing agreement on fraudulent transactions with the police agency on 2026-07-09. The Pokemon card game accounts for 15% of entertainment and hobby GMV, which the deck presents as evidence of diversified IP-driven growth.
Two bullet lines under the title, then two rounded panels: left with trust and safety actions, right with a pie chart showing 15% versus 85% (other).
Average time from item arrival at the center to compensation fell from 51.4 hours (first half of 2025) to 35.3 (first half of 2026) and 19.4 (July to September 2026), a reduction of 32 hours, while 99.6% of compensation is completed within 48 hours. A new feature that estimates the price of belongings from a camera or barcode scan launched on 2026-09-17.
Two panels: left with explanatory text and a three-bar chart with a red '32 hours reduction' callout; right with feature description and a promotional banner image of the feature.
Initial policy: enhance seamless payment and credit experiences through partnerships, targeting Fintech core operating profit of 100 or more. A free-enrollment campaign for a premium card tier supported Mercard member acquisition, off-Mercari volume grew, and the receivables balance rose +45% YoY to 3,891. Core operating profit was 59 (+117% YoY), helped by credit profitability and no large marketing campaign; a quarter-over-quarter decline is expected in Q2 as investment in expanding the Merpay customer base begins.
Blue policy banner at top, pointer arrow, and two white commentary boxes below, with footnotes on definitions.
Fintech revenue was 201 in Q1 FY2027.6 (+42% YoY), up from 116 in Q1 FY2025.6, in ¥100 million units. The breakdown shows Credit at 129 (+55% YoY), Payment at 58 and Others at 13. Footnotes note the effective annual rate on certain installment receivables was revised to 18%.
Left: single-series revenue columns. Right: stacked columns split into Credit, Payment and Others with segment values labelled; latest quarter highlighted.
Fintech core operating profit reached 59 (+117% YoY) versus 27, 18, 27 and 17 in the four quarters of FY2026.6 and 4 in Q1 FY2025.6. Advertising expense in Q1 FY2027.6 was 26, down from 59 in Q4 FY2026.6. Amounts are in ¥100 million units.
Two side-by-side column charts for nine quarters, each with the latest quarter highlighted, and footnotes at the bottom.
The receivables balance grew to 3,891 (+45% YoY), of which fixed-amount and installment receivables (3 or more payments) were 2,683 (+46% YoY), next-month payment and 2-payment installments 683 and Smart Money 524. The 11-month collection rate was 99.4%. Amounts are in ¥100 million units.
Stacked column chart for nine quarters with three receivable categories, a red line above showing the collection rate, a legend at left, and YoY callouts for the latest quarter.
Mercari highlights its in-house AI credit models, based on usage and behavior data and external credit information, and stepwise credit-limit expansion reviewed monthly. The expected default rate assigned by rating agencies for non-recourse securitization has improved by about 30% over four years, shown in a declining line from January 2023 to January 2026.
Two bullet lines on top, then two panels: left with AI credit and risk-control text; right with explanatory text and a declining line chart with a red '30% improvement over 4 years' badge.
Initial policy: maintain break-even while targeting full-year GMV growth of +10% or more by strengthening the core experience. Q1 GMV was +0.3% YoY, with entertainment and hobby, home appliances and cosmetics strong but low-priced fashion weak amid competitor promotions. Despite GMV below plan, break-even was maintained through optimized marketing investment and disciplined cost management.
Blue policy banner at top, pointer arrow, and three white commentary boxes below.
US GMV was 194 million dollars (+0.3% YoY) with MAU of 420 (units of 10,000 people, -2% YoY). Revenue was 99 (+4% YoY) and core operating profit was 0.9, both in ¥100 million units. The core operating profit chart shows small positive values in recent quarters after a loss of 8 in Q1 FY2025.6.
Three panels: GMV columns with an MAU line, revenue columns, and core operating profit columns including negative bars, each with the latest quarter highlighted.
Section divider introducing the second section, ESG.
Section title on a white slide with a diagonal blue-to-red gradient band at the bottom.
Mercari published the FY2026.6 Impact Report on 2026-09-17. Greenhouse gas reduction contribution from transactions on Mercari in Japan and the US in the covered categories is about 850,000 tonnes of CO2-equivalent per year, equated to about 350 Tokyo Domes, about 97 million cedar trees' annual absorption, and about 390,000 round trips between Tokyo and New York.
Two bullet lines, then a green-bordered infographic with a large number on the left followed by three equivalence icons connected by equals signs; footnotes list categories and sources.
A transparency report on trust and safety efforts (first half of 2026 edition) was published on 2026-08-03. The inquiry rate related to transactions fell to 0.35%, a record low, and the compensation rate under the full-compensation support programme was 99.5%. Other figures include a fraudulent transaction rate of 0.0057%, 79% eKYC-completed high-value transactions, 13.63 million passkey registrations and about 510,000 restricted accounts or cases.
Two bullet lines on top, then a green panel: left has a grid of small metric cards grouped under fraud elimination and customer relief; right has a five-period column chart of the inquiry rate with a declining arrow.
Section divider introducing the third section, the Appendix.
Section title on a white slide with a diagonal blue-to-red gradient band at the bottom.
The board has 12 directors: 4 internal directors and 8 independent outside directors. A lead independent outside director was established in September 2025 to strengthen board independence and oversight. Roles shown include the CEO (President), a chairman who is also CEO of a football club subsidiary, the CFO, and chairs of the nomination, compensation and audit committees. Names are in Japanese and are not transliterated here.
Boxed grid with 'Directors: 12' header, an internal directors group (dashed grey box) on the left and an independent outside directors group (dashed blue box) on the right, each with circular portraits, names and roles.
Maps reporting segments: Japan Business consists of Marketplace (Mercari consumer-to-consumer, cross-border transactions, Mercari Shops business-to-consumer), Fintech (Payment, Credit, Crypto via Merpay and Mercoin) and Other Bets (mobile virtual network operator service). Separate segments are US (Mercari US), Others (the football club subsidiary and the India development base) and Adjustments (company-wide costs and consolidation adjustments).
A bracket labelled Japan Business spans the first three blue pills; white pills for US, Others and Adjustments follow, each with white boxes listing the businesses beneath.
Retained earnings turned positive in FY2026.6 and Mercari carried out its first share buyback in August 2026, with the acquired treasury shares cancelled on 2026-11-12. Equity will be built up in stages as Fintech expands, and debt financing is prioritized for funds needed by the credit business. Cash beyond internal reserves is allocated first to growth investment including M&A and then to self-investment centered on share buybacks, with buybacks prioritized over dividends.
Two bullet lines at top, then two rounded panels: internal reserve level on the left and capital allocation priorities on the right with a numbered list.
Total assets at the end of Q1 FY2027.6 were 7,072 (¥100 million units). Assets include cash and deposits 1,290, trust and custody assets 566 and 306, operating and other receivables 3,936 (of which credit receivables 3,891) and other 972. Liabilities and equity include convertible bonds and borrowings 405, deposits received 2,654, securitization borrowings 2,188 (of which non-recourse 1,848), other 443 and capital 1,379.
Two stacked bar columns (assets left, liabilities and equity right) with colored blocks and labelled amounts, explanatory callouts on both sides, a total assets figure below and footnotes.
As volume grew, the limit for non-recourse next-month payment receivables securitization was raised to 600 (¥100 million units). Other limits shown are 500 for Smart Money securitization and 1,077 outstanding plus a 340 limit for fixed-amount and installment receivables. Mercari aims to diversify risk by using different arrangers and investors per service.
Two bullet lines, then a stacked column of credit receivables beside a stacked column of funding sources with right-hand brackets and explanatory notes.
Stacked quarterly cost columns for Marketplace in ¥100 million units. In Q1 FY2027.6 advertising was 61, other SG&A 21, payment fees 78, personnel (SG&A) 12, personnel (cost of sales) 15 and cost of sales (other) 35. Q4 FY2026.6 advertising was 84.
A single stacked column chart for nine quarters with values labelled in each segment and a six-item legend at the right.
Mercari's 2025 GMV was 1 trillion 1,667 x ¥100 million (億円) (YoY +6%) within an online market that the slide cites as 2 trillion 6,870 x ¥100 million (YoY +6%, including B2B and B2C transactions) and a reuse market of about 3.5 trillion yen. Mercari's share of the online CtoC market was 41.8% in 2023, 43.5% in 2024 and 43.4% in 2025. The estimated value of unused goods is about 7.6 trillion yen per year.
Large grey background collage of household items with nested market-size boxes, a blue GMV block, a red growth arrow, a share table in the lower right and large text on unused goods value; sources in footnotes.
Product transformation is grouped into development structure, trust and safety, and customer experience. Dated items include belongings valuation and virtual try-on (2026.9), a reply assist for buyer comments (2026.8), Apps in ChatGPT (2026.6), generative AI search refinement (2026.3) and AI listing support (2024.9, awarded a 2025 Good Design Award per the slide). Development items include AI Pods and a newly adopted research project on AI robots for listing and inspection automation (2026.9).
Title, one summary bullet, and a rounded container with three blue columns: development structure, trust and safety, and a wider customer experience column containing a grid of feature cards with small screenshots.
Mercari describes a move from individual AI use to team-level work transformation, with three areas: organizational foundation, AI governance and security, and AI-Native transformation of non-engineering functions. Dated items include an AI Agent Day extended to the US and India (2026.8-9), a permanent AI Management Office (2026.7), a combined CHRO and CAIO structure (2026.6), a group AI usage policy (2026.3), an AI governance body (2025.10) and an AI Task Force launched with about 100 people (2025.7).
Title, one summary bullet, and a pink container with three red columns of white text cards, each card labelled 'New!' or dated.
Standard disclaimer: the material is for information only and not a solicitation to trade securities, forward-looking statements are not guarantees, and the deck may include unaudited management figures. It announces that the Q2 FY2027.6 results are scheduled for 2027-02-08 at 15:30 or later. The Mercari logo and securities code 4385 appear at the bottom.
Text-only slide with a heading, a paragraph of disclaimer text, a red highlighted announcement line and the logo with securities code at the bottom.
Các câu hỏi phổ biến về slide này và nội dung trình bày cơ bản.
This is a Japanese-language earnings presentation (決算説明資料), with only the cover and a few labels in English. The original was published on TDnet, the Tokyo Stock Exchange's Timely Disclosure network, on 2026-11-12. This gallery page describes the slides in English.
Mercari's fiscal year ends in June, so FY2027.6 is the fiscal year ending June 2027, and 1Q is its first quarter, covering July to September 2026. Quarters are labelled this way throughout the charts, for example 'FY2026.6 4Q' for April to June 2026.
Revenue was 630 (+28% YoY) and core operating profit was 150 (+60% YoY), both in ¥100 million (億円) units. The deck calls these record highs. Core operating profit is defined as IFRS operating profit excluding other income and other expenses.
The initial full-year forecast is revenue of 2,600-2,900 and core operating profit of 450 or more (¥100 million units). The deck states that the core operating profit forecast is kept unchanged, and that Q2 consolidated core operating profit is expected to decline quarter over quarter because of planned investments.
Marketplace GMV was 3,320 (+23% YoY) with core operating profit of 115. Fintech's receivables balance was 3,891 (+45% YoY) with core operating profit of 59. US GMV was 194 million dollars (+0.3% YoY) with core operating profit of 0.9.
It has 33 slides in three sections: the FY2027.6 1Q results overview (consolidated highlights, KPI summary, and Marketplace, Fintech and US reviews with quarterly charts), ESG (Impact Report and Transparency Report), and an appendix with the board, segments, capital allocation, balance sheet, securitization, market data, AI-Native transformation and a disclaimer.
The appendix covers the board of directors (12 members, 8 of them independent outside directors), segment definitions, capital allocation policy including a first share buyback in August 2026, the main balance sheet components (total assets 7,072 in ¥100 million units), Fintech securitization limits, Marketplace cost composition, market share data and AI-Native product and organization initiatives.
The final slide states that the Q2 FY2027.6 results are scheduled for 2027-02-08 at 15:30 or later.

Create Your Own Slides
Turn your ideas into professional presentations in seconds with 2slides AI.
Tham khảo thiết kế chuyên nghiệp, chọn phong cách của bạn và tạo slide với kết xuất văn bản hoàn hảo. Được hỗ trợ bởi Nano Banana—bắt đầu tạo trình bày của bạn ngay bây giờ.
Đại Lý AI Của Bạn Cho Slide. Tiết kiệm thời gian, tỏa sáng nhanh hơn với việc tạo bài thuyết trình thông minh.


© 2026 2slides. Bảo lưu mọi quyền.