
McKinsey Global Materials Perspective 2025 - Comprehensive Analysis of Materials Industry Trends and Outlook
Điều Hướng Nhanh
Thẻ
Chia sẻ slide
McKinsey Global Materials Perspective 2025 - Comprehensive Analysis of Materials Industry Trends and Outlook
Xem chi tiết từng trang slide, bao gồm bố cục, nội dung chính và các phần tử trực quan.
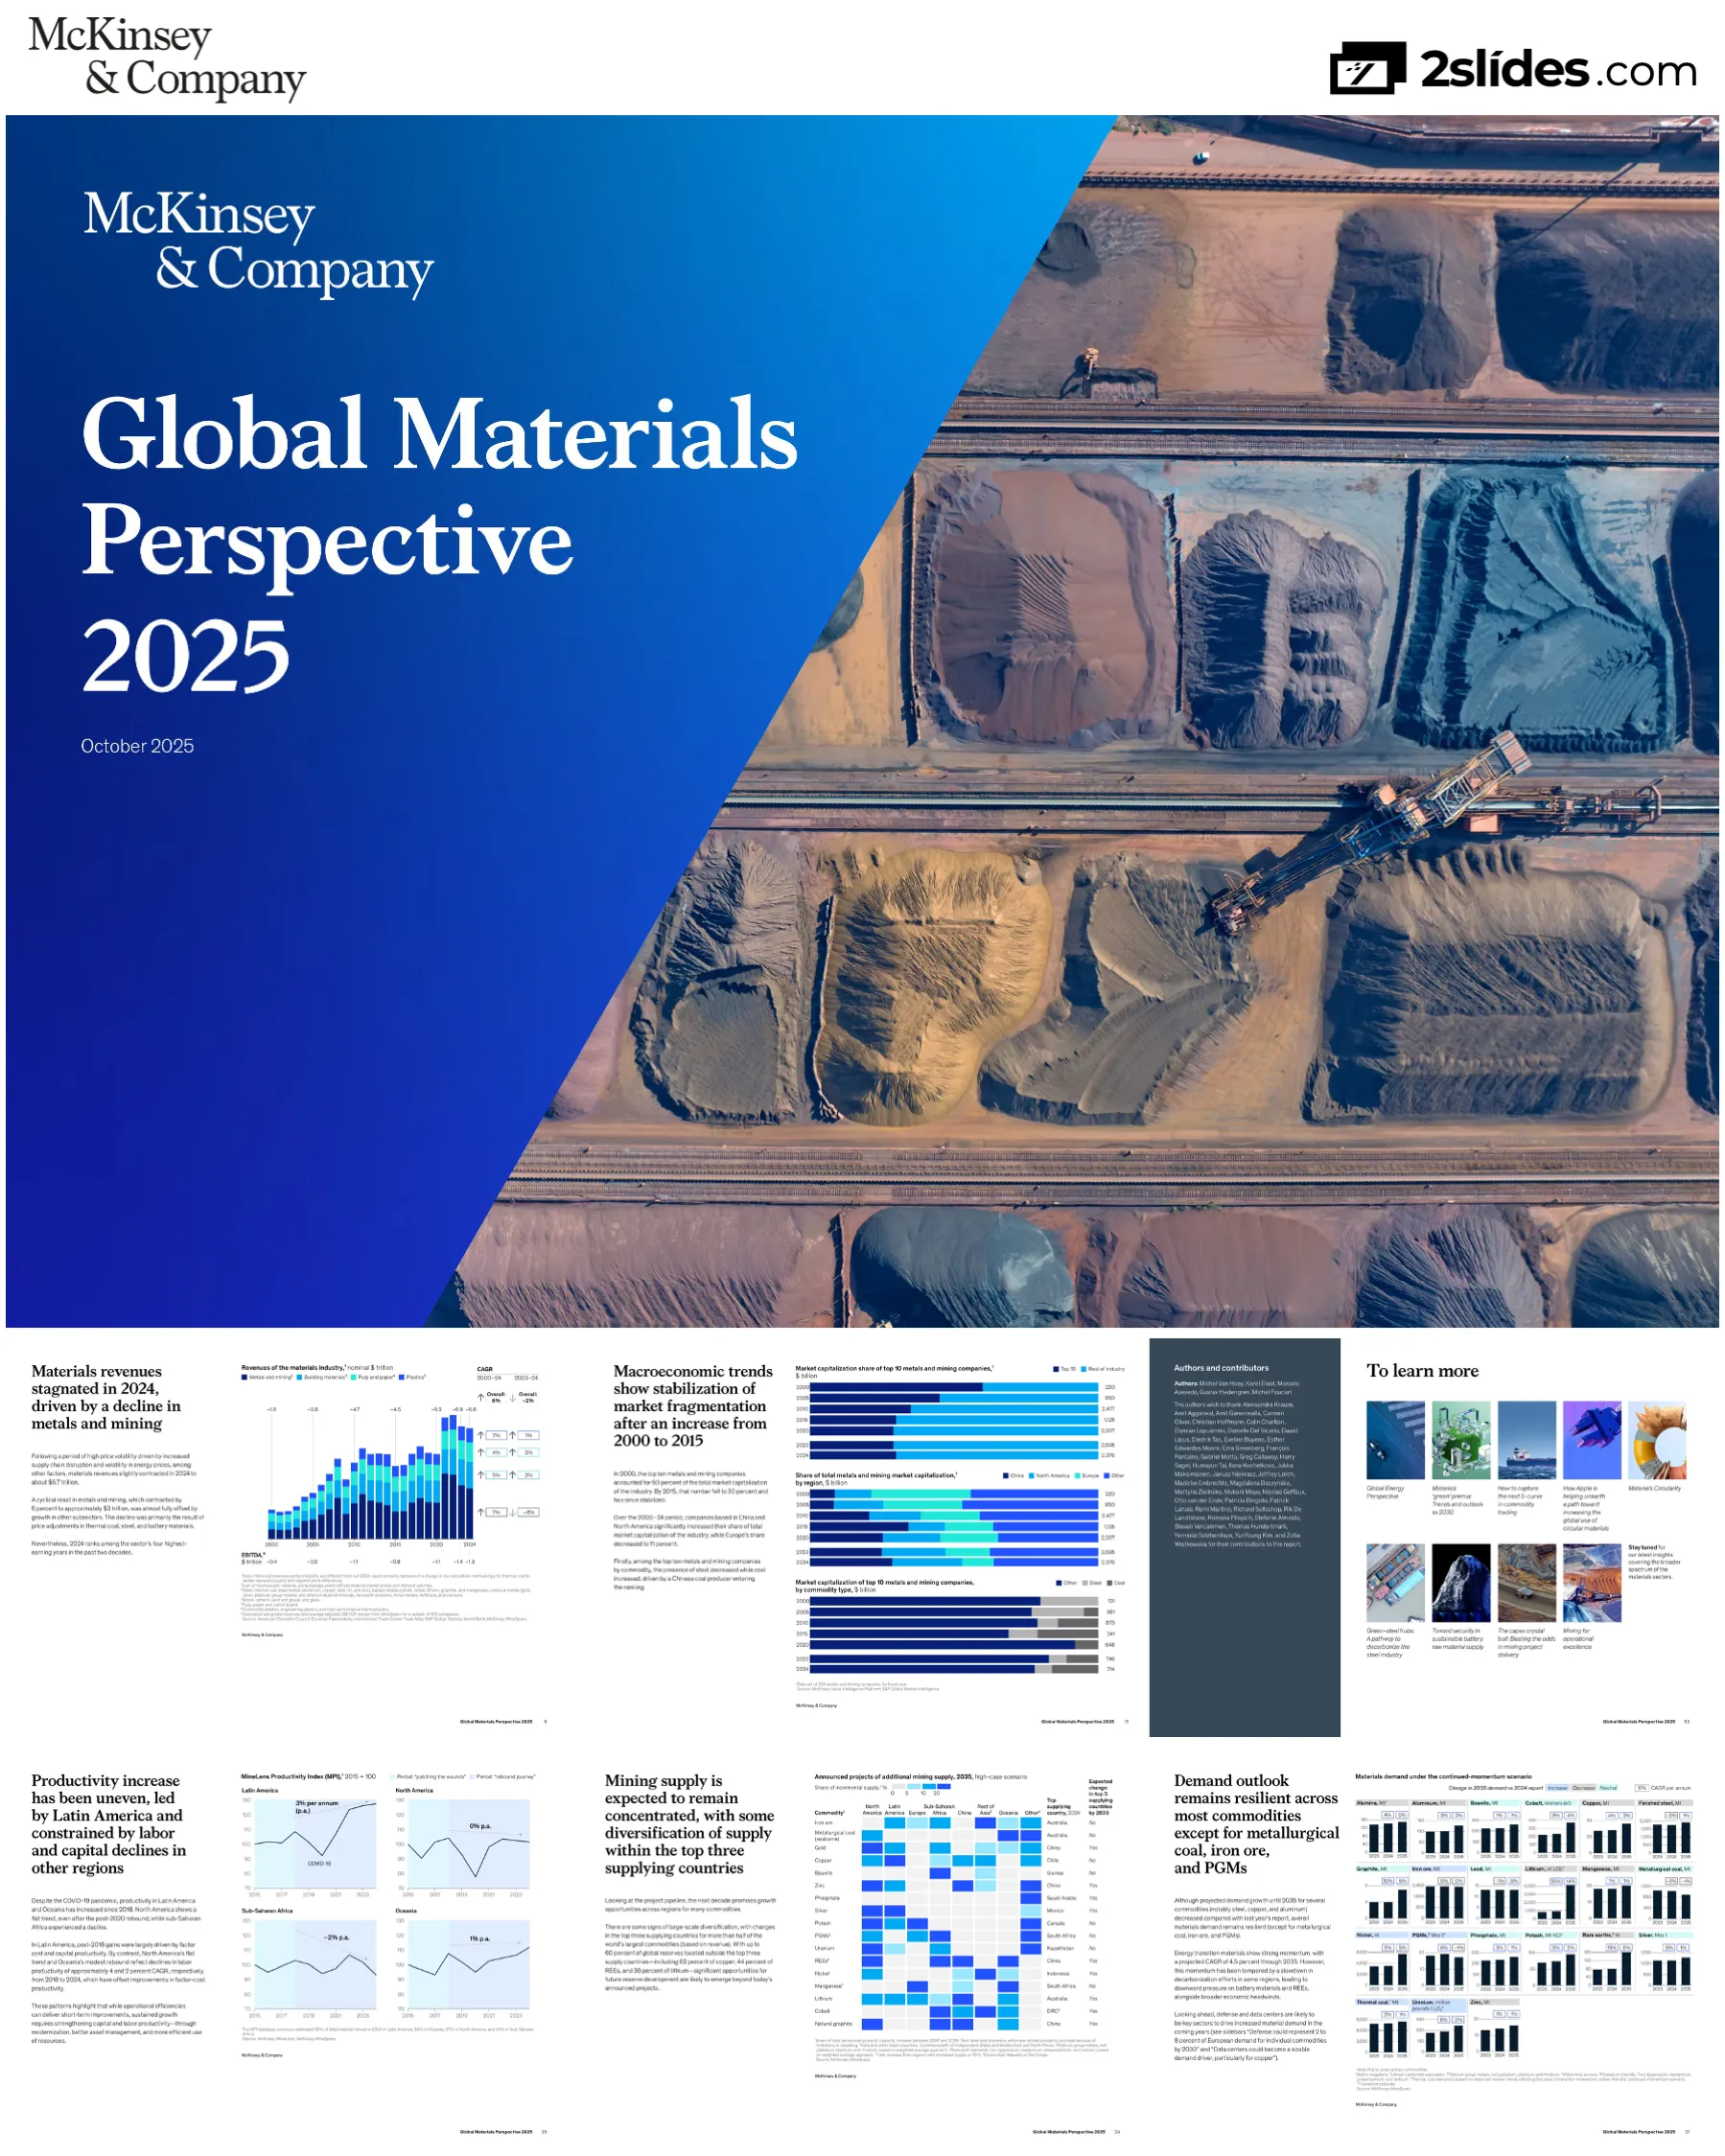
Title slide featuring McKinsey branding with dramatic aerial image of open-pit mining operations showing terraced extraction levels, conveyors, and industrial scale
Clean cover design with white McKinsey logo top left, large title typography on left half, striking mining photography on right half spanning full height
Explains report methodology, scope focusing on metals and mining driven by energy transition, introduces MineSpans database covering 14,000+ assets, and describes Energy Solutions and McKinsey capabilities
Two-column text layout on dark blue background, comprehensive paragraphs explaining report foundation and capabilities
Overview of 2024 industry shifts: revenue down 6% to $3T but profitability resilient at $1.3T, increased resource nationalism, AI/defense demand growth, productivity rebound signs, and decarbonization slowdown in select regions
Two-column layout with narrative text on left and mining infrastructure imagery on right, organized into four key shift categories
Continues outlook discussion: robust demand through 2035 driven by population growth and low-carbon tech, supply highly concentrated, need for trillions in investment. Identifies three opportunity areas: multilateral growth, productivity rebound, targeted sustainability
Continuation of two-column format with industrial imagery, structured text outlining strategic opportunities
Detailed explanation of three supply scenarios (base case, high case, full pipeline) based on project status from 'in operation' to 'unrealistic/in exploration', powered by 14,000+ assets database
Left side contains explanatory text, right side features detailed table showing project status categories and which scenarios include them
Presents three emissions reduction scenarios aligned with Global Energy Perspective, showing greenhouse gas emissions trajectories from 1990-2050, with continued momentum scenario (2.3°C warming) selected for this report
Large emissions trajectory graph spanning top, detailed scenario comparison table below with three columns for slow evolution, continued momentum, and sustainable transformation
Section divider introducing State of the Industry chapter with key message about coal/steel price corrections triggering revenue decline while gold, copper, aluminum maintained profitability
Blue gradient background (left to right), white text with section number and navigation, key summary statement in large typography
Four-column summary of key industry themes: (1) Growth and profitability - value pools shifting from steel/coal to gold/copper/aluminum, (2) Geopolitics - increased supply concentration and protective measures, (3) Decarbonization - progress slowed especially in EU steel, (4) Capital markets - strong TSR growth despite revenue declines
Four equal-width columns with numbered headers, bulleted key points under each theme
Stacked bar chart showing materials industry revenues from 2000-2024 broken down by metals/mining, building materials, pulp/paper, plastics. Shows ~$6.8T total in 2024 (flat from 2023), with metals/mining down 6% to $3T but offset by other sectors
Large stacked bar chart spanning full width, CAGR annotations on right, EBITDA line underneath bars
Two-part visualization: (1) Table showing price/volume/revenue changes 2023-2024 for top commodities, highlighting declines in steel (-12% price), thermal coal (-13%), battery materials (-26%), (2) Stacked bar chart showing revenue composition shift from 2023 to 2024
Left side contains delta table with arrows indicating direction, right side shows two stacked bar charts comparing 2023 vs 2024 revenue composition
Three-part analysis: (1) EBITDA trend 2000-2024 showing $0.7T in 2024, (2) Cash/short-term investments as % of assets remaining stable around 1.3%, (3) EBITDA pool composition showing shift from steel/coal (27%→23%, 38%→35%) to gold/copper/aluminum (10%→18%, 4%→6%, 9%→11%)
Three separate visualizations arranged horizontally, with time series on left/center and composition comparison on right
Comprehensive table showing strategic moves by exporting and importing countries: export barriers, domestic downstream integration, supply nationalization, bilateral agreements, import barriers, resource development funds, strategic projects, and strategic stock development
Three-column table with strategic moves, country examples, and opportunities for companies
Heat map matrix showing export barriers for commodities classified by production concentration (vertical axis: very high >90%, high 70-90%, medium 50-70%, low <50%) and commodity importance (horizontal axis: low 0-3 mentions, medium 4-7, high >7 on critical mineral lists). Highlights commodities with barriers imposed since 2024
Matrix/heat map with concentration on Y-axis, importance on X-axis, commodities placed in cells with color coding for barrier status
Two line charts comparing metals/mining vs S&P Global 1200 performance 2015-2024: (1) TSR grew 3.5x for metals/mining vs 2.3x for S&P, (2) Market cap doubled for metals/mining (2.0x) vs 1.9x for S&P
Two side-by-side line charts with indexed values (2015=100), showing dramatic outperformance especially 2020-2022
Three bar charts showing structural shifts 2000-2024: (1) Top 10 companies' share of market cap declined from 60% to 30% then stabilized, (2) Regional shifts with China and North America gaining share, Europe declining to 11%, (3) Commodity mix among top 10 showing coal entry, steel decline
Three horizontal stacked bar charts arranged vertically, each showing different dimension of market evolution
Bar chart decomposing TSR volatility by driver across five sectors (Aluminum mid/downstream, Copper upstream/integrated, Steel producers, Gold, Diversified players). Shows attribution to: company operating decisions (30-47%), company portfolio choices (11-28%), financial market momentum (12-53%), commodity price momentum (16-25%)
Five vertical stacked bar charts showing percentage attribution of TSR drivers, with legend explaining four driver categories
Heat map matrix showing excess TSR (adjusted for commodity price and market volatility) based on production growth quartile (vertical) and cost/capital productivity quartile (horizontal). Shows strongest performance (5-7% excess TSR) requires top quartile in both dimensions
4x4 matrix heat map with production growth on Y-axis, cost/capital productivity on X-axis, cells colored by TSR performance level
Section divider for Availability and Growth chapter, highlighting that global supply-demand gap expected to narrow by 2035 driven by more modest demand outlook vs 2024 report, while regional gaps narrow with strategic projects
Blue gradient background, white text, section navigation, key summary message
Three-column summary: (1) Demand outlook - resilient growth particularly for energy transition materials, slower EV adoption/tech shifts suggest more modest outlook vs 2024, defense and data centers emerging as growth drivers, (2) Supply outlook - ramp-up exceeded forecasts for some materials, Chinese companies account for 36% of new assets, supply remains geographically concentrated, (3) Supply-demand gap - narrowing globally, focus shifting to regional balances, innovations may further reduce gap, closing gap requires $4.7T capex and 270 GW power
Three equal columns with numbered headers and detailed bullet points under each
Two-part comparison of 2024 vs projections: (1) BEV sales penetration showing China 28%, Europe 16%, Global 14%, US 8% in 2024, (2) Renewable energy share showing Europe 32%, China 18%, Global 17%, US 18%. Updated Global Energy Perspective projections reduced: BEV share by 2035 from 52-82% to 47-76%, renewables by 2050 from 60-80% to 60-70%
Two line charts side by side showing regional trends 2018-2024, with projection updates shown below
Grid of 20 small bar charts showing 2023-2024-2035 demand forecasts for: Alumina, Aluminum, Bauxite, Cobalt, Copper, Finished steel, Graphite, Iron ore, Lead, Lithium, Manganese, Metallurgical coal, Nickel, Phosphate, PGMs, Potash, Rare earths, Silver, Thermal coal, Uranium, Zinc. Each shows CAGR and change vs 2024 report (increase/decrease/neutral arrows)
5x4 grid of mini bar charts, each with 3 bars (2023, 2024, 2035) and annotations showing CAGR and year-over-year change indicators
Analysis showing NATO Europe defense sector could account for 2% aluminum, 4% steel, 8% copper demand by 2030 (assuming 3.5% defense spending as % of GDP). Includes growth projections 2024-2030 and notable opportunities in specialized materials: military-grade steel (Eglin, Maraging), tool steel, electrical steel for drones, high-strength aluminum, extrusions
Three components: (1) Bar charts showing demand growth 2024-2030 for three commodities, (2) Defense share percentages, (3) Two text boxes describing notable opportunities
Projects data center capacity to grow 2.7x from 82 GW (2025) to 219 GW (2030), driven by AI expansion. Shows demand intensity per MW for various materials and resulting global demand growth by 2030: Steel +270% but <0.1% of global demand, Copper +270% representing 3.3% of global demand, Aluminum +270% representing 0.6% of demand
Three components: (1) Stacked area chart of capacity by region, (2) Material intensity table, (3) Three bar charts showing 2024 vs 2030 demand for Steel, Copper, Aluminum
Heat map showing announced mining supply projects by commodity (rows) and region (columns: North America, Latin America, Europe, Sub-Saharan Africa, China, Rest of Asia, Oceania, Other). Shows concentration levels and whether top 3 supplying countries expected to change by 2035. Highlights: Iron ore (Australia), Met coal (Australia), Gold (China→Yes change), Copper (Chile), Lithium (Australia→Yes), Cobalt (DRC→Yes)
Matrix heat map with commodities as rows, regions as columns, cells colored by share of incremental supply 2024-2035, final column shows expected change in top 3
Table showing 2035 supply-demand balance forecast for 13 commodities under base-case and high-case supply scenarios. Shows whether gap is narrowing (↘), eliminated (√), or unchanged (—) vs 2024 report. Includes undersupply/oversupply scale and key demand/supply drivers for each commodity. Notable changes: Nickel now showing potential oversupply, REEs and Uranium gaps narrowing, Copper and Lithium undersupply persists
Multi-column table with commodity names, supply-demand gap indicators (visual scale), change vs prior year, and narrative drivers columns
Bar chart comparison showing mining and refining self-sufficiency levels for key commodities in 2035: Europe, Europe + 13 Strategic Projects, and North America. Shows significant opportunities particularly for Lithium (North America 65% mine production self-sufficient), Natural graphite (North America 101%), Rare earth elements (92%). Europe remains heavily import-dependent even with strategic projects
Horizontal grouped bar charts for 6 commodities (Lithium, Nickel, Natural graphite, Manganese battery-grade, Copper, Rare earths), showing mine production and refined production separately
Table showing key demand-side and supply-side innovations with potential to disrupt supply-demand balances by 2035: Sodium-ion batteries, Solid-state batteries, Electrically excited synchronous motors (EESMs), Direct lithium extraction, Primary sulfide leaching, Deep-sea mining. Each evaluated on momentum, barriers to scale-up, impact on supply-demand gap and commodity prices
Detailed table with innovations as rows, multiple evaluation columns (momentum, barriers, S/D gap impact, price impact), traffic light indicators for momentum
Shows estimated reserves in Clarion-Clipperton Zone (CCZ) vs terrestrial sources for key battery materials: Manganese (CCZ: 5,992 Mt vs Terrestrial: 5,200 Mt), Copper (226 Mt vs 1,000 Mt), Nickel (274 Mt vs 150 Mt), Cobalt (44 Mt vs 13 Mt), Titanium (67 Mt vs 899 Mt). Discusses regulatory status: ISA exploration permits issued, Cook Islands advancing, US signaling support, Norway pausing
Horizontal grouped bar chart comparing CCZ nodules vs terrestrial reserves for 5 commodities, with explanatory text below
Compares composition and value of polymetallic deep-sea nodules (CCZ and Cook Islands) vs land-based nickel ores (Limonite and Sulfide). CCZ nodules valued at $500/ton with significant Manganese content (uncertain value), Cook Islands nodules $240/ton more Cobalt-rich. Key challenge: can manganese from nodules serve as viable alternative to land-based mining? Current trials haven't succeeded in converting manganese waste into alloys
Four stacked bar charts showing content composition and 2024 value per ton for each source, with waste vs valuable materials color-coded
Summary of three critical resource requirements to close supply-demand gap by 2035: (1) Energy: ~270 GW of new power capacity needed (no change vs 2024 report), plus 1,100 GW to decarbonize current industry, (2) People: ~350,000 new jobs needed (+40,000 vs 2024 due to shift to labor-intensive regions like Sub-Saharan Africa), mining/metallurgy graduates declining 75% in Australia, 40% in US (2011-2021), (3) Investments: $4.65T capex required (-$200B vs 2024 due to more modest demand), need $260B/year matching 2011-13 peak
Three-column layout with header boxes showing GMP 2025 requirements, change vs GMP 2024, and underlying challenge for each of the three resource categories
Two visualizations: (1) Line chart showing exploration cost per discovery increased from ~$50M (1975) to $250M+ (2019), over 5x increase, (2) Stacked bar charts showing exploration capex 2014-2024 by region (relatively flat ~$11-16B) and by commodity (gold dominant, battery materials growing at 28% CAGR, zinc/potash/coal declining)
Top: single line chart spanning decades, Bottom: two sets of stacked bar charts side-by-side showing 2014-2024 trends
Section divider for Productivity and Affordability chapter, with key message that despite more balanced supply-demand outlook, higher commodity prices still required to encourage sufficient supply to come online to meet demand
Blue gradient background, white text, section navigation, summary statement
Three-column summary: (1) Capital intensity and productivity - Following steep decline 2004-10 and flat phase 2010-18, productivity rebounding at 1% p.a. since 2018 due to automation and digital tech, uneven across regions, challenges remain from ore grade decline and labor shortages, (2) Price evolution - Price increases still required for several commodities (notably copper and battery materials) to encourage supply, upward pricing could result in substitution/demand destruction, (3) Next frontier of productivity - Opportunities in AI (geospatial mapping, ore sorting), Gen AI (capex derisking, maintenance), Automation (autonomous trucks), Electrification, Global sourcing diversification
Three equal columns with numbered headers and detailed bullet points
Four line charts showing MineLens Productivity Index components 2004-2024: (1) Overall index showing three phases: 'Volume at all costs' (-8% p.a. 2004-10), 'Patching the wounds' (0% p.a. 2010-18), 'Rebound journey' (1% p.a. 2018-24), (2) Labor productivity (1% p.a. 2018-24), (3) Capital productivity in real terms (1% p.a. 2018-24), (4) Factor cost productivity in real terms (2% p.a. 2018-24)
One large index chart at top spanning full width, three smaller component charts below in row
Four regional MineLens Productivity Index charts 2015-2024 showing divergent trends: Latin America (+3% p.a., strongest performer), North America (0% p.a., flat despite post-COVID rebound), Sub-Saharan Africa (-2% p.a., declining), Oceania (+1% p.a., modest positive). Latin America gains driven by factor cost and capital productivity, North America/Oceania constrained by labor productivity declines -4% and -2% CAGR respectively, Sub-Saharan Africa reflects losses in both labor and capital productivity
Four line charts arranged in 2x2 grid, each showing regional index 2015-2024
Six challenge categories with illustrative statistics: (1) Declining ore grades requiring more energy/processing (17% absolute copper mill-head grade reduction 2012-24), (2) Deeper pits and underground mining (28 p.p. increase in underground nickel over next 10 years), (3) Labor shortages (2.3x increase in mining job vacancies 2010-2023), (4) Rising operational costs (23% increase in copper costs forecast to 2035), (5) Environmental and community considerations (40% of mines in water-stressed areas by 2040), (6) Project cost and timeline overruns (78% of projects 2003-23)
Six boxes arranged in 2x3 grid, each with icon, challenge description, and key statistic
Three cost curve charts showing total cash cost to meet 2035 demand for Copper, Nickel, and Lithium in high-case scenario. Shows 2024 price line, C90 (90th percentile cost to meet demand), and cost to cover 100% of demand. Color-coding shows margin levels. Key finding: Lithium and Nickel have flatter curves (many projects clustered at similar costs) making margins highly sensitive to small demand shifts. Copper curve steeper, less sensitive. Volume with <10% margin to full demand: Copper 17%, Nickel 79% (limited new projects announced), Lithium 35%
Three horizontal cost curve charts, each showing volume on X-axis, cost on Y-axis, with price lines and margin zones color-coded
Six charts showing incentive price (NPV=0 at 15% discount rate) of announced projects vs 2024 average price and minimum price to meet 2035 demand for: Copper (+19% needed), Nickel (+16%), Lithium (+28%), Bauxite (0%), Uranium (-30%), Natural graphite (-49%). Shows distribution of project incentive prices and identifies gap between current prices and prices needed to bring sufficient supply online
Six small charts arranged in 2x3 grid, each showing incentive price distribution with 2024 price and minimum required price marked
Matrix showing improvement opportunities by cost category and technology/operational practice. Cost categories: Labor (25-30% of costs), Sustaining capex (20-25%), Energy (15-20%), Consumables (15-20%), Maintenance and spares (10%). Technologies: AI (workforce forecasting, predictive maintenance, process optimization), Gen AI (generative scheduling, issue resolution), Automation (robotization, autonomous electric trucks), Electrification (equipment electrification, thermal storage), Global supplier diversification
Matrix/table with cost categories as rows, technology categories as columns, specific opportunities in cells
Section divider for Sustainability chapter with key message: Mounting downward pressure on green premiums has slowed industrial decarbonization, with low-carbon technology relying on CO2 taxes or subsidies to support deployment
Blue gradient background, white text, section navigation, summary statement
Three-column summary: (1) An economic reality check - Most companies maintain long-term commitments, customer surveys show growing green demand but decreasing willingness to pay, subdued green premium indices, ~40% of DRI and 33% of low-carbon steel projects on hold or canceled in Europe in past 12-18 months, (2) Outlook lags behind Paris Accord - Metals/mining emissions ~7.4 Gt CO2 (20% of global) in 2024, projected decline only 6% by 2035, grid decarbonization largest driver (40% of decline), efficiency improvements 30%, recycled materials 20%, (3) Innovation and regulatory support - Many abatement levers 'in the money', deep-decarbonization levers remain uncompetitive, stronger innovation efforts required, regulation could boost development through unified thresholds and scrap collection incentives
Three equal columns with numbered headers and detailed bullet points
Bar chart comparing current (Now) vs 2030 projected share of green materials in procurement volume across 7 commodities: Steel (20%→31%, +11 p.p.), Aluminum (25%→33%, +9 p.p.), Copper (21%→31%, +10 p.p.), Nickel (16%→29%, +13 p.p.), Lithium (17%→31%, +14 p.p.), Plastics (29%→38%, +9 p.p.), Glass (22%→30%, +8 p.p.). Average increases from 21% to 32%
Paired bar chart showing Now vs 2030 for each commodity, with percentage point increase annotated
Three cumulative distribution charts comparing 2024 vs 2025 survey results on willingness to pay premiums for green materials in Steel, Aluminum, and Copper. Shows increasing share of customers unwilling to pay premiums: Steel (34%→52% no/limited premium), Copper (39%→51%), while Aluminum stayed relatively stable (~50%). Maximum willingness to pay thresholds defined for each: Steel <$120/t, Aluminum <$150/t, Copper <$800/t
Three S-curve cumulative distribution charts side by side, each comparing 2024 vs 2025 survey waves
Two waterfall charts showing status of announced low-carbon steel projects in Europe: (1) DRI capacity: 32.0 Mt announced as of Q4 2024, 14.0 Mt on hold/canceled, 7.5 Mt announced/financed, 10.5 Mt under construction as of Aug 2025 (40% of announced capacity on hold/canceled), (2) Low-CO2 steelmaking initiatives: 63 Mt announced, 21 Mt on hold/canceled, 27 Mt announced/financed, 15 Mt under construction (33% on hold/canceled)
Two side-by-side waterfall charts showing progression from announced capacity to construction status with intermediate stages
Two line charts comparing 2022 vs 2025 projections of steelmaking costs in Central Europe for: BF-BOF (baseline), Scrap EAF, NG DRI-EAF, H2 DRI-EAF. 2022 projection showed H2 DRI-EAF reaching parity with BF-BOF by 2037, NG DRI-EAF by 2032. 2025 projection pushes these out to >2040 and 2035 respectively. Main driver: increased electricity and hydrogen price projections
Two side-by-side line charts (2022 projection vs 2025 projection) showing cost trajectories 2026-2040 for four steelmaking routes
Waterfall chart showing emissions trajectory from 7,380 Mt CO2e in 2024 to 6,960 Mt in 2035, breaking down drivers: Production increase (+620), Grid decarbonization (-440), Efficiency improvements (-360), Higher share of recycled material (-210), Announced net-zero production (-30). Steel accounts for 87% of 2024 emissions, 82% of 2035 emissions
Waterfall chart with starting bar (2024), positive/negative drivers as intermediate bars, ending bar (2035), with breakdown by commodity type color-coded
Paired bar charts showing 2015 vs 2024 primary and recycled material volumes for 7 commodities: Steel (crude), Aluminum, Copper, Zinc, Nickel, Lithium, Cobalt. Shows growth in recycled volumes (18-2,156% increase 2015-24) but for most commodities, recycled share of total remained relatively stable. Exception: Zinc increased recycled share, Battery materials (Li, Co, Ni) saw dramatic growth from low base. Average collection and recovery rates shown: Steel 95%/95%, Aluminum 70%/85%, Copper 50%/70%, Zinc N/A/N/A, Nickel 65%/80%, Lithium 35%/30%, Cobalt 40%/80%
Seven paired bar charts (2015 vs 2024) arranged horizontally, with primary (blue) and recycled (dark blue) volumes stacked, collection/recovery rates shown below each
Three flow diagrams showing annual net scrap trade flows 2015-24 average for Steel, Aluminum, and Copper by region. Shows Europe and North America as major net exporters across all three materials. Steel flows primarily to Middle East/North Africa and 'Other Asia'. Copper flows to 'Other Asia'. Aluminum flows more complex with China as major importer. Callout notes transatlantic aluminum scrap price gap drove +44% YoY increase in US imports from EU (Q2 2024 vs Q2 2025)
Three side-by-side Sankey-style flow diagrams showing directional trade flows, with regions color-coded as net exporters (blue), neutral (gray), or net importers (red)
Section divider for The Way Forward chapter with message that various strategic moves exist centered on availability/growth, productivity/affordability, and sustainability to help players navigate uncertainties and capture opportunities
Blue gradient background, white text, section navigation, summary statement
Matrix of strategic opportunities for mining companies organized by chapter themes with priority themes and potential responses: Availability & Growth (Diversify geographically, Integrate vertically, Expand in critical materials, Build partnerships), Productivity & Affordability (Strengthen lean operations, Accelerate automation, Deploy traditional AI, Adopt gen AI solutions), Sustainability (Decouple supply chains, Collaborate downstream). Three numbered examples provided: (1) Shingo Prize awards for operational excellence, (2) Autonomous haulage systems 84% growth to 3,800 trucks, (3) AI-powered exploration start-up with 60+ active projects
Three-column table with Chapter, Priority Themes, and Potential Strategic Responses, plus three numbered example callouts on the right
Matrix of strategic opportunities for metals producers organized similarly: Availability & Growth (Leverage incentives, Strengthen scrap supply, Secure scrap access, Target niche growth sectors), Productivity & Affordability (Source globally, Diversify energy mix, Deploy traditional AI, Adopt gen AI solutions), Sustainability (Decouple supply chains, Reconfigure value chain). Three numbered examples: (1) Government incentives leading to local supply chain opportunities with accelerated permitting/financing, (2) Value chain reconfiguration with HBI hubs in low-cost regions, (3) Expanded scrap collection infrastructure with OEM partnerships
Three-column table structure with examples numbered 1, 2, 3 on the right side
Matrix of strategic opportunities for materials procurement/buying organizations: Availability & Growth (Stockpile critical inputs, Secure local sourcing, Enable circularity, Certify inputs, Co-invest in supply, Form innovation partnerships), Productivity & Affordability (Streamline specifications, Adopt digital tools, Hedge price risk, Enable new supply), Sustainability (Leverage circular inputs, Shape green demand). Three numbered examples noted: (1) Environmental/social/governance credential verification, (2) Investments accelerating R&D for circularity technology, (3) Partnerships across value chain propelling innovation scale-up
Three-column table with strategic themes and opportunities, plus numbered examples
Two-part page: (1) Grid of related McKinsey publications with thumbnail images and titles: Global Energy Perspective, Materials 'green' premia trends, How to capture next S-curve in commodity trading, Materials Circularity, How Apple is helping increase circular materials, Green-steel hubs, Toward security in battery raw materials, The capex crystal ball, Mining for operational excellence, plus note to 'Stay tuned for latest insights', (2) Authors listed (Michel Van Hoey, Karel Eloot, Marcelo Azevedo, Gustav Hedengren, Michel Foucart) and extensive contributor acknowledgments (~40 names)
Left side: 3x3 grid of publication thumbnails with titles, Right side: Author and contributor text block
Standard McKinsey copyright notice and disclaimer stating report contains confidential and proprietary information intended for internal use only, not to be reproduced without consent. Includes disclaimer that nothing is investment advice, material based on believed-reliable information but not guaranteed accurate/complete, McKinsey accepts no liability for losses from use of content
Dark background (navy/black), white McKinsey logo at top, white text in paragraphs below, standard legal disclaimer format
Các câu hỏi phổ biến về slide này và nội dung trình bày cơ bản.
The report uses three supply scenarios based on project maturity: (1) Base-case includes all operating assets (corrected for depletion) plus projects under construction or with completed feasibility studies and secured financing, (2) High-case adds projects with completed prefeasibility studies (adjusted for likelihood of execution), and (3) Full pipeline includes all announced projects down to exploration stage. These scenarios are built from McKinsey's MineSpans database covering 14,000+ mining assets across 140+ countries. Most analysis in the report focuses on base-case and high-case scenarios.
The 2025 outlook is more modest due to: (1) Slower-than-expected growth in decarbonization efforts, particularly EV adoption in EU and US which flattened or slowed, (2) Shifts in battery chemistry reducing demand for certain materials, and (3) Economic headwinds. The projection for BEV share by 2035 decreased from 52-82% to 47-76%, and renewable energy share by 2050 decreased from 60-80% to 60-70%. However, demand remains robust overall, with energy transition materials still driving more than half of growth, and new demand vectors emerging from AI data centers and defense sectors.
Data center capacity is projected to expand 2.7 times from 82 GW in 2025 to 219 GW by 2030, driven by AI adoption. This expansion could significantly impact materials demand, with copper seeing the most dramatic effect - data centers could represent 3% of global copper demand by 2030 (up from 1% in 2024), adding approximately 1,075 kilotons of demand. The impact on steel and aluminum is smaller in percentage terms (<1% of global demand) despite similar growth rates. This represents a new structural demand driver beyond traditional energy transition applications.
The business case has weakened due to increased projections for electricity and hydrogen prices, pushing the break-even point for H2 DRI-EAF technology from 2037 (in 2022 projections) to beyond 2040 (in 2025 projections). As a result, approximately 40% of announced DRI capacity (14 Mt out of 32 Mt) and 33% of low-carbon steelmaking initiatives (21 Mt out of 63 Mt) in Europe have been put on hold or canceled as of mid-2025. This reflects mounting economic challenges despite continued policy commitments, with companies facing insufficient green premiums and higher input costs than previously anticipated.
Deep-sea mining involves extracting polymetallic nodules from the ocean floor, particularly in the Clarion-Clipperton Zone (CCZ) in the Pacific. These nodules contain significant reserves: CCZ holds an estimated 5,992 Mt of manganese (comparable to terrestrial reserves), 274 Mt of nickel (exceeding terrestrial 150 Mt), 226 Mt of copper (less than terrestrial 1,000 Mt), and 44 Mt of cobalt (exceeding terrestrial 13 Mt). However, significant challenges remain: (1) Processing technology at scale is unproven, (2) Global regulatory framework through the International Seabed Authority remains unclear, (3) Environmental impacts are uncertain with strong opposition from NGOs and some governments, (4) Converting manganese waste into valuable alloys has not yet succeeded in trials. While resource potential is vast, commercial viability and timeline remain highly uncertain.
Closing the gap by 2035 requires three critical inputs: (1) Investment: approximately $4.65 trillion in capital expenditures for mining exploration, sustaining capital, and project development - requiring roughly $260 billion per year, matching the highest investment levels seen during the 2011-13 peak, (2) Energy: ~270 GW of new power capacity to support increased production, plus an additional 1,100 GW if the industry aims to fully decarbonize its current power supply, and (3) People: ~350,000 new jobs needed, which is particularly challenging given mining and metallurgy graduates have declined by 75% in Australia and 40% in the US between 2011 and 2021.
Analysis of 224 metals and mining companies from 2001-2023 shows that 30 to 50 percent of TSR overperformance is driven by company operating decisions (changes in production, capital productivity, and cost position), rather than commodity price cycles or market momentum. The specific breakdown varies by sector: Steel shows 47% from operating decisions, Aluminum mid/downstream 30%, Copper 31%, Gold 47%, and Diversified players 28%. To achieve TSR outperformance, companies typically need to combine top-quartile production growth with an above-median position in cost efficiency and productivity - falling short on either dimension significantly reduces likelihood of excess TSR.
Mining productivity went through three distinct phases: (1) 'Volume at all costs' (2004-2010): steep 8% annual decline as massive investment and rising costs delivered limited production growth during the commodity supercycle, (2) 'Patching the wounds' (2010-2018): flat productivity as companies focused on incremental efficiency gains with declining prices, and (3) 'Rebound journey' (2018-present): 1% annual growth supported by accelerated adoption of automation and digital technologies. The rebound has been uneven geographically: Latin America leads at 3% annual growth driven by factor cost gains, North America remains flat (0%), Oceania shows modest growth (1%), while Sub-Saharan Africa declined (-2%). Key challenge: ore grade declines, labor shortages, and rising operational costs continue to pressure future productivity.

Create Your Own Slides
Turn your ideas into professional presentations in seconds with 2slides AI.
Tham khảo thiết kế chuyên nghiệp, chọn phong cách của bạn và tạo slide với kết xuất văn bản hoàn hảo. Được hỗ trợ bởi Nano Banana—bắt đầu tạo trình bày của bạn ngay bây giờ.
Đại Lý AI Của Bạn Cho Slide. Tiết kiệm thời gian, tỏa sáng nhanh hơn với việc tạo bài thuyết trình thông minh.




© 2026 2slides. Bảo lưu mọi quyền.