
Thuộc bộ sưu tập Ví dụ bài thuyết trình cho nhà đầu tư
Lite-On Technology (LITEON, 光寶科, TWSE: 2301) Q3 2026 earnings presentation, the English deck filed on Taiwan's Market Observation Post System (MOPS) for the investor conference (法說會) held on October 30, 2026. It reports record third-quarter results: sales of NT$57,403 million (New Taiwan dollars, NT$57.4 billion), up 28% YoY and 9% QoQ; gross margin of 25.9%; operating profit of NT$8,655 million, up 85% YoY at a 15.1% margin; and record net profit to parent of NT$7,429 million with EPS of NT$3.27, up 60% YoY. The Cloud & AIoT segment grew 57% to NT$33,753 million and now makes up 59% of sales, driven by AI server power, battery backup units and energy storage. The deck also covers 9M26 results (sales NT$153.5 billion, EPS NT$8.08), the balance sheet as of September 30, 2026, ROIC, a 2022-to-9M26 margin-expansion story, a NT$36 billion sustainability-linked syndicated loan, and a 4Q26 outlook in which AI revenue is expected to exceed 30% of 2026 sales.
Dùng trang bìa của bài trình bày này làm mẫu phong cách cho các slide tạo từ nội dung của bạn. Hoặc chọn bất kỳ trang nào bên dưới để lấy bố cục của trang đó làm tham chiếu.
Điều Hướng Nhanh
Thẻ
Chia sẻ slide
Lite-On Technology (LITEON, 光寶科, TWSE: 2301) Q3 2026 earnings presentation, the English deck filed on Taiwan's Market Observation Post System (MOPS) for the investor conference (法說會) held on October 30, 2026. It reports record third-quarter results: sales of NT$57,403 million (New Taiwan dollars, NT$57.4 billion), up 28% YoY and 9% QoQ; gross margin of 25.9%; operating profit of NT$8,655 million, up 85% YoY at a 15.1% margin; and record net profit to parent of NT$7,429 million with EPS of NT$3.27, up 60% YoY. The Cloud & AIoT segment grew 57% to NT$33,753 million and now makes up 59% of sales, driven by AI server power, battery backup units and energy storage. The deck also covers 9M26 results (sales NT$153.5 billion, EPS NT$8.08), the balance sheet as of September 30, 2026, ROIC, a 2022-to-9M26 margin-expansion story, a NT$36 billion sustainability-linked syndicated loan, and a 4Q26 outlook in which AI revenue is expected to exceed 30% of 2026 sales.
Xem chi tiết từng trang slide, bao gồm bố cục, nội dung chính và các phần tử trực quan.
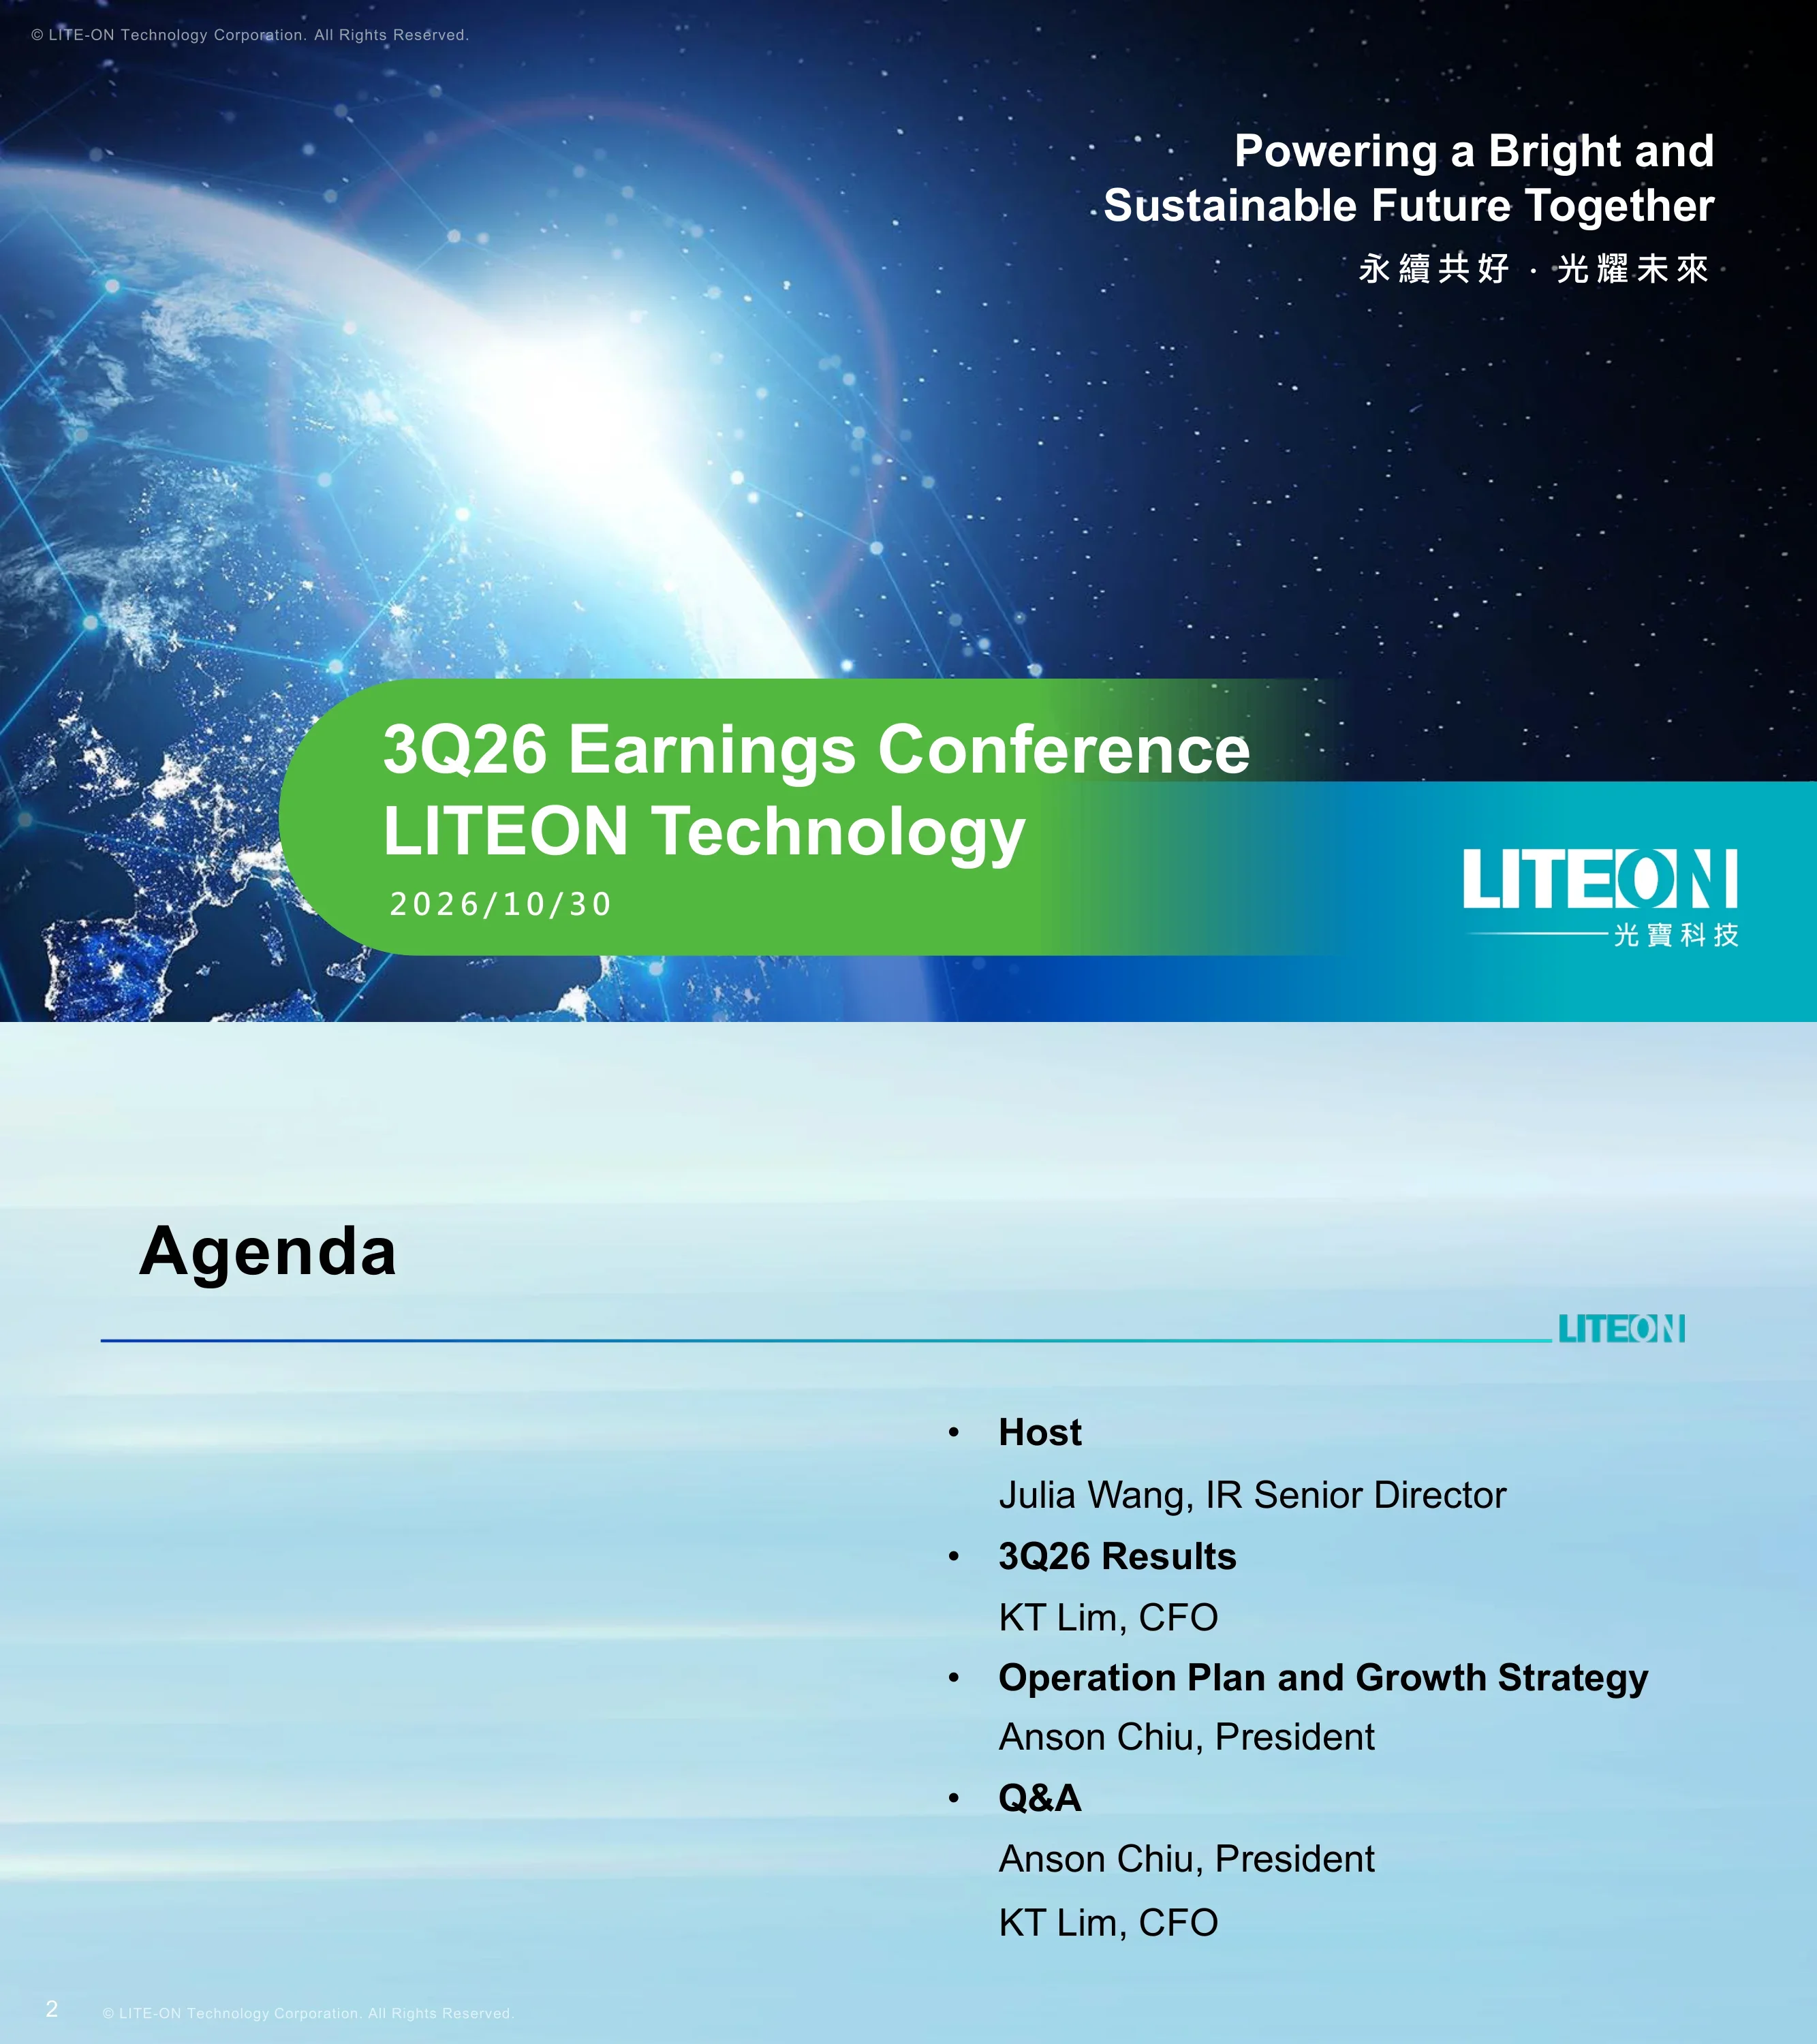
Cover slide for the 3Q26 earnings conference dated 2026/10/30, with the tagline 'Powering a Bright and Sustainable Future Together' and its Chinese version (永續共好・光耀未來).
Full-bleed image of Earth from space with a light flare; tagline at upper right; a rounded green-to-teal band across the lower half holds the title and date; LITEON logo with 光寶科技 at lower right.
Agenda with speakers: host Julia Wang (IR Senior Director); 3Q26 Results by KT Lim (CFO); Operation Plan and Growth Strategy by Anson Chiu (President); Q&A with Anson Chiu and KT Lim.
Large 'Agenda' title with a blue-to-teal rule and small logo; four bulleted sections with speaker names on the right half over a soft light-blue streaked background.
Forward-looking-statement disclaimer listing risks such as end-market demand, supply-chain disruption, geopolitics, raw material and energy costs and FX; notes the figures are prepared under IFRS (本資料係依據國際財務報導準則 IFRS 編制). Below, three ovals introduce the business groups: Opto-electronics (opto-semiconductors, automotive electronics, intelligent transportation, lighting), Cloud & AIoT (datacenter, server, networking, AIoT, smart devices, video intelligence) and Information Technology & Consumer Electronics (workstations, PC/gaming adaptors, LEO satellite power, edge computing/robotics power).
Title with gradient rule; three paragraphs of disclaimer text in the top half; a row of three colored ovals (yellow, teal, navy) with descriptive captions beneath; blue gradient footer with page number.
Section divider opening the financial results portion of the presentation.
Left three-quarters is a photo of a riverside city skyline with mountains (Taipei Neihu area) with the white section title; right quarter is a blue-teal gradient panel with the LITEON logo and a four-point star accent.
Four bar charts in NT$ million comparing Q3 2025, Q2 2026 and Q3 2026. Sales: 44,891 / 52,703 / 57,403 (+28% YoY). Gross profit: 11,243 / 14,348 / 14,867 (+32% YoY), gross margin 25.0% / 27.2% / 25.9%, with a callout that 1H26 margin was 24.7%. Operating profit: 4,683 / 8,203 / 8,655 (+85% YoY), operating margin 10.4% / 15.6% / 15.1%, versus 12.8% in 1H26. Net profit to parent: 4,645 / 7,116 / 7,429 (+60% YoY), EPS NT$2.05 / 3.14 / 3.27, labelled 'Record High'.
Dashboard: teal title bar with numbered tabs 1–4 and a QoQ/YoY toggle (YoY selected); 2×2 grid of rounded panels, each with a bar chart, a YoY percentage box, and margin or EPS values in labels with dots; gold callout boxes for highlights.
Year-to-date comparison of 9M25 vs 9M26 in NT$ million. Sales 121,728 → 153,514 (+26%). Gross profit 28,406 → 38,618 (+36%), gross margin 23.3% → 25.2%. Operating profit 12,085 → 20,957 (+73%), operating margin 9.9% → 13.7%. Net profit to parent 11,256 → 18,321 (+63%), EPS NT$4.94 → 8.08, marked 'Record High'.
Same dashboard template as page 5 with two bars per panel (2025 vs 2026), YoY boxes at top right of each panel and a gold 'Record High' callout on net profit.
Stacked revenue bars for Q3 2025 vs Q3 2026 (NT$ million): Cloud/AIoT 21,456 (48%) → 33,753 (59%); Opto-electronics 6,977 (16%) → 8,138 (14%); IT/CE 16,457 (36%) → 15,512 (27%). Net sales YoY +28%. Total operating profit 4,683 → 8,655, OP YoY +85%. (The slide title spells 'Segements'.)
Left panel: two stacked bars color-coded teal/orange/navy with value and share labels and an NSB YoY box. Right panel: segment tab selector (Cloud/AIoT, Opto-electronics, IT/CE), QoQ/YoY toggle, OP YoY box and an operating-profit bar chart.
Cloud/AIoT revenue rose from NT$21,456 million (48% of sales) in Q3 2025 to NT$33,753 million (59%) in Q3 2026, up 57% YoY. Segment operating profit grew from NT$3,329 million to NT$7,113 million, up 114% YoY.
Same segment template with the Cloud/AIoT tab highlighted; left panel two teal revenue bars with NSB YoY 57%; right panel operating-profit bars with OP YoY 114%.
Opto-electronics revenue rose from NT$6,977 million (16% of sales) to NT$8,138 million (14%), up 17% YoY. Segment operating profit grew from NT$606 million to NT$724 million, up 19% YoY.
Same segment template with the Opto-electronics tab highlighted; orange revenue bars on the left, blue operating-profit bars on the right with YoY boxes.
Information Technology & Consumer Electronics revenue declined from NT$16,457 million (36% of sales) to NT$15,512 million (27%), down 6% YoY. Segment operating profit eased from NT$1,685 million to NT$1,635 million, down 3% YoY.
Same segment template with the IT/CE tab highlighted; navy revenue bars on the left and operating-profit bars on the right, with negative YoY boxes.
Condensed balance sheet in NT$ million with QoQ comparisons: total assets 264,741 (vs 239,164, +11%) = liabilities 166,460 (vs 142,552, +17%) + equity 98,281 (vs 96,612, +2%). Current assets 203,065 (+7%), accounts receivable 52,484 (+4%), inventory 66,090 (+20%); current liabilities 159,339 (+16%), short-term loans 41,885 (+33%), accounts payable 74,739 (+11%). Financial indicators for Q3'25 / Q2'26 / Q3'26: quick ratio 1.14 / 0.94 / 0.82; current ratio 1.44 / 1.39 / 1.27; cash conversion cycle 47 / 64 / 73 days; AR days 82 / 81 / 83; inventory days 59 / 90 / 108. Note: capital is being deployed for growth via strategic procurement, strategic investments and capex.
Teal header with QoQ toggle; top row shows Assets = Liabilities + Equity as three large-number cards with '=' and '+' signs; below, two columns of smaller cards for asset and liability line items; right side has a blue-header 'Financial Indicator' table and a bold note.
Revenue (NT$ million) by year: 2021 164,828; 2022 173,456; 2023 148,333 (excludes image department business); 2024 137,134 (some consumer and OEM products discontinued); 2025 166,085; 9M26 153,514 (+26% YoY). Gross margin rose from 18.5% (2021) to 19.2%, 22.0%, 21.6%, 22.9% and 25.2% (9M26); operating margin from 7.9% to 8.7%, 9.8%, 9.4%, 10.1% and 13.7% (9M26, +73% YoY operating profit). Product-mix donuts: 9M26 revenue NT$154B with Cloud & AIoT 56% (NT$86B), Opto-electronics 15%, IT/CE 29%; 9M22 revenue NT$130B with Cloud & AIoT 33% (NT$43B), Opto-electronics 20%, IT/CE 47%.
Left two-thirds: combo chart with grey revenue columns and two line series (GP% and OP%) on a secondary axis, with teal and grey YoY callout tags and footnotes. Right third: two donut charts (9M26 above 9M22) with green callout boxes for Cloud & AIoT revenue and a shared legend.
Return on invested capital of 49% in 2024, 48% in 2025 and 34% for 9M26 (annualized), against a six-year average of 43%. Commentary attributes ROIC to a rising mix of high-growth, high-value AI-infrastructure products and says working-capital management, efficiency gains and disciplined capital deployment will continue to drive capital efficiency. Footnote defines ROIC as operating profit after tax divided by average (net working capital + net PP&E + right-of-use assets + intangible assets).
Left: green-bordered panel with three green bars, a dashed six-year-average line, and a dashed outline above the 9M26 bar marked '*Annualized'. Right: white card with a navy drop shadow holding two bullets with blue emphasized phrases. Footnote below.
3Q26: sales NT$57.4 billion, +28% YoY and +9% QoQ, with Cloud & AIoT up nearly 60%; gross profit NT$14.9 billion (+32%), gross margin 25.9% (+0.9 ppt); operating profit NT$8.7 billion (+85%), operating margin 15.1% (+4.7 ppt), credited to AI data center demand, high-value business, scale from global capacity expansion and smart manufacturing; net profit NT$7.4 billion and EPS NT$3.27 (+60%), a quarterly record. 9M26: sales NT$153.5 billion (+26%), gross profit +36%, gross margin 25.2% (+1.9 ppt), operating profit +73%, operating margin 13.7% (+3.8 ppt), net profit NT$18.3 billion, EPS NT$8.08 (+64%), a record. Core businesses: cloud-related business up 80% on AI server power management and energy storage shipments; high-end opto-semiconductor applications expanding into cloud computing, industrial automation and renewable energy; LEO satellite power supplies doubled YoY. Financing: first NT$36 billion sustainability-linked syndicated loan secured to fund global AI expansion and strategic investments.
Text-heavy slide with a navy title and gradient rule; four bracketed section headers (【3Q26】, 【9M26】, 【Core businesses】, 【Sustainability-Linked Loan to Accelerate AI Expansion】) each followed by blue-bulleted sentences; gradient footer.
Section divider introducing the President's operation plan and growth strategy section.
Reuses the skyline-and-river photo divider from page 4 with the new white title text and the blue-teal logo panel on the right.
Growth strategy: expand Grid-to-Rack AI infrastructure capabilities through strategic investments and M&A in power, thermal, system-level racks and high-speed optical communication, having showcased an 800VDC Power Rack, 2.6MW CDU and DC/DC Power Brick at OCP; spin off Advanced Mechanical Infrastructure to accelerate the liquid-cooling business; strategic investment in Yinchuan Xinanrui Electric for high-power transformer and inductor technology for AI data center power. 4Q26 outlook: core businesses expected to grow both YoY and QoQ, and AI revenue is expected to exceed 30% of 2026 revenue, helped by mass production of 8.5kW PSU and BBU for ASIC platforms and the next-generation VR 110kW and Helios 42-inch power shelves, sample shipments of the 800VDC Power Rack in 4Q26, and LEO satellite power solutions more than doubling yearly.
Two stacked white cards, each anchored by a large white numeral (1, 2) in a navy square on the left and a navy bracket accent on the right; blue subheadings with bullet lists; bold emphasis on the AI revenue target.
Product roadmap moving from in-rack components to full power racks across 1H26, 2H26 and 2027 onward: 33kW power shelf with 5.5kW PSU; 8.5kW PSU & BBU; VR 110kW power shelf with 18.3kW PSU; Helios 42-inch power shelf; 800VDC >1.5MW power rack; 800VDC 880kW power rack; and a 2.5kW DC/DC brick (50 VDC input, 12 VDC output). Marked 'Confidential 機密'.
Timeline chart with an x-axis (1H26, 2H26, 2027~) and a rising teal swoosh; dark rounded product cards with yellow or green text are placed along the curve next to 3D product renders; an 'In-rack → Power Rack' arrow runs across the top.
Closing slide repeating the corporate tagline with the LITEON logo; marked 'Confidential 機密'.
Earth-from-space image on the left three-quarters with the logo on a horizontal light line and the tagline at lower right; blue gradient panel on the right with a star accent and a large white logo.
Các câu hỏi phổ biến về slide này và nội dung trình bày cơ bản.
For 3Q26, Lite-On reported sales of NT$57.4 billion (New Taiwan dollars), up 28% YoY and 9% QoQ. Gross margin was 25.9%, operating profit was NT$8.7 billion (up 85% YoY, 15.1% margin), and net profit to parent was a record NT$7.4 billion, or EPS of NT$3.27, up 60% YoY.
This is the English presentation Lite-On (光寶科, TWSE: 2301) filed on Taiwan's Market Observation Post System (MOPS) for its 3Q26 investor conference (法說會) on October 30, 2026. Taiwanese issuers usually file a Chinese version on MOPS as well, and many of this deck's chart labels are already bilingual.
Cloud & AIoT. Its Q3 revenue rose 57% YoY to NT$33,753 million, now 59% of sales, and its operating profit more than doubled (+114%) to NT$7,113 million. Opto-electronics grew 17%, while IT/CE revenue fell 6%.
The company expects its core businesses to grow both year over year and quarter over quarter, and AI revenue to exceed 30% of full-year 2026 revenue. Drivers include mass production of 8.5kW PSU and BBU units, VR 110kW and Helios 42-inch power shelves, sample shipments of an 800VDC power rack and LEO satellite power supplies more than doubling.
Gross margin rose from 18.5% in 2021 to 25.2% in 9M26, and operating margin from 7.9% to 13.7%. Over the same period, Cloud & AIoT grew from 33% of nine-month revenue (NT$43B) in 9M22 to 56% (NT$86B) in 9M26.
Yes. The page offers the original PDF and an editable PPTX converted from it. The PPTX is a machine conversion, so check chart and text placement before you reuse the layouts.
Useful layouts include the 2×2 quarterly results dashboard with YoY boxes, the repeated segment-results slide with a tab selector, the balance sheet drawn as Assets = Liabilities + Equity cards, the revenue-plus-margin combo chart with product-mix donuts, and the product roadmap timeline.
Original English investor conference (法說會) file for Lite-On Technology (2301), October 30, 2026

Create Your Own Slides
Turn your ideas into professional presentations in seconds with 2slides AI.
Tham khảo thiết kế chuyên nghiệp, chọn phong cách của bạn và tạo slide với kết xuất văn bản hoàn hảo. Được hỗ trợ bởi Nano Banana—bắt đầu tạo trình bày của bạn ngay bây giờ.
Đại Lý AI Của Bạn Cho Slide. Tiết kiệm thời gian, tỏa sáng nhanh hơn với việc tạo bài thuyết trình thông minh.


© 2026 2slides. Bảo lưu mọi quyền.