
Thuộc bộ sưu tập Ví dụ bài thuyết trình cho nhà đầu tư · Mẫu thuyết trình nhà đầu tư Úc
Light & Wonder Q3 2026 Earnings Presentation: the 45-slide third-quarter 2026 results deck from Light & Wonder (L&W), the global slot machine, social casino and iGaming content company, presented on November 4, 2026 (U.S.) / November 5, 2026 (Australia) and lodged with the ASX, where L&W has held its sole primary listing since 2025. All figures are in US dollars and the quarter covers July to September 2026. It reports revenue of $824M (-2% YoY), net income of $133M (+17%), Consolidated AEBITDA of $383M (+2%), Adjusted NPATA of $163M (+7%), EPSa of $2.12 (+17%), Adjusted free cash flow of $181M (+21%), $156M of debt paid down and net debt leverage of 3.3x, alongside segment detail for Gaming, SciPlay and iGaming, the Grover charitable gaming integration, the hardware and content roadmap, FY26 modeling parameters and FY28 targets of >US$10.55 EPSa and $2.0B Consolidated AEBITDA.
Dùng trang bìa của bài trình bày này làm mẫu phong cách cho các slide tạo từ nội dung của bạn. Hoặc chọn bất kỳ trang nào bên dưới để lấy bố cục của trang đó làm tham chiếu.
Điều Hướng Nhanh
Thẻ
Chia sẻ slide
Light & Wonder Q3 2026 Earnings Presentation: the 45-slide third-quarter 2026 results deck from Light & Wonder (L&W), the global slot machine, social casino and iGaming content company, presented on November 4, 2026 (U.S.) / November 5, 2026 (Australia) and lodged with the ASX, where L&W has held its sole primary listing since 2025. All figures are in US dollars and the quarter covers July to September 2026. It reports revenue of $824M (-2% YoY), net income of $133M (+17%), Consolidated AEBITDA of $383M (+2%), Adjusted NPATA of $163M (+7%), EPSa of $2.12 (+17%), Adjusted free cash flow of $181M (+21%), $156M of debt paid down and net debt leverage of 3.3x, alongside segment detail for Gaming, SciPlay and iGaming, the Grover charitable gaming integration, the hardware and content roadmap, FY26 modeling parameters and FY28 targets of >US$10.55 EPSa and $2.0B Consolidated AEBITDA.
Xem chi tiết từng trang slide, bao gồm bố cục, nội dung chính và các phần tử trực quan.
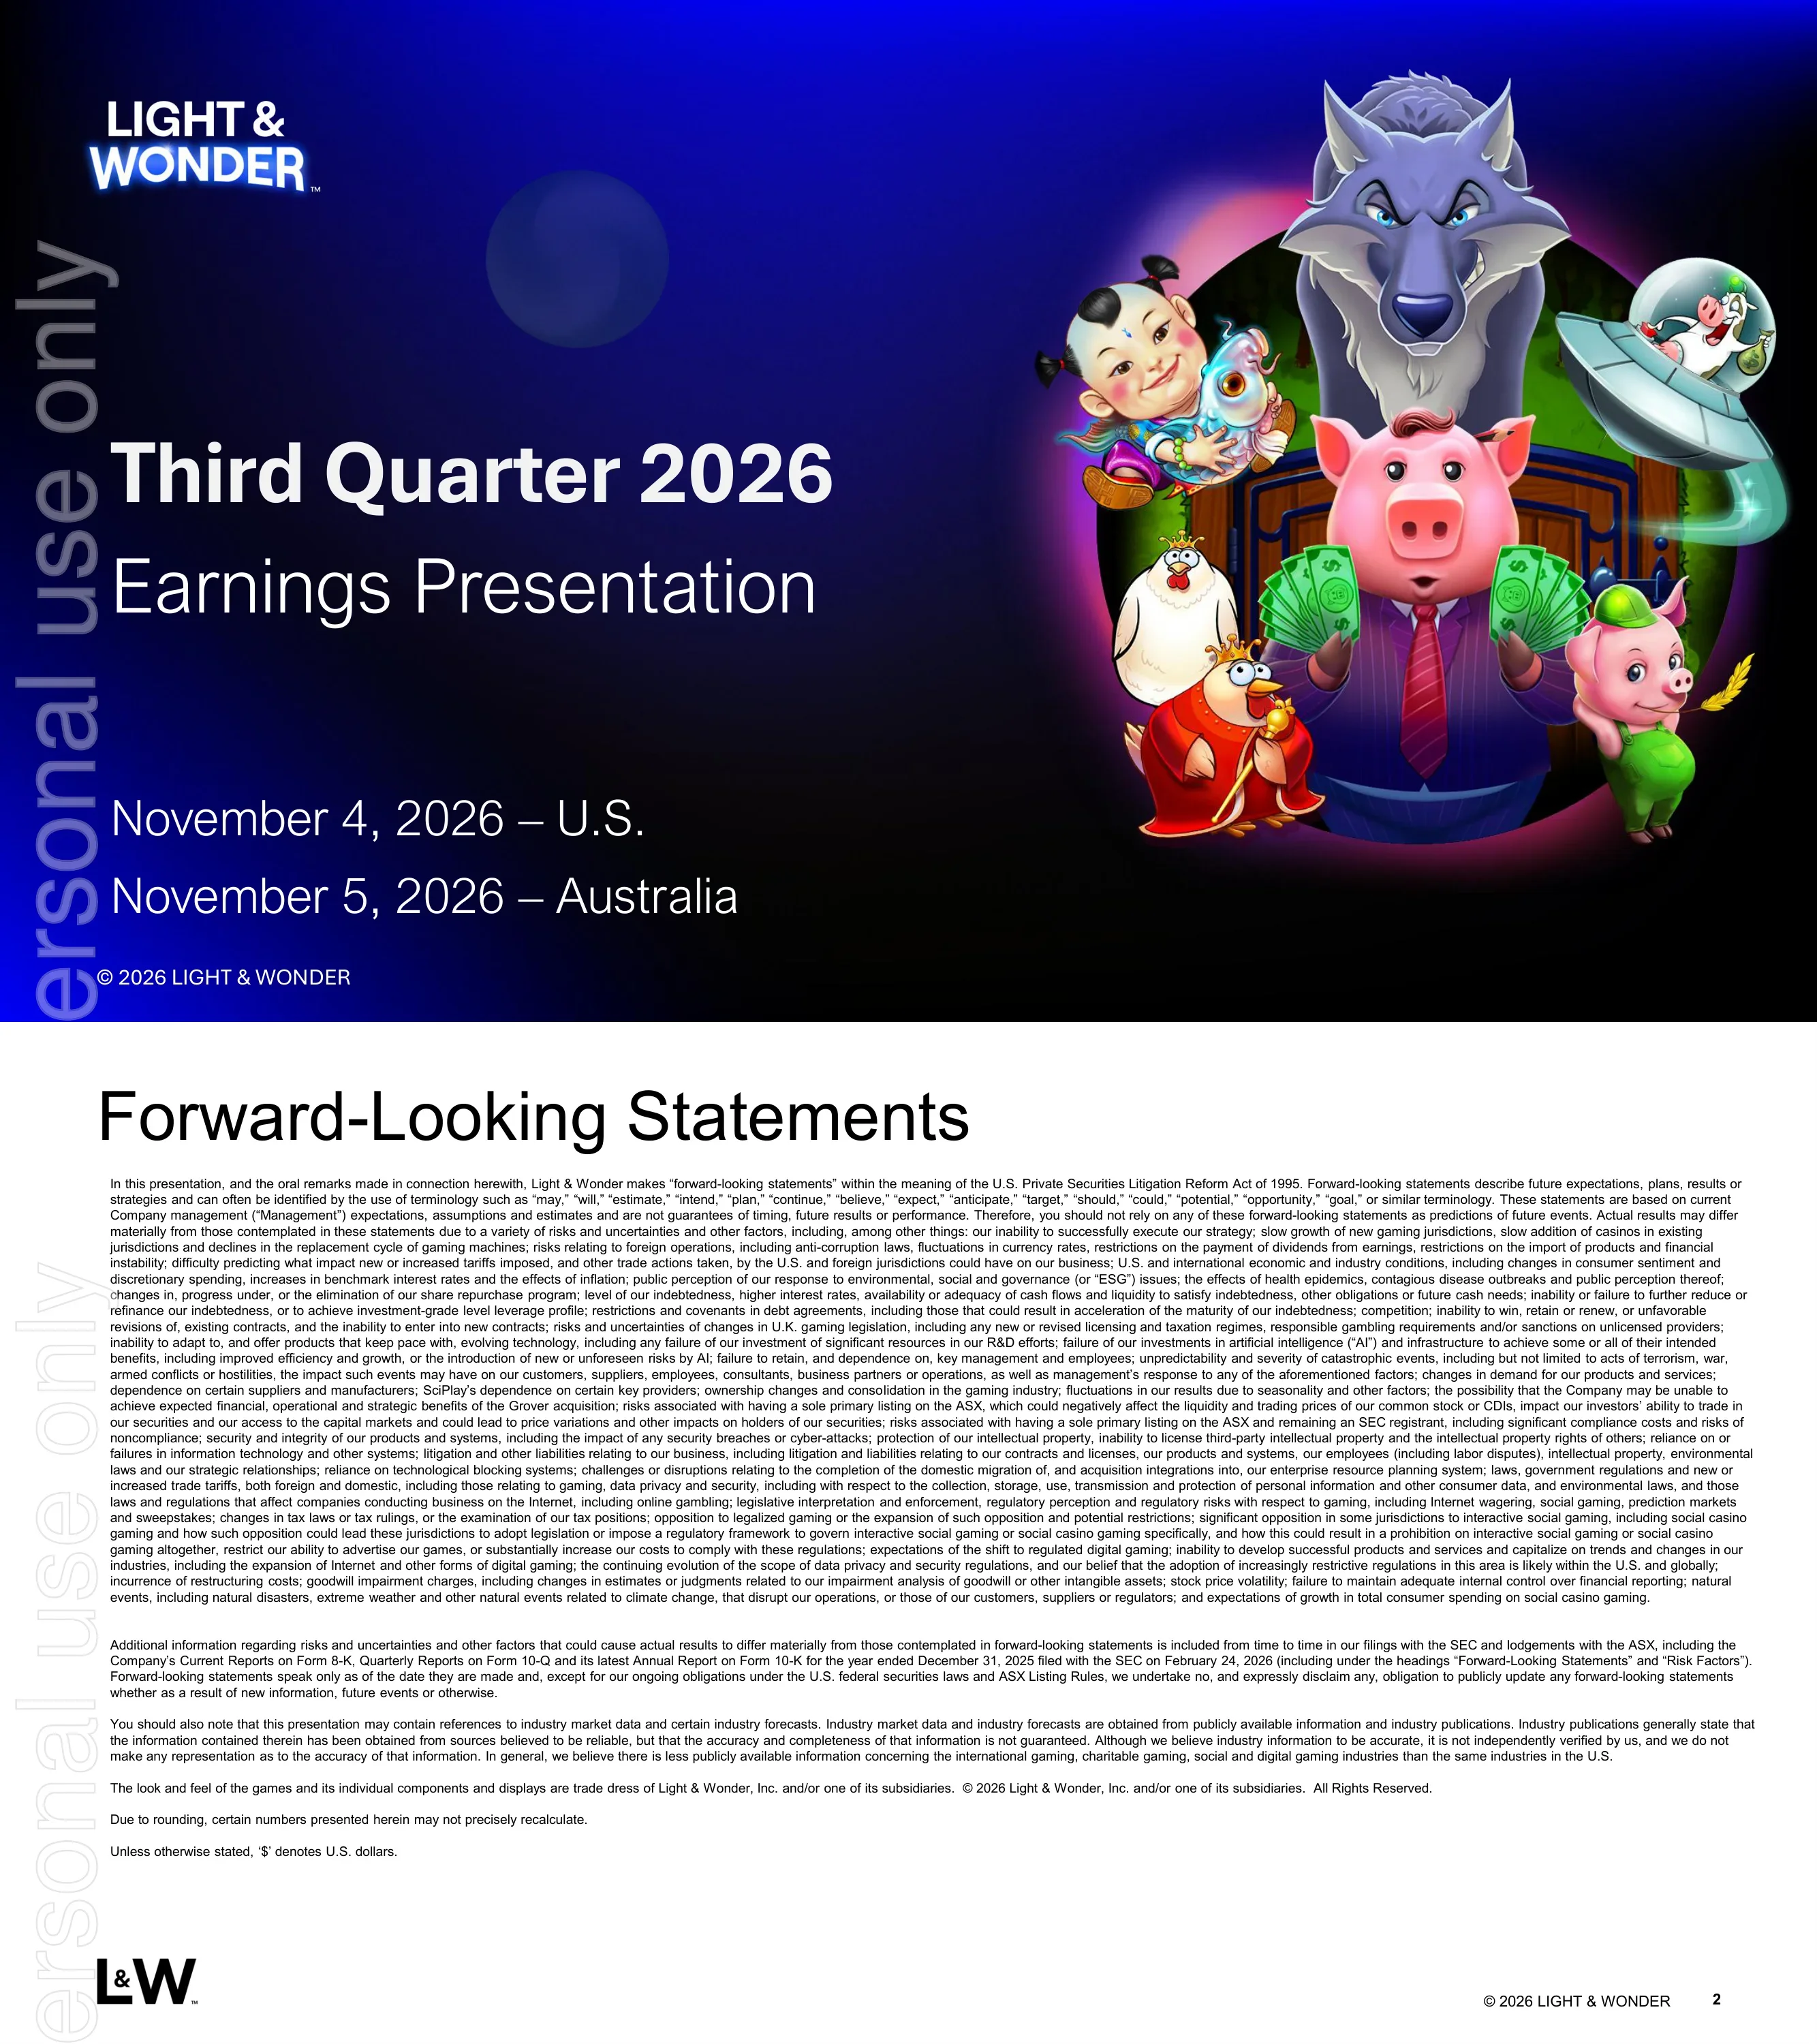
Cover slide for Light & Wonder's Third Quarter 2026 Earnings Presentation, dated November 4, 2026 for the U.S. and November 5, 2026 for Australia.
Full-bleed dark blue-violet background with the Light & Wonder logo top left, large white title and dates on the left, and a circular character-art illustration on the right.
Legal disclaimer covering forward-looking statements under the U.S. Private Securities Litigation Reform Act of 1995, listing risks such as strategy execution, tariffs, indebtedness, U.K. gaming legislation, AI and the single primary listing on the ASX; it notes that '$' denotes U.S. dollars and that numbers may not recalculate due to rounding.
White text-only slide with a large title and a dense block of small-print paragraphs across the full width.
Scorecard of Q3 2026 delivery against three strategic goals: net income $133M (+17%), Consolidated AEBITDA $383M (+2%), Adjusted NPATA $163M (+7%), EPSa $2.12 (+17%) and adjusted free cash flow $181M (+21%); $156M of debt paid down, Fitch outlook upgraded to Positive and net debt leverage of 3.3x (3.4x in 2Q26) toward <3.0x in 1H27; iGaming revenue $97M (+13%), N.A. premium net unit adds +2,657 YoY (+571 in Q3), Grover net adds +1,487 YoY (+205 in Q3) and an N.A. installed base of 49,750 units.
Three-row grid: a left label column (expand margins and cash generation; improve net debt leverage; scale recurring revenue) and KPI tiles to the right, with the final tile in each row highlighted in blue, violet or magenta.
Consolidated revenue grew from $3,188M (2024) to $3,314M (2025) with recurring revenue rising from 64% to 67% of the total, and 71% (~$1.7B) in 9M FY26; adjusted free cash flow rose from $318M (26% conversion) in 2024 to $545M (38%) in 2025, with $545M YTD AFCF and 50% conversion in 9M FY26.
Two side-by-side stacked bar charts (revenue and AFCF), each with a 9M FY26 callout box below, and a full-width light-violet takeaway banner at the bottom.
Section divider introducing the segment results and highlights portion of the presentation.
Dark full-bleed section divider with large bold white title on the left and a circular game-art illustration on the right.
Gaming revenue was $554M (-1% YoY vs $558M) and AEBITDA $312M (+2% vs $305M); 9M26 revenue $1,619M (+2%) and AEBITDA $889M (+6%). By line of business, Gaming operations $248M (+3%), Gaming machine sales $199M (+5%), Gaming systems $55M (-24%, lower hardware sales) and Table products $52M (-7%, lower utility sales).
Three panels: revenue bar chart, AEBITDA bar chart and a Gaming Highlights bullet panel on the right, with a line-of-business revenue table under the two charts.
U.S. and Canadian installed base reached 49,750 units (+5% YoY, ~2,470 units, including Grover) with average daily revenue per unit of $47.98 (+2%) and a 25th consecutive quarter of premium installed-base growth (+571 units sequentially); international installed base fell 7% to 18,103 units while revenue per unit rose 11% to $18.03. Global new unit shipments were 8,906 (+3%), with N.A. casino opening and expansion units up 74% to 941, and global ASP rose 5% to $20,599 on COSMIC DUAL and LIGHTWAVE cabinet launches.
Left: two stacked KPI tables (Gaming Operations and Gaming Machine Sales) with Q3 and 9M columns; right: Gaming KPI Highlights bullet panel.
Grover charitable gaming ended 3Q26 with 12,776 installed units, up from 11,289 in 3Q25 (+1,487 units) and +205 sequentially; revenue growth contributed +$73M in 9M26 vs 9M25 (reflecting a partial prior-year period after the May 16, 2025 acquisition), L&W content and selective hardware rollouts continue, and Grover targets entry into Maryland in 2H27.
Left panel with a U.S. map of operating jurisdictions and a five-quarter install-base bar chart with a rising arrow; right panels for Grover Highlights and Integration Update.
SciPlay revenue fell 12% to $173M (21% of group revenue) on social casino market softness and AEBITDA fell 6% to $67M, while AEBITDA margin expanded 3 points to 39%; average MAU 4.6M (-12%), DAU 1.8M (-10%), ARPDAU $1.03 (-5%), MPU 426K (-17%), AMRPPU $132.80 (+5%), payer conversion 9.3%, and direct-to-consumer revenue $53M (+33%), now 31% of SciPlay revenue.
Revenue and AEBITDA bar charts at top left, SciPlay KPI table beneath, and a SciPlay Highlights bullet panel with a lime-green accent on the right.
iGaming revenue rose 13% to $97M (12% of group revenue) and AEBITDA rose 9% to $37M (38% margin); 9M26 revenue $280M (+15%) and AEBITDA $103M (+16%). Wagers processed through the OpenGaming System hit a record $31.7B (+13%), first-party titles held 8 of the top 10 OGS games led by PIROTS, HUFF N' PUFF and ULTIMATE FIRE LINK, and L&W ranked #1 in U.S. casino slots market share per Eilers.
Revenue and AEBITDA bar charts with green growth markers, a single-row iGaming KPI table for OGS wagers, and an iGaming Highlights panel on the right.
Regional iGaming update: in North America, ELK launched its first multi-state digital-native game exclusively with FanDuel (HUFF N' PUFF COLLECTR), L&W expects first Florida PMR games in late 4Q26 and Alberta is ramping after its July opening; internationally, all Brazil content was disabled after the government's online gambling ban and the April U.K. tax increase remains a headwind.
Left: two grids of game-title thumbnails for U.S./Canada and Europe/U.K. 4Q releases with flag icons; right: iGaming Regional Update bullet panel.
Section divider introducing the group financials section.
Dark full-bleed divider with bold white section title and circular character illustration on the right.
Group income statement and non-GAAP walk: revenue $824M (-2%) vs $841M, operating income $242M (+6%), net income $133M (+17%), Adjusted NPAT $138M (+10%), Adjusted NPATA $163M (+7%), Normalized EBITA $285M, Normalized EBITDA $359M, Consolidated AEBITDA $383M (+2%), diluted EPS $1.72 (+28%) and EPSa $2.12 (+17%); 9M26 revenue $2,440M (+1%), net income $305M (+5%) and EPSa $5.56 (+18%).
Wide financial table with Q3 and 9M columns on the left two-thirds and a 3Q26 Performance Highlights bullet panel on the right.
Waterfall bridges: Consolidated AEBITDA moved from $375M to $383M (+$8M) on Gaming +$7M, iGaming +$3M and corporate and other +$2M, offset by SciPlay -$4M; Adjusted NPATA moved from $153M to $163M with AEBITDA +$8M, D&A -$1M, SBC +$4M, interest expense +$4M and income tax -$5M, supporting EPSa of $2.12 (+17%).
Two stacked waterfall charts on the left with matching driver-commentary panels on the right and a blue EPSa takeaway banner at the bottom.
Year-to-date bridges: Consolidated AEBITDA rose from $1,038M to $1,093M (+$55M) on Gaming +$50M and iGaming +$14M, offset by SciPlay -$5M and corporate and other -$4M; Adjusted NPATA rose from $406M to $435M with AEBITDA +$55M, D&A -$15M, SBC -$1M, interest expense -$14M (higher debt from the Grover acquisition) and income tax +$4M, giving 9M26 EPSa of $5.56 (+18%).
Mirror of the QTD bridge slide: two waterfall charts with commentary panels and an EPSa banner.
Operating cash flow was $236M (+28%) and free cash flow $181M after $90M capex; adjusted free cash flow was $181M vs $149M (+21%), giving AFCF conversion of 47% of Consolidated AEBITDA and 111% of Adjusted NPATA; for 9M26, AFCF was $545M (50% and 125% conversion) and net income conversion 202%.
Two stacked cash flow tables (cash flow build and conversion ratios) on the left and a Highlights bullet panel on the right.
Principal face value of debt outstanding is $5.0B with net debt leverage of 3.3x, average tenor of ~3.6 years, an effective interest cost of 6.36%, a 55%/45% fixed-to-floating mix (including $700M of swaps) and $1.1B of available liquidity; L&W plans to prioritize deleveraging through Q4 2026 and into FY27 toward an investment-grade leverage profile, and a maturity chart shows debt from 2026 to 2034 with the largest tranche in 2029.
Highlights panel across the top with two bullet columns, and a maturity schedule stacked bar chart below with a legend for Term Loan B, Notes, Term Loan A and Revolver.
Three capital allocation pillars: disciplined investment (R&D plus capex at ~17% of revenue, ~18% in 3Q26 and YTD, in content studios, Grover and AI); optimizing capital structure (net debt leverage to 3.0x by end CY26 and below 3.0x in 1H27, $156M debt repaid, Fitch outlook Positive, $30M of on-market CDI purchases held in trust); and capital return (deleveraging prioritized over buybacks, $180M of buyback capacity remaining, $2.1B returned since 2022, ~27% of shares).
Three equal vertical cards in green, blue and violet, each with a pictogram strip on the left and a heading with bullets on the right.
Section divider introducing the outlook section.
Dark full-bleed divider with bold white title and circular illustration of game characters in front of a temple gate.
Segment guidance: Gaming >500 N.A. premium net adds per quarter and FY26 systems revenue down mid-teens %; Grover 100-150 net adds per quarter excluding Indiana; SciPlay revenue growth below a -6% to -7% category forecast with continued DTC expansion; iGaming moderating growth in 2H26 due to U.K. tax increases. 9M actuals include 1,880 YTD premium net adds, Grover YTD net adds 1,142, SciPlay revenue -10% and iGaming +15%. Modeling parameters: reinvestment ~17% of revenue, effective tax rate 22-24%, effective interest cost 6-7%, amortization of acquired intangibles $130M-$140M and quarterly corporate costs in the mid-to-high $30M range.
Four color-coded segment columns (Gaming, Grover, SciPlay, iGaming) with outlook bullets, a matching 9M year-to-date performance row beneath, and a five-cell modeling parameters strip at the bottom.
L&W expects FY26 Consolidated AEBITDA growth toward the lower end of its previously announced mid-to-high single-digit range, with Adjusted NPATA growing faster than AEBITDA and EPSa faster than Adjusted NPATA; it remains committed to leverage below 3.0x in 1H27 and to FY28 targets of >US$10.55 per share EPSa and $2.0B Consolidated AEBITDA.
Single outlined text box with three main bullets and two sub-bullets on a white background, leaving whitespace below.
Section divider introducing the appendix with supplementary industry, strategy and reconciliation slides.
Dark full-bleed divider with bold title and circular illustration on the right.
U.S. gross gaming revenue (per H2 Gambling Capital) from 2003 to 2025 shows a 4.7% CAGR, with dips highlighted for the 2008 Global Financial Crisis and the 2020 COVID-19 pandemic, and the message that U.S. GGR keeps growing despite geopolitical and macro uncertainty.
Single full-width column chart with a trend arrow and annotation callouts, plus a light-violet takeaway banner.
Five strategic advantages: an end-to-end solutions provider to casino operators (land-based and digital), well-established game franchises across an omni-channel strategy, talent built to outperform, proprietary data and AI tools that amplify game development and operations, and a disciplined capital allocation strategy that self-funds organic and inorganic growth, debt paydown and buybacks.
Full-width red banner card on top, three colored cards (blue, violet, green) in the middle row and a full-width dark card at the bottom, each with an icon block.
Combined R&D and capex were $470M in FY23 (16% of revenue), $555M in FY24 (17%), $562M in FY25 (17%) and $430M in 9M26 (18%), with 3Q26 spend of $146M or 18% of revenue.
Stacked column chart of R&D and capex with a red percentage-of-revenue line, a dashed 3Q26 callout box and a takeaway banner.
Quarterly R&D plus capex from 1Q23 to 3Q26 ranged from $107M to $153M, or 16%-19% of consolidated revenue per quarter and about 17% on average, with 3Q26 at $146M (18%).
Fifteen-quarter stacked column chart with a zig-zag red percentage line and a takeaway banner.
Shares of common stock outstanding fell from 96.6M in 2021 to 76.3M in 3Q26; since the program began in March 2022, L&W has returned ~$2.1B, repurchased ~26M shares and reduced shares outstanding by ~27%.
Left stat column with three large figures separated by dashed lines; right column chart of shares outstanding; bottom takeaway banner.
Net debt leverage fell from 10.5x (2020) and 6.2x (2021) to 3.3x after the divestiture of sports betting and lottery, then 3.1x (2023), 3.0x (2024), 3.5x (2025), 3.4x (1H26) and 3.3x (3Q26), with a target below 3.0x in 1H27; $2.1B of buybacks equals a ~1.4x illustrative gross turns impact, and L&W generated $725M of adjusted free cash flow in the last 12 months.
Column chart of leverage ratio by period with annotation arrows and a bracket for buybacks, a dashed target bar, and two stacked blue banners at the bottom.
Summary table of revenue, AEBITDA and AEBITDA margin by segment: Gaming $554M revenue, $312M AEBITDA, 56% margin; SciPlay $173M, $67M, 39%; iGaming $97M, $37M, 38%; with 9M26 figures of $1,619M, $541M and $280M revenue and margins of 55%, 38% and 37%.
Single full-width table divided into revenue, AEBITDA and margin sections with Q3 and 9M column groups.
North America gaming operations installed base grew from 31,220 units (2023) to 49,750 (3Q26), with premium units rising from 14,733 to 21,400, Grover at 12,776 and revenue per day at $48.02 YTD; L&W added 4,787 net premium units from 2023 to 2025 and 1,111 total units QoQ, with ~8% total and ~15% premium installed-base CAGRs and a target of more than 500 premium adds per quarter.
Stacked column chart (premium, non-premium, Grover) with a green revenue-per-day line on the left, a four-stat panel on the right and a takeaway banner below.
Americas hardware and content roadmap through 1H27 pairing cabinets (COSMIC SKY, LIGHTWAVE, L7 new top box, COSMIC DUAL and PROFILE, LIGHTWAVE SOLAR, COSMIC HALO, COSMIC LIBRARY) with launch periods and game families such as Willy Wonka, Frankenstein, Dracula, Kong, Gremlins and The Mummy.
Two side-by-side roadmap tables, each with a column of cabinet photos, a release/launch-period column and a grid of game logos.
Asia and ANZ roadmap through 1H27: COSMIC DUAL launching in Asia from 4Q26 and in ANZ from 2Q26, and LIGHTWAVE SOLAR in Asia in 2Q27, with themes such as Jin Chan, Lock It Link, Ultimate Fire Link, Rolling Drums, Big Steam, Wolves, Phoenix Forever and Bride of Frankenstein.
Two regional roadmap tables (Asia and ANZ) with dark header bars, cabinet photos and grids of game logos.
At G2E, 38% of respondents named L&W most impressive on game mechanics (vs 11% in 2025 and 19% in 2024), ranking it #1, and L&W was #2 most improved among scale players; Eilers & Krejcik rankings show a 32.1% share of top new core games, ULTIMATE FIRE LINK BLAZING DRAGON - SHANGHAI as top new premium leased and WAP game at 2.86x, Blazing 777 as top low-denomination mechanical reel at 1.52x, and #1 U.S. iGaming slots GGR share.
Left G2E Feedback panel with a three-year bar chart and big-number callouts; right Game Performance Rankings list of six rank rows with game logos.
Definitions and rationale for the non-GAAP measures used, including Adjusted NPAT, Adjusted NPATA, EPSa, Normalized EBITA/EBITDA, Consolidated AEBITDA, Combined measures including Grover and free cash flow, noting that ASX-style measures were introduced after the move to a sole primary listing on the ASX.
Two-column dense text slide with small blue subheadings.
Continued definitions for Adjusted NPATA per share (EPSa), Normalized EBITA and Normalized EBITDA, Consolidated AEBITDA and Grover Adjusted EBITDA, including the adjustments applied in each reconciliation.
Two-column dense text slide with blue subheadings.
Further definitions for AEBITDA from discontinued operations, Combined AEBITDA, Consolidated AEBITDA margin, free cash flow and adjusted free cash flow, EBITDA from equity investments, net debt, net debt leverage ratio and illustrative gross turns equivalent impact.
Two-column dense text slide with blue subheadings.
Reconciles net income to Adjusted NPAT, Adjusted NPATA, Normalized EBITA, Normalized EBITDA and Consolidated AEBITDA for 3Q26 ($133M to $383M), 9M26 ($305M to $1,093M) and full years 2025 ($276M to $1,443M) and 2024 ($336M to $1,244M); FY25 Adjusted NPATA was $567M vs $480M in FY24.
Single financial reconciliation table with six numeric columns grouped by three months, nine months and full year.
Walks diluted net income per share to Adjusted NPATA per share: 3Q26 $1.72 to $2.12 (3Q25 $1.34 to $1.81) and 9M26 $3.90 to $5.56 (9M25 $3.39 to $4.73), mainly via $0.42 of amortization of acquired intangibles in the quarter.
Compact four-column per-share reconciliation table on a white slide.
Twelve-month reconciliations from 2020 through September 30, 2026 show Consolidated AEBITDA rising from $374M (2020) to $1,443M (2025), $1,490M (LTM June 2026) and $1,498M (LTM September 2026); Combined AEBITDA was $800M (2020) and $1,331M (2021) including discontinued operations, and $1,489M for 2025 including $46M of Grover Adjusted EBITDA.
Dense multi-period table with eight twelve-month columns and three stacked reconciliation blocks.
Shows principal face value of debt, cash and net debt by period: net debt of $8,391M (2020), $3,025M (2022), $5,040M (2025), $5,024M (June 2026) and $4,880M (September 2026), giving net debt leverage of 10.5x, 3.3x, 3.5x, 3.4x and 3.3x, with a combined ratio of 3.4x for 2025.
Wide eight-column table with shaded leverage-ratio rows at the bottom.
As of June 30, 2026, net debt of $5,024M less $2,080M of share repurchases since 2022 gives illustrative net debt of $2,944M, so leverage would be 2.0x instead of 3.4x, an illustrative 1.4x gross turns impact.
Single narrow reconciliation column centered on the slide with shaded result rows.
Cash flow reconciliation: 3Q26 operating cash flow $236M to free cash flow and AFCF of $181M; 9M26 $616M to FCF $393M and AFCF $545M; FY25 $794M to AFCF $545M; FY24 AFCF $318M; and LTM September 2026 AFCF of $725M, a 48% conversion of $1,498M Consolidated AEBITDA.
Seven-column table with shaded free cash flow and adjusted free cash flow rows and a conversion ratio line.
Bridges adjusted free cash flow to Adjusted NPATA (3Q26 $181M to $163M; 9M26 $545M to $435M) and shows conversion ratios: net income conversion 177% and 202%, AFCF/AEBITDA 47% and 50%, and AFCF/Adjusted NPATA 111% and 125%.
Four-column reconciliation table followed by three ratio rows.
Net income margin was 16% in 3Q26 (14% in 3Q25) and 13% in 9M26 (12%), and Consolidated AEBITDA margin was 46% (45%) and 45% (43%).
Compact four-column table with revenue, net income and AEBITDA inputs and two margin rows.
For 2020 and 2021, earnings from equity investments are reconciled to EBITDA from equity investments for continuing ($7M and $8M) and discontinued operations ($30M and $80M), giving combined EBITDA from equity investments of $37M and $88M.
Four-column table split by year and by continuing versus discontinued operations.
Các câu hỏi phổ biến về slide này và nội dung trình bày cơ bản.
It is L&W's 45-slide third-quarter 2026 results deck. It covers headline financials (revenue $824M, Consolidated AEBITDA $383M, EPSa $2.12), results for the Gaming, SciPlay and iGaming segments, the Grover charitable gaming integration, cash flow and deleveraging, capital allocation, FY26 guidance and modeling parameters, product roadmaps and a full non-GAAP reconciliation appendix.
Light & Wonder lodged the presentation with the ASX, where it has had its sole primary listing since 2025 (ticker LNW), and it also files reports with the SEC. That is why the dates read 'November 4, 2026 – U.S.' and 'November 5, 2026 – Australia', why the pages carry an ASX 'For personal use only' watermark, and why it uses ASX-style metrics such as Adjusted NPATA and EPSa.
Unlike most ASX companies, Light & Wonder reports in US dollars and on a calendar financial year, not the July-June Australian year. Q3 2026 covers July to September 2026, 9M26 covers January to September 2026, and FY26 is the year ending December 31, 2026. Every '$' figure in the deck is US dollars.
Adjusted NPATA is net profit after tax adjusted for restructuring and other items and before amortization of acquired intangibles. EPSa is Adjusted NPATA per diluted share. L&W introduced these measures after moving to the ASX, and slides 37-38 reconcile them to GAAP net income. EPSa was $2.12 for Q3 2026 and $5.56 for the nine months.
L&W expects FY26 Consolidated AEBITDA growth toward the lower end of its mid-to-high single-digit range, with Adjusted NPATA and EPSa growing faster. It targets net debt leverage below 3.0x in 1H27 (3.3x at Q3) and keeps its FY28 targets of more than US$10.55 EPSa and $2.0B Consolidated AEBITDA.
Yes. Its structure works well as a reference: KPI highlight grid, segment slides with charts, tables and commentary, waterfall bridges, a cash flow and leverage section, a four-column outlook slide and an appendix of reconciliations. Swap in your own figures and branding; the game artwork and trademarks belong to Light & Wonder and its licensors.
This gallery entry provides the original PDF of the presentation along with page-by-page images and the slide-by-slide analysis on this page. You can use it to study the layouts or rebuild similar slides in PowerPoint, Google Slides or Keynote.
It is most useful for investors and analysts following Light & Wonder and the gaming equipment, social casino and iGaming sectors, for IR and finance teams preparing quarterly results decks, and for students learning how companies present segment results, non-GAAP measures and deleveraging plans.

Create Your Own Slides
Turn your ideas into professional presentations in seconds with 2slides AI.
Tham khảo thiết kế chuyên nghiệp, chọn phong cách của bạn và tạo slide với kết xuất văn bản hoàn hảo. Được hỗ trợ bởi Nano Banana—bắt đầu tạo trình bày của bạn ngay bây giờ.
Đại Lý AI Của Bạn Cho Slide. Tiết kiệm thời gian, tỏa sáng nhanh hơn với việc tạo bài thuyết trình thông minh.


© 2026 2slides. Bảo lưu mọi quyền.