
Thuộc bộ sưu tập Mẫu thuyết trình tư vấn
KPMG Pulse of Private Equity Q3'26 (published October 2026): KPMG Private Enterprise's quarterly analysis of global private equity deals, exits and fundraising across the Americas, US, EMA and ASPAC, based on PitchBook data as of 30 September 2026.
Dùng trang bìa của bài trình bày này làm mẫu phong cách cho các slide tạo từ nội dung của bạn. Hoặc chọn bất kỳ trang nào bên dưới để lấy bố cục của trang đó làm tham chiếu.
Điều Hướng Nhanh
Thẻ
Chia sẻ slide
KPMG Pulse of Private Equity Q3'26 (published October 2026): KPMG Private Enterprise's quarterly analysis of global private equity deals, exits and fundraising across the Americas, US, EMA and ASPAC, based on PitchBook data as of 30 September 2026.
Xem chi tiết từng trang slide, bao gồm bố cục, nội dung chính và các phần tử trực quan.
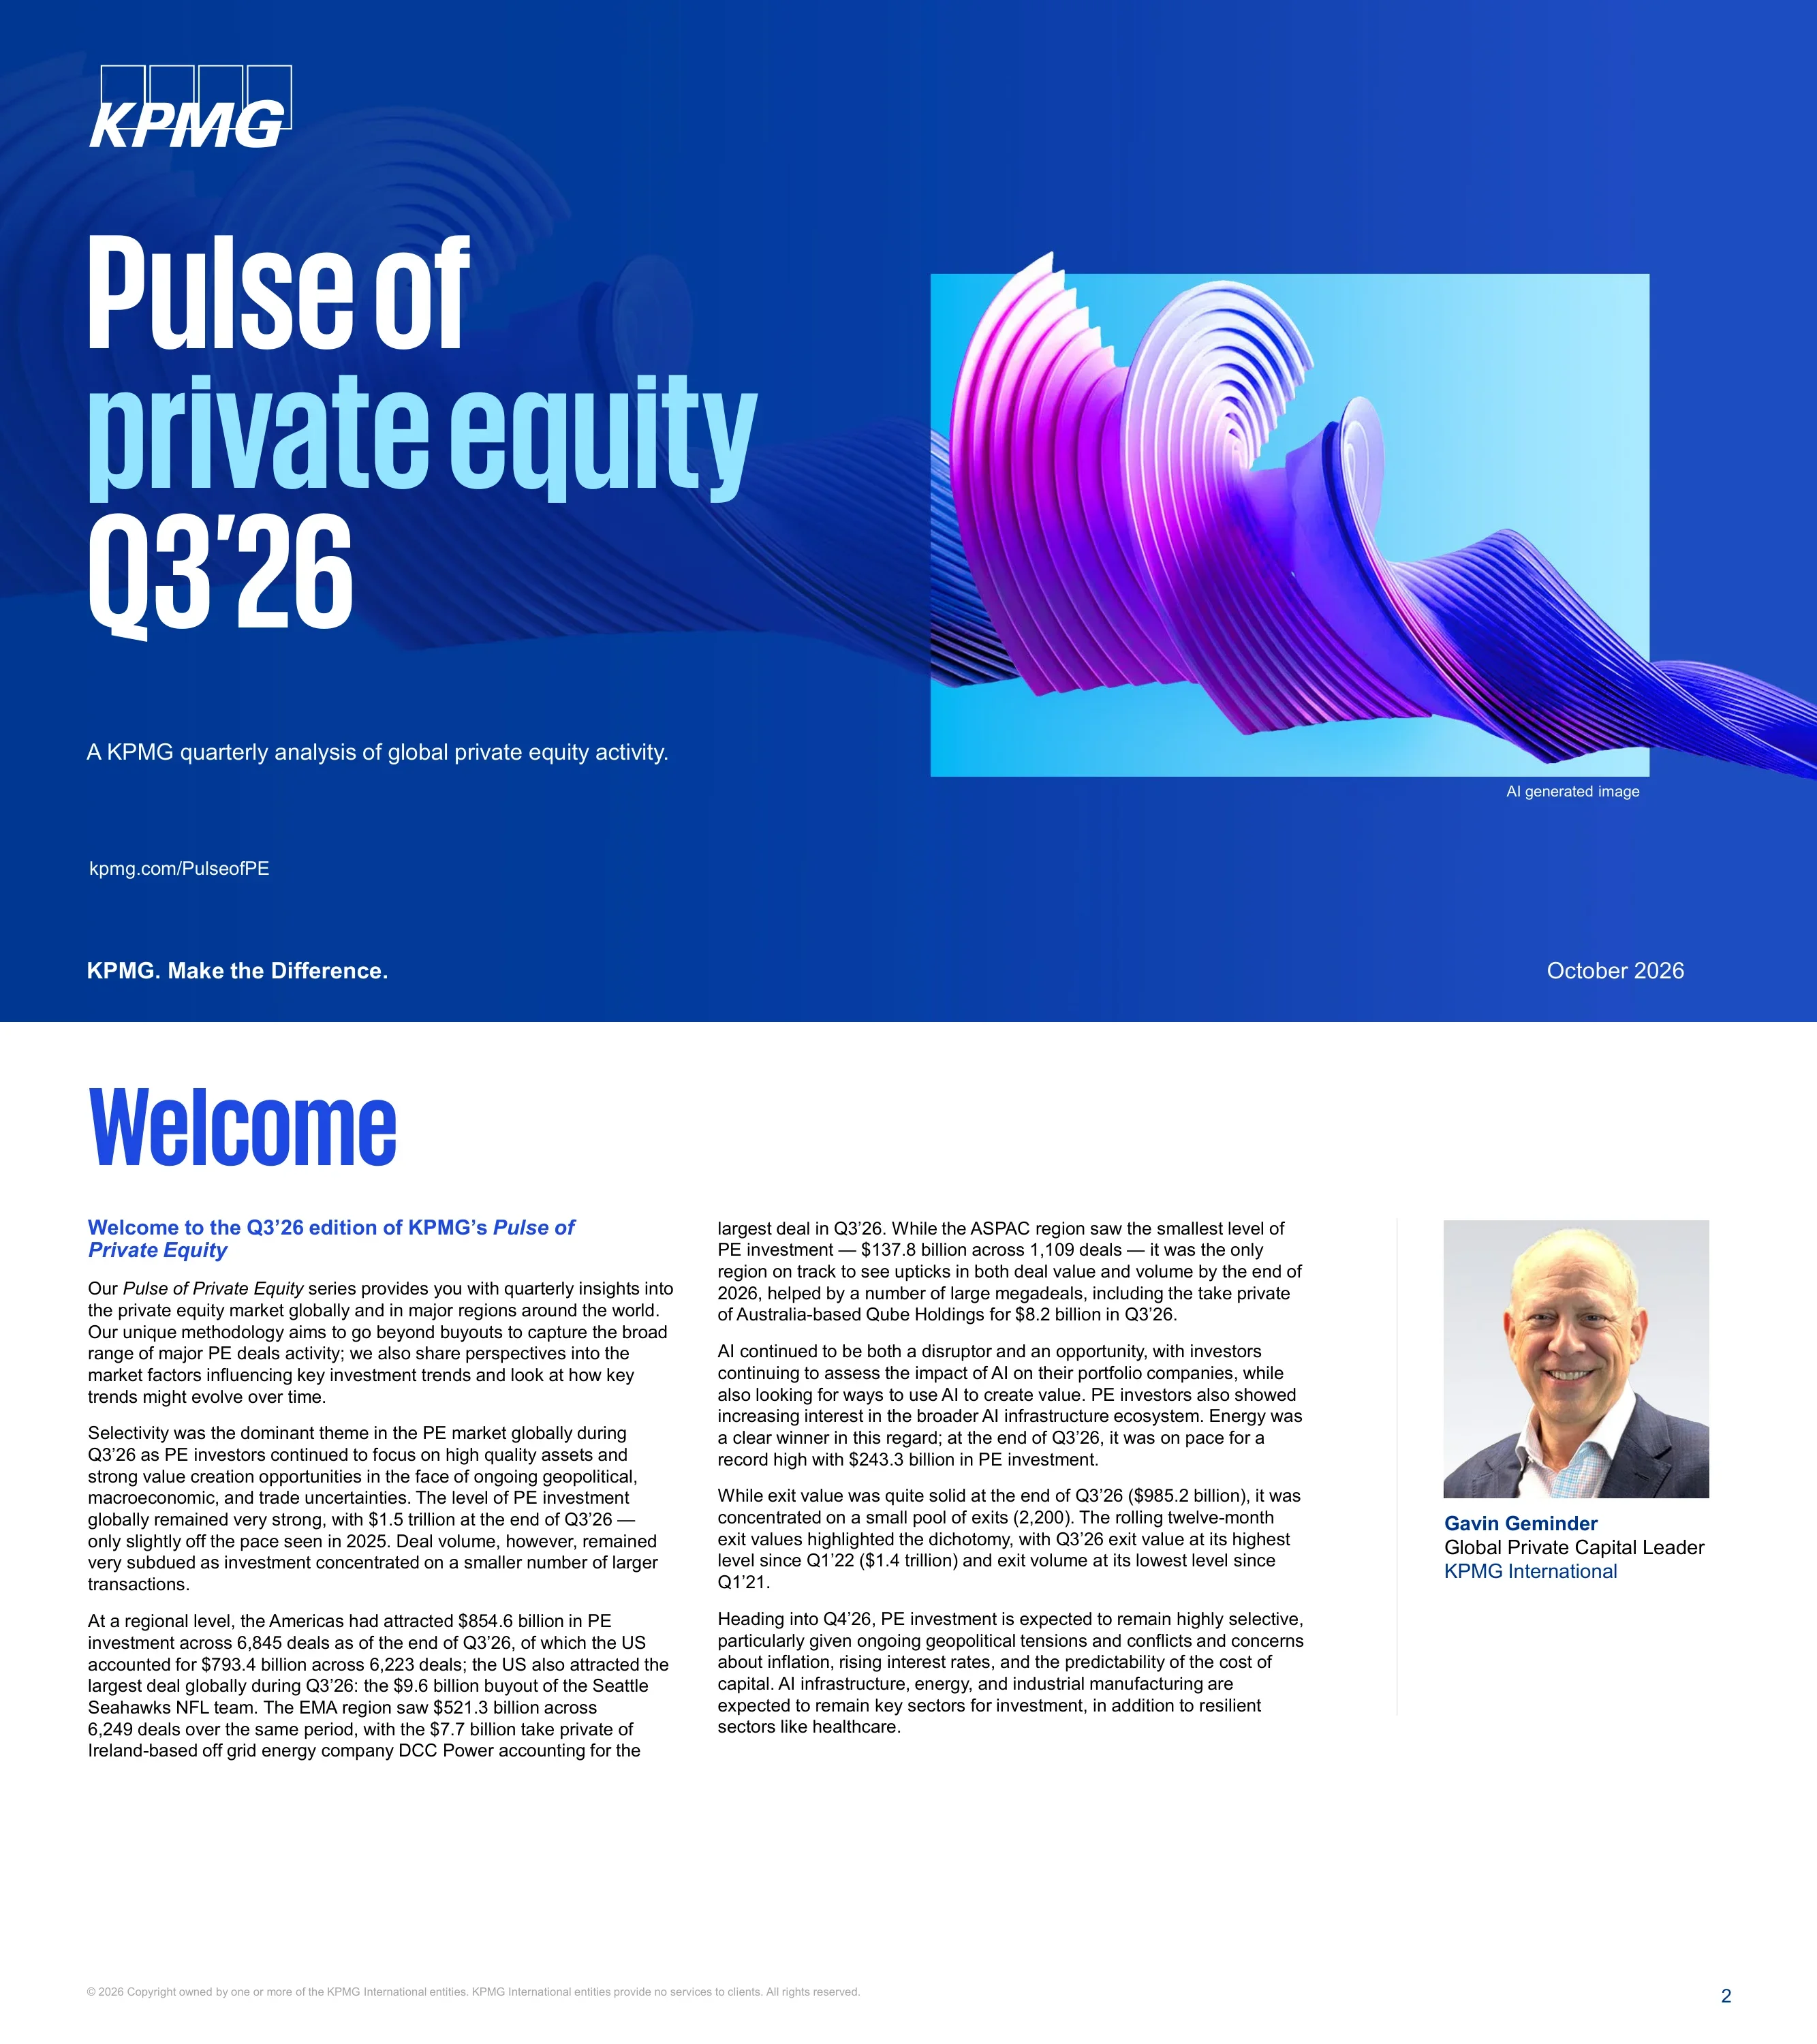
Cover of KPMG's quarterly analysis of global private equity activity, dated October 2026, with the kpmg.com/PulseofPE link.
Royal-blue cover with the KPMG logo, a three-line condensed title (white and light-blue type) and an AI-generated 3D ribbon image on the right
Gavin Geminder's introduction: selectivity dominated Q3'26, with $1.5T invested YTD, the Americas at $854.6B (US $793.4B), EMA $521.3B, ASPAC $137.8B, exit value $985.2B across only 2,200 exits, and energy on pace for a record $243.3B.
Two text columns with a headshot, name and title in a right-hand sidebar
Lists four themes: continued selectivity across deals, exits and fundraising; the AI ecosystem; energy investment; and industrial manufacturing, with a note that all figures are PitchBook data as of 30 September 2026.
Wide blue gradient banner with four numbered circular markers (01 to 04) and short theme statements, methodology note below
Contents page linking About the authors (p5), Spotlight (p6), Global (p10), Americas (p31), US (p46), EMA (p59), ASPAC (p76), KPMG firms' PE practice (p91) and About the report (p92).
Tile grid of photo cards with large page numbers and purple section labels, plus solid colour tiles
Profiles of the four lead authors: Gavin Geminder (Global Private Capital Leader), Donald Zambarano (Americas), Tilman Ost (Global Private Capital Advisory / EMA) and Andrew Thompson (Asia Pacific, Singapore).
Four equal columns separated by blue rules, each with a headshot, name, title and short bio
Section opener for the carve-out spotlight feature.
Full-bleed photo of business people walking on steps with a blue left-side overlay and large white condensed title
Global carve-out value reached $182.2B across 1,254 deals by end-Q3'26, on track for the second-strongest year after 2021; LTM value $247.7B (from $249.6B in Q2), with the Americas at $125.5B LTM and EMA $92.7B across 883 deals.
Three-column editorial text layout under a large condensed blue headline, with blue subheads and footnotes
ASPAC set an LTM carve-out record of $23.4B (up from $20.5B) across 131 deals, and energy reached a record $56.6B in carve-out value across 144 deals; quote from Javier Rodriguez Gonzalez on corporates divesting healthy businesses.
Two text columns plus a solid blue pull-quote panel on the right with an executive headshot, name and title
Automotive carve-outs hit a five-year high of $8.3B (40 deals) partly driven by defense repurposing; carve-outs expected to keep growing with AI as a value-creation lever; quote from Paul Pan on 'mini-carve-outs' used to return DPI.
Two text columns plus a solid blue pull-quote panel on the right with an executive headshot, name and title
Section divider: global PE-announced four-quarter sums were $2.2T across 20,362 transactions in Q3'26.
Full-bleed city/architecture photo with blue gradient overlay on the left, large numbered section tab, oversized condensed headline stating the region's four-quarter deal total, and pill navigation bar top-right
Global PE investment reached $1.5T YTD, on pace for the third-best year after 2021 and 2025, while 14,650 deals is the slowest pace since 2020; LTM value $2.2T (from $2.4T) and LTM volume 20,362, the lowest since Q1'21; ASPAC on track for its best year since 2021.
Three-column editorial text layout under a large condensed blue headline, with blue subheads and footnotes
Energy and natural resources hit $243.3B, near a record; industrial manufacturing reached $122.6B against its 2021 record of $163.3B; exit value was $985.2B across just 2,200 exits, with LTM exits at $1.4T but only 3,295 exits, the lowest since Q1'21; Gavin Geminder quote on energy.
Two text columns plus a solid blue pull-quote panel on the right with an executive headshot, name and title
Expects highly selective investment focused on AI-relevant sectors (infrastructure, energy, industrial tech, healthcare), take-privates and carve-outs, soft concentrated fundraising, and exits needing sell-side valuation resets.
Rounded outline call-out box with trend-arrow icon headed 'Trends to watch for in Q4'26'
Global PE deal value by year: $1,352.0B (2020), $2,536.6B (2021), $2,058.5B, $1,559.5B, $1,847.9B, $2,311.5B (2025) and $1,551.0B YTD 2026 plus $662.2B LTM; add-on value $461.4B YTD plus $187.0B LTM versus $704.2B in 2025.
Two side-by-side combo charts: annual bars for deal value with a stacked darker segment for the LTM value, line for deal count and a dot for LTM count, under an action-title headline
Quarterly LTM global deal value peaked at $2,547.3B in Q1'22, rebuilt to $2,404.3B in Q1'26 and slipped to $2,213.2B in Q3'26 as deal count fell to about 20,000.
Single full-width quarterly bar chart (Q1 2020 to Q3 2026, 27 bars with rotated value labels inside) with a deal-count line on a secondary axis, under an action-title headline
Global PE deal forecasts for 2026 by quarter, comparing actual deal value with optimistic, midline and pessimistic scenarios (Q4 only has scenario bars), with a note on the re-specified forecasting model.
Clustered column chart with four bars per quarter and three scenario lines plus actual deal-count markers; long methodology note below
Global median buyout size reached $101.7M and PE growth $21.2M in 2026 YTD; average buyout size reached $725.5M versus $139.8M for growth deals.
Two side-by-side line charts with end-point value labels, each line representing a deal or exit type, under an action-title headline
Sector mix of global PE deal count and value 2020 to 2026 YTD; TMT remains the largest slice at roughly a third of both count and value.
Two side-by-side 100% stacked column charts (count on the left, value on the right) for 2020 to 2026 YTD, with a shared colour legend under an action-title headline
Add-ons account for roughly 35 to 43% of global buyout counts but around two-thirds or more of buyout value each year from 2020 to 2026 YTD.
Two side-by-side 100% stacked column charts (count on the left, value on the right) for 2020 to 2026 YTD, with a shared colour legend under an action-title headline
Quarterly LTM global carve-out/divestiture value: peak $293.8B in Q2'21, trough $155.8B in Q3'23, and $247.7B in Q3'26 (from $250.0B in Q2'26) with roughly 1,750 deals.
Single full-width quarterly bar chart (Q1 2020 to Q3 2026, 27 bars with rotated value labels inside) with a deal-count line on a secondary axis, under an action-title headline
Quarterly carve-out value and count by region, showing Americas value around $125 to $135B, EMA near $90B with the highest deal count (about 900), and APAC rising to about $23B.
Clustered quarterly column chart for three regions with three deal-count lines on a secondary axis
Global PE contributions vs distributions 2020 to 2025 show roughly flat net cash flow, and the capital overhang chart shows $5B+ and $1B to $5B funds holding most dry powder (data as of 31 December 2025).
Left: diverging bar chart of contributions (negative) and distributions with a net-cash-flow line; right: 100% stacked columns by fund size
Global exit mix by type: acquisitions are about 47% of exit count in 2026 YTD, while public listings take roughly a third of exit value, up from about a quarter in 2025.
Two side-by-side 100% stacked column charts (count on the left, value on the right) for 2020 to 2026 YTD, with a shared colour legend under an action-title headline
Quarterly LTM global exit value rose to $1,418.5B in Q3'26, the highest since 2022, while exit count dropped to about 3,300.
Single full-width quarterly bar chart (Q1 2020 to Q3 2026, 27 bars with rotated value labels inside) with a deal-count line on a secondary axis, under an action-title headline
Global median exit sizes in 2026 YTD: public listings $771.4M, buyouts $344.8M, acquisitions $212.6M; averages $2,774.0M, $1,057.6M and $978.3M respectively.
Two side-by-side line charts with end-point value labels, each line representing a deal or exit type, under an action-title headline
Sector mix of global exit count and value; industrial manufacturing takes a markedly larger share of exit value in 2026 YTD (roughly a fifth).
Two side-by-side 100% stacked column charts (count on the left, value on the right) for 2020 to 2026 YTD, with a shared colour legend under an action-title headline
Global PE fundraising: $471.5B (2020), $663.3B, $574.5B, $670.7B (2023), $618.8B, $477.9B (2025) and $367.4B YTD 2026, with fund count falling from about 1,800 to roughly 500.
Single annual column chart with fund-count line on a secondary axis
Top 10 firms by AUM raised $50.7B YTD 2026 (vs $76.5B in 2025, peak $108.6B in 2021) while all other firms raised $316.7B (vs $401.4B).
Two side-by-side annual column charts with fund-count lines (top-10 firms vs all others)
Global PE company inventory rose to about 34,000 companies in 2026 with a growing share held 3 to 8+ years, and AUM (dry powder plus NAV) reached roughly $6.1T at end-2025.
Left: stacked columns of portfolio companies by holding period; right: stacked columns of dry powder and NAV
Largest deals: Seattle Seahawks $9.6B buyout, Qube Holdings $8.2B, Baldwin Insurance Group $7.7B, DCC Energy $7.7B, Aypa Power $7.0B, PANTHERx Rare $7.0B, ATG Entertainment $6.0B, Integer Holdings $5.7B, Steadfast Group $5.4B, Accelerant Holdings $5.2B.
Dark navy slide with a white map and numbered colour pins on the left and a boxed ranked list of the ten largest deals (name, size, city, deal type, sector) on the right
Section divider: Americas PE-announced four-quarter sums were $1.2T across 9,414 transactions in Q3'26.
Full-bleed city/architecture photo with blue gradient overlay on the left, large numbered section tab, oversized condensed headline stating the region's four-quarter deal total, and pill navigation bar top-right
Americas investment reached $854.6B across 6,845 deals; LTM fell from $1.4T to $1.2T; the US took $793.4B (6,223 deals), Canada $45.7B (424) and the rest $15.5B (198); quote from John Cho on Canada.
Two text columns plus a solid blue pull-quote panel on the right with an executive headshot, name and title
Canada's investment summit and $50B Maple Fund, a more active Latin American deal market, AI and power infrastructure interest in Mexico, cautious exits ($426B across 947 exits; LTM count 1,401, lowest since Q3'20), and fintech in Latin America.
Three-column editorial text layout under a large condensed blue headline, with blue subheads and footnotes
Expects strong but selective investment in AI, digital infrastructure, energy and healthcare, optimism for Canada, and fintech/infrastructure in Latin America; quote from Jean-Pierre Trouillot on PE exits to local strategics.
Rounded outline call-out box with trend-arrow icon headed 'Trends to watch for in Q4'26' with a blue pull-quote panel on the right
Americas deal value $854.6B YTD 2026 plus $354.5B LTM (2025: $1,322.4B; 2021 peak $1,472.5B); add-ons $252.2B YTD plus $103.6B LTM.
Two side-by-side combo charts: annual bars for deal value with a stacked darker segment for the LTM value, line for deal count and a dot for LTM count, under an action-title headline
Quarterly LTM Americas deal value peaked at $1,472.5B in Q4'21, recovered to $1,404.6B in Q1'26 and fell to $1,209.1B in Q3'26.
Single full-width quarterly bar chart (Q1 2020 to Q3 2026, 27 bars with rotated value labels inside) with a deal-count line on a secondary axis, under an action-title headline
Americas median buyout size $195.0M and PE growth $20.0M in 2026 YTD; average buyout $1,150.3M and growth $134.5M.
Two side-by-side line charts with end-point value labels, each line representing a deal or exit type, under an action-title headline
Americas sector mix of deal count and value; energy and natural resources' share of value expands sharply in 2026 YTD while TMT still leads.
Two side-by-side 100% stacked column charts (count on the left, value on the right) for 2020 to 2026 YTD, with a shared colour legend under an action-title headline
Quarterly LTM Americas exit value: peak $912.2B in Q3'21, $772.6B in Q4'25 and $665.7B in Q3'26 (from $622.0B), with exit count falling to about 1,400.
Single full-width quarterly bar chart (Q1 2020 to Q3 2026, 27 bars with rotated value labels inside) with a deal-count line on a secondary axis, under an action-title headline
Americas median exit sizes in 2026 YTD: listings $1,899.2M, buyouts $912.5M, acquisitions $412.5M; averages $2,547.8M, $1,708.1M and $1,195.9M (listings n<30).
Two side-by-side line charts with end-point value labels, each line representing a deal or exit type, under an action-title headline
Americas exit mix: acquisitions roughly 46% of count and close to half of value in 2026 YTD, with public listings around 17% of value.
Two side-by-side 100% stacked column charts (count on the left, value on the right) for 2020 to 2026 YTD, with a shared colour legend under an action-title headline
Americas sector mix of exits; industrial manufacturing's share of exit value jumps to roughly a quarter in 2026 YTD.
Two side-by-side 100% stacked column charts (count on the left, value on the right) for 2020 to 2026 YTD, with a shared colour legend under an action-title headline
Quarterly LTM Americas fundraising fell from $445.4B (Q3'23) to $304.9B in Q3'26, with fund count around 680.
Single full-width quarterly bar chart (Q1 2020 to Q3 2026, 27 bars with rotated value labels inside) with a fund-count line on a secondary axis, under an action-title headline
Americas fundraising by fund type: buyout funds are about 77% of count and nearly 90% of capital in 2026 YTD, with PE growth funds holding a larger count share.
Two side-by-side 100% stacked column charts (count on the left, value on the right) for 2020 to 2026 YTD, with a shared colour legend under an action-title headline
Seattle Seahawks $9.6B, Baldwin Insurance Group $7.7B, Aypa Power $7.0B, PANTHERx Rare $7.0B, Integer Holdings $5.7B, H&R REIT $4.8B, Crowe $3.0B, VTX Energy Partners $3.0B, CBIZ $3.0B and RWC Global $2.9B.
Dark navy slide with a white map and numbered colour pins on the left and a boxed ranked list of the ten largest deals (name, size, city, deal type, sector) on the right
Section divider: US PE-announced four-quarter sums were $1.1T across 8,535 transactions in Q3'26.
Full-bleed city/architecture photo with blue gradient overlay on the left, large numbered section tab, oversized condensed headline stating the region's four-quarter deal total, and pill navigation bar top-right
US investment reached $793.4B across 6,223 deals (LTM down from $1.3T to $1.1T); liquidity is the central challenge; AI drives physical infrastructure demand and energy investment hit $138.1B, an eight-year high; Donald Zambarano quote on adaptation.
Two text columns plus a solid blue pull-quote panel on the right with an executive headshot, name and title
US exit value $399.4B across 842 exits (LTM count 1,242, a six-year low); industrial manufacturing exits $106.05B; fundraising $221.4B across 350 funds, LTM $297.4B (22-quarter low), with $1B+ funds raising $185.1B.
Three-column editorial text layout under a large condensed blue headline, with blue subheads and footnotes, plus a trends-to-watch call-out box
US deal value $793.4B YTD 2026 plus $314.9B LTM (2025: $1,181.9B); add-ons $231.9B YTD plus $94.5B LTM.
Two side-by-side combo charts: annual bars for deal value with a stacked darker segment for the LTM value, line for deal count and a dot for LTM count, under an action-title headline
Quarterly LTM US deal value peaked at $1,377.6B (Q4'21), reached $1,297.2B in Q1'26 and fell to $1,108.3B in Q3'26.
Single full-width quarterly bar chart (Q1 2020 to Q3 2026, 27 bars with rotated value labels inside) with a deal-count line on a secondary axis, under an action-title headline
US median buyout size $220.0M (down from about $250M in 2025) and growth $17.7M; average buyout $1,244.2M and growth $130.2M.
Two side-by-side line charts with end-point value labels, each line representing a deal or exit type, under an action-title headline
US sector mix; energy and natural resources' share of deal value rises to roughly 18% in 2026 YTD.
Two side-by-side 100% stacked column charts (count on the left, value on the right) for 2020 to 2026 YTD, with a shared colour legend under an action-title headline
Quarterly LTM US exit value $626.1B in Q3'26 (from $580.6B; peak $859.3B in Q3'21), while exit count fell to about 1,240.
Single full-width quarterly bar chart (Q1 2020 to Q3 2026, 27 bars with rotated value labels inside) with a deal-count line on a secondary axis, under an action-title headline
US median exit sizes in 2026 YTD: listings $1,912.8M, buyouts $1,000.0M, acquisitions $470.0M; averages $2,652.3M, $1,856.0M and $1,333.5M.
Two side-by-side line charts with end-point value labels, each line representing a deal or exit type, under an action-title headline
US exit mix: buyouts (secondary sales) exceed acquisitions in 2026 YTD exit count, at roughly 53% vs 44%.
Two side-by-side 100% stacked column charts (count on the left, value on the right) for 2020 to 2026 YTD, with a shared colour legend under an action-title headline
US sector mix of exits; industrial manufacturing reaches roughly 27% of exit value in 2026 YTD.
Two side-by-side 100% stacked column charts (count on the left, value on the right) for 2020 to 2026 YTD, with a shared colour legend under an action-title headline
Quarterly LTM US fundraising fell from $437.3B (Q3'23) to $297.4B in Q3'26, with fund count around 670.
Single full-width quarterly bar chart (Q1 2020 to Q3 2026, 27 bars with rotated value labels inside) with a fund-count line on a secondary axis, under an action-title headline
US fundraising by fund type: buyout funds take about 89% of capital in 2026 YTD while PE growth funds hold about a fifth of fund count.
Two side-by-side 100% stacked column charts (count on the left, value on the right) for 2020 to 2026 YTD, with a shared colour legend under an action-title headline
Section divider: EMA PE-announced four-quarter sums were $764.4B across 8,805 transactions in Q3'26.
Full-bleed city/architecture photo with blue gradient overlay on the left, large numbered section tab, oversized condensed headline stating the region's four-quarter deal total, and pill navigation bar top-right
EMA investment $521.4B across 6,249 deals; LTM fell from $818.2B to $764.4B; UK investment $165B (LTM $234.2B, 1,510 deals), India $25.8B, Germany $58.1B across 615 deals; TMT $128.5B; Tilman Ost quote on value-creation-led deals.
Two text columns plus a solid blue pull-quote panel on the right with an executive headshot, name and title
Industrial manufacturing $56.7B, infrastructure and transport $47.9B (558 deals), automotive $14.8B; exits $320.9B across 945 (LTM value $460.5B, a 17-quarter high); fundraising $92.2B across just 113 funds; outlook on ECB rate rises and exits.
Three-column editorial text layout under a large condensed blue headline, with blue subheads and footnotes, plus a trends-to-watch call-out box
EMA deal value $521.4B YTD 2026 plus $243.0B LTM (2025: $784.3B; 2021: $813.3B); add-ons $177.2B YTD plus $71.9B LTM.
Two side-by-side combo charts: annual bars for deal value with a stacked darker segment for the LTM value, line for deal count and a dot for LTM count, under an action-title headline
Quarterly LTM EMA deal value rose to $818.2B in Q2'26 before easing to $764.4B in Q3'26, with count near 8,800.
Single full-width quarterly bar chart (Q1 2020 to Q3 2026, 27 bars with rotated value labels inside) with a deal-count line on a secondary axis, under an action-title headline
EMA deal mix by country; the UK's share of deal value rises to about 32% in 2026 YTD, ahead of Germany, France, Italy, Spain and India.
Two side-by-side 100% stacked column charts (count on the left, value on the right) for 2020 to 2026 YTD, with a shared colour legend under an action-title headline
EMA buyout deal size figures of $520.1M and $81.7M and PE growth figures of $118.7M and $22.5M in 2026 YTD (the median and average chart headings appear swapped on the slide).
Two side-by-side line charts with end-point value labels, each line representing a deal or exit type, under an action-title headline
EMA sector mix; industrial manufacturing and infrastructure and transport take larger shares of value in 2026 YTD.
Two side-by-side 100% stacked column charts (count on the left, value on the right) for 2020 to 2026 YTD, with a shared colour legend under an action-title headline
Quarterly LTM EMA exit value rose to $460.5B in Q3'26 (peak $551.7B in Q4'21) while exit count fell to about 1,430.
Single full-width quarterly bar chart (Q1 2020 to Q3 2026, 27 bars with rotated value labels inside) with a deal-count line on a secondary axis, under an action-title headline
EMA exit mix by country; India takes about 27% and Germany about 20% of exit value in 2026 YTD.
Two side-by-side 100% stacked column charts (count on the left, value on the right) for 2020 to 2026 YTD, with a shared colour legend under an action-title headline
EMA median exit sizes: listings $445.4M, buyouts $299.0M, acquisitions $133.5M; averages $2,081.7M, $893.8M (acquisitions) and $753.7M (buyouts).
Two side-by-side line charts with end-point value labels, each line representing a deal or exit type, under an action-title headline
EMA exit mix by type; buyouts are nearly half of exit count and listings around 30% of exit value in 2026 YTD.
Two side-by-side 100% stacked column charts (count on the left, value on the right) for 2020 to 2026 YTD, with a shared colour legend under an action-title headline
EMA exit mix by sector; TMT leads exit count while financial services and industrial manufacturing take large value shares in 2026 YTD.
Two side-by-side 100% stacked column charts (count on the left, value on the right) for 2020 to 2026 YTD, with a shared colour legend under an action-title headline
Quarterly LTM EMA fundraising peaked at $211.5B (Q2'24), troughed at $76.0B (Q1'26) and recovered to $108.2B in Q3'26, with fund count about 170.
Single full-width quarterly bar chart (Q1 2020 to Q3 2026, 27 bars with rotated value labels inside) with a fund-count line on a secondary axis, under an action-title headline
EMA fundraising by type; buyout funds hold about 77% of both fund count and capital in 2026 YTD.
Two side-by-side 100% stacked column charts (count on the left, value on the right) for 2020 to 2026 YTD, with a shared colour legend under an action-title headline
EMA fundraising by country; India's share of capital raised jumps to about 16% in 2026 YTD while the UK's share falls.
Two side-by-side 100% stacked column charts (count on the left, value on the right) for 2020 to 2026 YTD, with a shared colour legend under an action-title headline
DCC Energy $7.7B, ATG Entertainment $6.0B, ContiTech $4.9B, Mitie Group $4.1B, Bayer contraceptives unit $3.4B, Nestle Waters France $3.4B, Standard Life Assurance $2.7B, Bodycote $2.5B, McGill and Partners $2.0B, Goodwin Steel Castings $1.5B.
Dark navy slide with a white map and numbered colour pins on the left and a boxed ranked list of the ten largest deals (name, size, city, deal type, sector) on the right
Section divider: ASPAC PE-announced four-quarter sums were $181.4B across 1,504 transactions in Q3'26.
Full-bleed city/architecture photo with blue gradient overlay on the left, large numbered section tab, oversized condensed headline stating the region's four-quarter deal total, and pill navigation bar top-right
ASPAC investment $137.8B across 1,109 deals, LTM a six-quarter high of $181.4B; Australia $42.9B across 295 deals (Qube $8.2B); China $30.9B across 297 deals; South Korea $11.5B across 128; Andrew Thompson quote on AI infrastructure competing with PE.
Two text columns plus a solid blue pull-quote panel on the right with an executive headshot, name and title
Japan $29.1B across 260 deals (LTM $41.6B); exits $203.4B across 226, nearly double 2025's $110B, driven by $132.9B of listings; fundraising $23.8B across 42 funds, the slowest in over a decade.
Three-column editorial text layout under a large condensed blue headline, with blue subheads and footnotes, plus a trends-to-watch call-out box
ASPAC deal value $137.8B YTD 2026 plus $43.6B LTM (2025: $148.7B; 2021: $198.5B); add-ons $25.8B YTD plus $8.3B LTM.
Two side-by-side combo charts: annual bars for deal value with a stacked darker segment for the LTM value, line for deal count and a dot for LTM count, under an action-title headline
Quarterly LTM ASPAC deal value climbed from $148.7B (Q4'25) to $181.4B in Q3'26, with deal count near 1,500.
Single full-width quarterly bar chart (Q1 2020 to Q3 2026, 27 bars with rotated value labels inside) with a deal-count line on a secondary axis, under an action-title headline
ASPAC deal mix by country; China's share of deal count rebounds to about 27% in 2026 YTD, alongside Australia, South Korea and Japan.
Two side-by-side 100% stacked column charts (count on the left, value on the right) for 2020 to 2026 YTD, with a shared colour legend under an action-title headline
ASPAC median buyout size $109.7M and growth $22.0M in 2026 YTD; average buyout $571.9M and growth $182.2M.
Two side-by-side line charts with end-point value labels, each line representing a deal or exit type, under an action-title headline
ASPAC sector mix; TMT holds the largest share of deal value, about 36% in 2026 YTD.
Two side-by-side 100% stacked column charts (count on the left, value on the right) for 2020 to 2026 YTD, with a shared colour legend under an action-title headline
Quarterly LTM ASPAC exit value jumped from $129.2B in Q2'26 to $234.5B in Q3'26, while exit count eased to about 330.
Single full-width quarterly bar chart (Q1 2020 to Q3 2026, 27 bars with rotated value labels inside) with a deal-count line on a secondary axis, under an action-title headline
ASPAC median exit sizes: listings $880.3M, buyouts $223.8M, acquisitions $131.7M; averages $3,594.3M, $868.9M and $678.5M in 2026 YTD.
Two side-by-side line charts with end-point value labels, each line representing a deal or exit type, under an action-title headline
ASPAC exit mix by type; public listings account for roughly two-thirds of exit value in 2026 YTD.
Two side-by-side 100% stacked column charts (count on the left, value on the right) for 2020 to 2026 YTD, with a shared colour legend under an action-title headline
ASPAC exit mix by sector; TMT represents roughly two-thirds of exit value in 2026 YTD.
Two side-by-side 100% stacked column charts (count on the left, value on the right) for 2020 to 2026 YTD, with a shared colour legend under an action-title headline
Quarterly LTM ASPAC fundraising fell from $82.5B (Q2'21) to a low of $31.8B (Q1'26) and stood at $40.8B in Q3'26 with about 65 funds.
Single full-width quarterly bar chart (Q1 2020 to Q3 2026, 27 bars with rotated value labels inside) with a fund-count line on a secondary axis, under an action-title headline
ASPAC fundraising by type; buyout funds' share of capital eases to about 64% in 2026 YTD from about 74% in 2025 as growth funds recover.
Two side-by-side 100% stacked column charts (count on the left, value on the right) for 2020 to 2026 YTD, with a shared colour legend under an action-title headline
Qube Holdings $8.2B, Steadfast Group $5.4B, Paraway Pastoral $3.0B, Plus ES $2.1B, Leopalace21 $1.7B, Lingxi Games $1.5B, SUNWODA EVB $1.2B, NOJA Power $1.0B, Luckin Coffee $1.0B, LOTTE Rental $900.3M.
Dark navy slide with a white map and numbered colour pins on the left and a boxed ranked list of the ten largest deals (name, size, city, deal type, sector) on the right
Describes KPMG's PE services across the investment lifecycle, citing 4,200+ professionals and 920+ KPMG partners.
Left: intro text with pill-shaped headers and two icon statistics; right: solid blue 'How KPMG can help' panel
Methodology: PitchBook datasets, geographic assignment by target headquarters, definitions for deals, exits and fundraising, and the treatment of announced and in-progress deals.
Dense three-column methodology text with blue subheads
Contact details for Gavin Geminder, Tilman Ost, Jean-Pierre Trouillot, John Cho, Andrew Thompson and Donald Zambarano, plus acknowledgements for the KPMG publication team.
Two columns of contact cards with blue accent bars and a blue acknowledgements panel on the right
KPMG back cover with social links, a KPMG Trusted AI imagery note, general-information disclaimer and copyright notices.
Blue gradient back cover with logo, social icons and legal text
Các câu hỏi phổ biến về slide này và nội dung trình bày cơ bản.
It analyses global private equity activity through 30 September 2026: deal value and volume, deal sizes, sector and buyout-type mix, carve-outs, exits, fundraising, dry powder and portfolio inventory. It covers the world as a whole and then the Americas, US, EMA and ASPAC, with top-10 deal lists for each region and a spotlight feature on carve-outs.
Selectivity is the main theme. Global PE investment reached $1.5 trillion by the end of Q3'26, on pace for the third-best year on record, but deal volume (14,650) was on pace for the slowest year since 2020. Exit value was $985.2 billion across just 2,200 exits, and global fundraising was $367.4 billion. Energy and natural resources reached $243.3 billion, close to a record, helped by demand for AI power. Carve-outs reached $182.2 billion across 1,254 deals.
KPMG Private Enterprise publishes it every quarter through KPMG's global private capital practice. The Q3'26 edition came out in October 2026, led by Gavin Geminder, Donald Zambarano, Tilman Ost and Andrew Thompson, and uses data provided by PitchBook.
The report lists the $9.6B buyout of the Seattle Seahawks, the $8.2B take-private of Qube Holdings, the $7.7B deals for The Baldwin Insurance Group and DCC Energy, and the $7.0B secondary buyouts of Aypa Power and PANTHERx Rare as the largest deals globally.
Each regional section follows the same pattern: a photo divider with one headline statistic, an overview written as narrative, a 'Trends to watch' call-out, then a run of chart pages. Each chart page has a short action title stating the insight. Combo charts mix bars and lines, and 100% stacked columns show how the mix changes over time. Each section ends with a top-10 deals map. The repeated layout and the navigation bar make a 94-page report easy to scan.
Start with an outline of sections and one takeaway per slide, then lay out each takeaway as a chart or a narrative page. 2Slides can turn a document, report or outline into slides automatically, which helps you get a structured, chart-ready deck in the same style without building every page by hand.
The original PDF is published by KPMG at https://assets.kpmg.com/content/dam/kpmgsites/xx/pdf/2026/10/kpmg-pe-pulse-q3-2026.pdf, and the series is listed at kpmg.com/PulseofPE.
Original quarterly report PDF published October 2026

Create Your Own Slides
Turn your ideas into professional presentations in seconds with 2slides AI.
Tham khảo thiết kế chuyên nghiệp, chọn phong cách của bạn và tạo slide với kết xuất văn bản hoàn hảo. Được hỗ trợ bởi Nano Banana—bắt đầu tạo trình bày của bạn ngay bây giờ.
Đại Lý AI Của Bạn Cho Slide. Tiết kiệm thời gian, tỏa sáng nhanh hơn với việc tạo bài thuyết trình thông minh.


© 2026 2slides. Bảo lưu mọi quyền.