
Thuộc bộ sưu tập Ví dụ bài thuyết trình cho nhà đầu tư · Ví dụ thuyết trình nhà đầu tư ngành bán dẫn
KLA Q1 Fiscal 2027 Earnings Presentation (quarter ended September 30, 2026; reported October 28, 2026): 17-slide earnings deck from KLA Corporation, the semiconductor process control and yield management equipment maker, covering $4.14B revenue (+29% Y/Y, +13% Q/Q), 62.7% non-GAAP gross margin, 46.1% non-GAAP operating margin, $1.22 non-GAAP diluted EPS, revenue by segment, product and region, the investment-grade balance sheet, free cash flow and capital returns, December 2026 quarter guidance of $4.7B +/- $200M, and full GAAP to non-GAAP reconciliations.
Dùng trang bìa của bài trình bày này làm mẫu phong cách cho các slide tạo từ nội dung của bạn. Hoặc chọn bất kỳ trang nào bên dưới để lấy bố cục của trang đó làm tham chiếu.
Điều Hướng Nhanh
Thẻ
Chia sẻ slide
KLA Q1 Fiscal 2027 Earnings Presentation (quarter ended September 30, 2026; reported October 28, 2026): 17-slide earnings deck from KLA Corporation, the semiconductor process control and yield management equipment maker, covering $4.14B revenue (+29% Y/Y, +13% Q/Q), 62.7% non-GAAP gross margin, 46.1% non-GAAP operating margin, $1.22 non-GAAP diluted EPS, revenue by segment, product and region, the investment-grade balance sheet, free cash flow and capital returns, December 2026 quarter guidance of $4.7B +/- $200M, and full GAAP to non-GAAP reconciliations.
Xem chi tiết từng trang slide, bao gồm bố cục, nội dung chính và các phần tử trực quan.
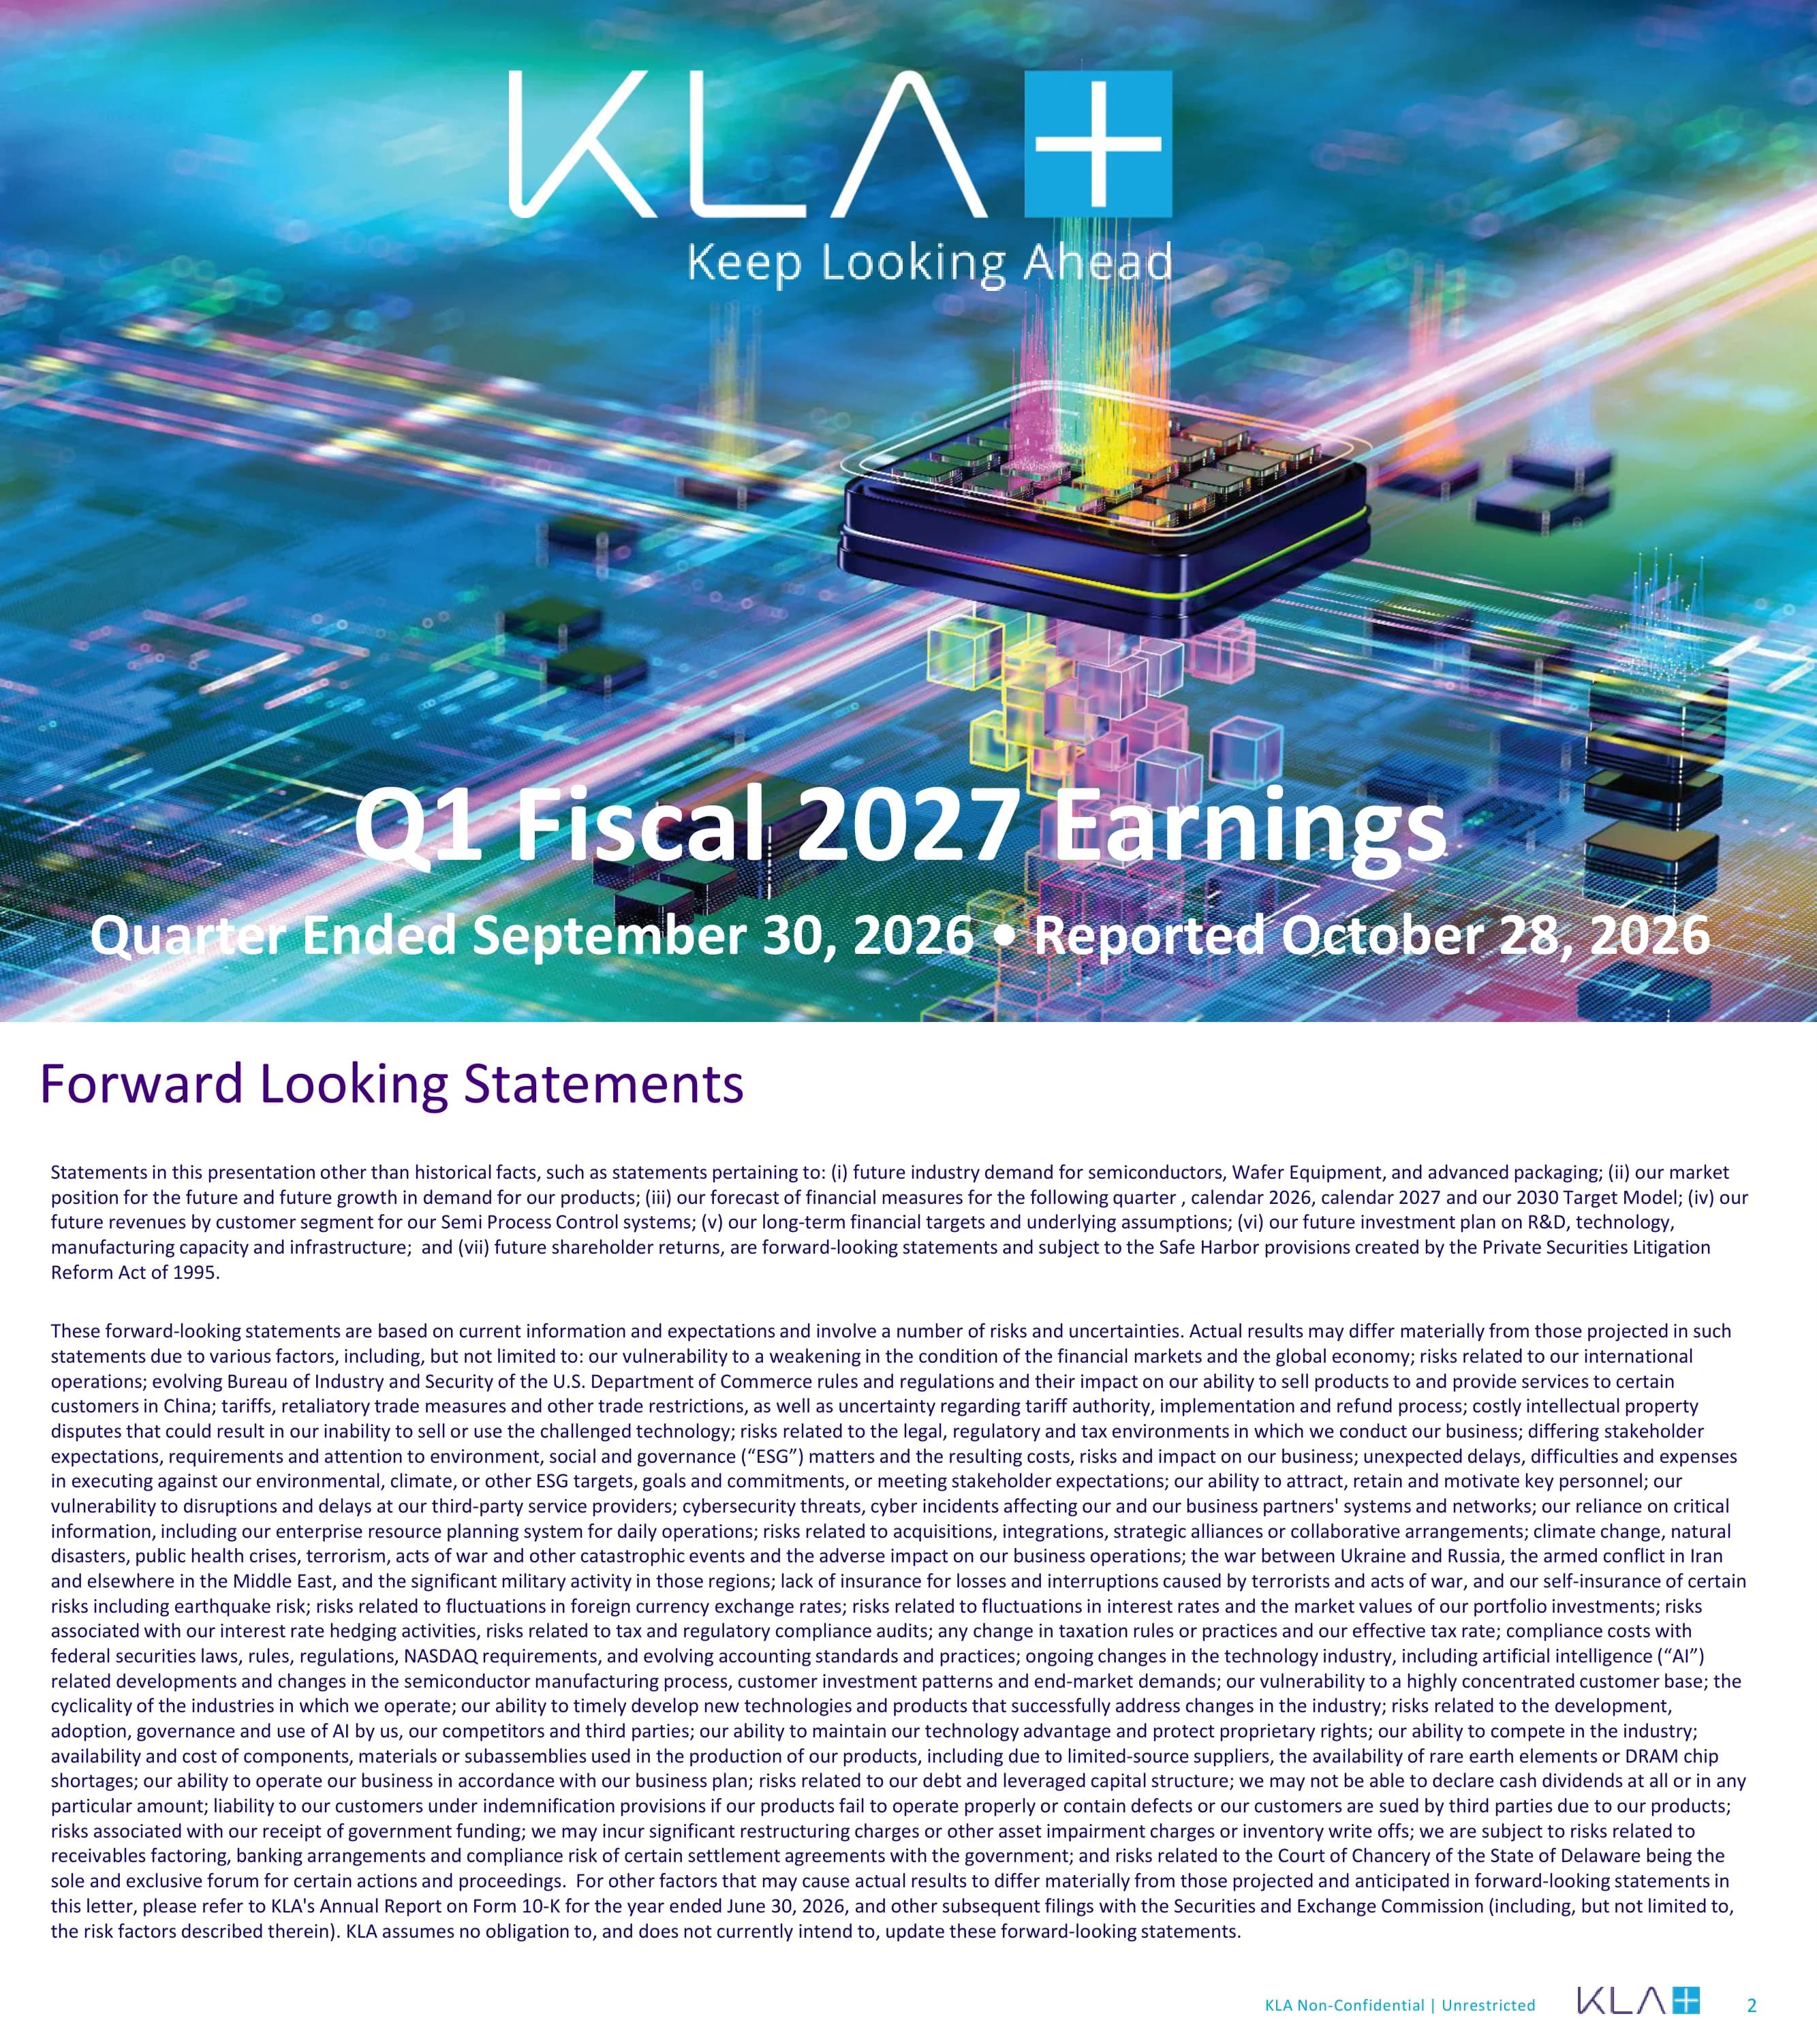
Cover slide with the KLA logo and 'Keep Looking Ahead' tagline, titled 'Q1 Fiscal 2027 Earnings', Quarter Ended September 30, 2026, Reported October 28, 2026.
Full-bleed hero image of a glowing chip package over a circuit board with light streaks; centered logo at top and large white title text at the bottom.
Safe-harbor disclaimer covering forecasts for semiconductors, Wafer Equipment and advanced packaging, next-quarter, calendar 2026, calendar 2027 and 2030 Target Model forecasts, and risks including BIS export rules for China, tariffs, the Ukraine-Russia war and conflict in Iran/the Middle East, AI developments, customer concentration and rare earth or DRAM chip shortages; refers to the Form 10-K for the year ended June 30, 2026.
Purple title top-left with two dense paragraphs of body text across the full width; standard footer with 'KLA Non-Confidential | Unrestricted', logo and page number.
Circular values wheel (Perseverance, Drive to Be Better, High Performance Teams, Honest Forthright Consistent, Indispensable for Customers; differentiators Collaboration, Innovation, Execution) linked to three pillars: Consistent Strategy and Execution, Management By Metrics, and Financial Discipline and Rigor; banner reads 'Focused on driving sustainable profitability and growth'.
Left half: concentric ring diagram with icons; a large chevron points to the right half, a grey panel with three check-mark headed bullet groups; full-width purple banner at the bottom.
Revenue $4.14B, Gross Margin 62.7%*, Operating Margin 46.1%*, Net Income $1.60B*, Non-GAAP Diluted EPS $1.22 and GAAP Diluted EPS $1.18 (* non-GAAP metrics); product photo and caption for the Surfscan SP7XP bare-wafer defect inspection system.
Row of four light-blue KPI tiles across the top, two more KPI tiles stacked on the right, product photo in the center and a descriptive caption on the left.
Q1-FY27 revenue: Semiconductor Process Control $3,754M (+29% Y/Y, +15% Q/Q, 91%), Specialty Semiconductor Process $140M (+16% Y/Y, -13% Q/Q, 3%), PCB and Component Inspection $242M (+28% Y/Y, +0% Q/Q, 6%); total $4,136M (+29% Y/Y, +13% Q/Q). Semi Process Control system revenue by end market: Foundry & Logic 72%, Memory 28%.
Table with colored arrow-shaped row labels, columns for revenue, Y/Y, Q/Q and a small donut gauge per row; large donut chart on the right with a tool image in the center.
Q1-FY27 revenue by product: Wafer Inspection $2,111M (+37% Y/Y, +19% Q/Q, 51%), Patterning $862M (+29%, +18%, 21%), Specialty Semi Process $114M (+13%, -17%, 3%), PCB and Component Inspection $168M (+43%, +0%, 4%), Services $850M (+14%, +4%, 20%), Other $31M (-28%, +28%, 1%); total $4,136M (+29% Y/Y, +13% Q/Q). Revenue by region: China 34%, Taiwan 25%, North America 15%, Korea 12%, Europe 5%, Rest of Asia 5%, Japan 4%.
Six-row product table with colored arrow labels and donut gauges plus a total row; regional donut chart with a globe in the center and a two-column legend on the right.
As of 09/30/2026: Total Cash $4,741M, Working Capital $8,018M, Total Assets $18,405M, Debt $5,723M, Total Shareholders' Equity $6,523M; Bonds Outstanding $5.95B, weighted average interest rate 4.67%, weighted average maturity 17.8 years; ratings Moody's A2, S&P A-, Fitch A. Bond maturity chart shows $4,741M cash plus $1,500M undrawn revolver liquidity and maturities from CY29 ($800M) through CY62 ($800M), including a $1,500M undrawn revolver in CY30.
Three purple-header tables across the top (balance sheet, bond profile, credit ratings) above a full-width bar chart of the bond maturity ladder with legend and footnotes.
Value Creation cycle (Investment in Growth and New Products, Market Leadership and Differentiated Solutions, Strong Margins and FCF, Capital Returns to Shareholders) beside a chart of free cash flow: CY20 $1.8B (29%), CY21 $2.5B (31%), CY22 $3.0B (28%), CY23 $3.2B (33%), CY24 $3.4B (31%), CY25 $4.4B (34%), LTM $4.0B (28%), ~20% CAGR; banner: committed to long-term >90% FCF returned to shareholders through dividends and share repurchases.
Left: four-quadrant circular cycle diagram with circular arrow; right: combo column-and-line chart with CAGR arrow; purple banner at the bottom.
Share repurchases ($M, cash settlement basis): CY21 1,403, CY22 4,483 (includes $3B ASR), CY23 1,760, CY24 2,059, CY25 2,025, LTM 2,680, remaining authorization 8,812; ~$50 average price per share since 2021 (reflects 10-for-1 split). Dividend per share rose from 0.05 in CY06 to 0.74 in CY25 and 0.92 NTM, ~16% dividend CAGR 2006 to current annual; Mar. 12, 2026 announced 17th consecutive annual dividend increase, up 21% to $0.23/share from $0.19/share.
Two side-by-side bar charts: cyan repurchase bars with a pale remaining-authorization bar on the left, purple dividend-per-share bars across CY06 to NTM on the right, with large callout statistics.
September quarter free cash flow $1.34B*, FCF margin 32%*, FCF conversion 83%*; September quarter share buyback $936M, LTM share buyback $2.68B, September quarter dividends paid $305M, LTM dividends paid $1.11B; product photo of the Puma 9980 laser scanning inspection system for 1Xnm advanced logic, advanced DRAM and 3D NAND.
Three KPI tiles on the left, four KPI tiles on the right, central product photo with caption below and definitions footnote.
December 2026 quarter guidance: revenue $4.7B +/- $200M, non-GAAP gross margin 62.5% +/- 1%, GAAP diluted EPS $1.41 +/- $0.11, non-GAAP diluted EPS $1.44 +/- $0.11. Macro assumptions: Semi PC revenue by end market Foundry/Logic ~60%, Memory ~40% (DRAM ~84% | NAND ~16%). Model assumptions: non-GAAP opex ~$710M, OIE net ~$25M, effective tax rate ~14.5%, diluted share count ~1.306B. Banner: 'Strong, resilient and delivering shareholder value'.
Four-row guidance table with gradient blue-to-purple label cells, a vertical gradient divider, and a grey assumptions panel on the right; purple banner at the bottom.
Section divider introducing the appendix of reconciliation tables.
Full-bleed hero image reused from the cover, white section title on the left and logo top-right.
Quarter ended Sep. 30, 2026: GAAP net income $1,548.6M adjusted for acquisition-related charges 43.0, tax effect (14.6), Pillar Two Undertaxed Profits Rule taxes 20.2 and discrete tax items 5.8 to non-GAAP net income $1,603.0M; GAAP diluted EPS $1.18 vs non-GAAP $1.22 on 1,311.1M shares; GAAP gross margin 61.9% to non-GAAP 62.7%; GAAP operating income $1,861.7M to non-GAAP $1,904.7M; GAAP operating margin 45.0% vs non-GAAP 46.1%; GAAP tax rate 15.1% vs non-GAAP 14.1%; R&D $395.1M; non-GAAP SG&A $293.3M.
Two boxed financial tables side by side (net income/EPS/tax on the left, gross profit/opex/operating income on the right) with footnotes on rounding and EDSP effects.
Quarter ended Sep. 30, 2026: operating cash flow $1,530.9M less capex (194.8) = FCF $1,336.2M; FCF margin 32.3%; FCF conversion 83.4%; GAAP comparable 98.9%. Twelve months ended Sep. 30, 2026 FCF $4,037.6M on revenue $14,505.8M (27.8%); calendar-year FCF from $1,767.8M (2020) to $4,382.3M (2025, 34.4% margin). Capital returns: $1,240.9M in the quarter (dividends 305.1, repurchases 935.8) and $3,789.4M over twelve months.
Single large boxed table with a three-month column and eight twelve-month columns, followed by a capital returns sub-table and an explanatory paragraph.
Q2 FY2027 guidance range (low/high): GAAP diluted EPS $1.30 / $1.52 to non-GAAP $1.33 / $1.55 on 1,306M shares; GAAP gross margin 60.8% / 62.8% to non-GAAP 61.5% / 63.5%; GAAP opex $712M / $724M to non-GAAP $704M / $716M; other expense $25M; GAAP tax rate 14.7% to non-GAAP 14.5%. Note that guidance is as of October 28, 2026.
Boxed low/high table on the left two-thirds of the slide with a note paragraph below; right side left empty.
Explains why KLA provides non-GAAP information and defines the adjustments: (a) acquisition-related charges, mainly amortization of intangible assets; (b) income tax effect of non-GAAP adjustments; (c) Pillar Two undertaxed profits rule taxes, expected to be temporary and to reverse upon adoption of Side-by-Side Safe Harbor provisions; (d) discrete tax items.
Two-column text layout: general explanation on the left, lettered adjustment definitions on the right.
Closing brand slide with the KLA logo and 'Keep Looking Ahead' tagline.
Full-bleed hero image with the logo centered over the chip render.
Các câu hỏi phổ biến về slide này và nội dung trình bày cơ bản.
It is KLA Corporation's 17-slide deck for the quarter ended September 30, 2026 (reported October 28, 2026), covering income statement highlights, revenue by segment, product, end market and region, the balance sheet and credit ratings, free cash flow and capital returns, December 2026 quarter guidance, and GAAP to non-GAAP reconciliations.
As shown on the slides: revenue $4.14B (total $4,136M, +29% Y/Y and +13% Q/Q), non-GAAP gross margin 62.7%, non-GAAP operating margin 46.1%, non-GAAP net income $1.60B, non-GAAP diluted EPS $1.22 and GAAP diluted EPS $1.18.
For the December 2026 quarter KLA guided revenue of $4.7B +/- $200M, non-GAAP gross margin of 62.5% +/- 1%, GAAP diluted EPS of $1.41 +/- $0.11 and non-GAAP diluted EPS of $1.44 +/- $0.11, assuming Semi Process Control revenue roughly 60% Foundry/Logic and 40% Memory.
KLA's fiscal year ends on June 30, so fiscal 2027 runs from July 2026 to June 2027 and the July-September 2026 quarter is Q1 FY27. The previous deck in this series is KLA's Q4 FY26 earnings presentation.
It is the earnings slide presentation KLA published on its investor relations website alongside its Q1 FY27 results on October 28, 2026. It is shared here unmodified for reference and study.
Yes. The page offers the original PDF and a PPTX converted from it, so you can reuse layouts such as the KPI tiles, segment tables with donut gauges and the bond maturity chart. Converted files may need minor font and alignment touch-ups.
It uses a consistent deep-purple and cyan palette, big-number KPI tiles, color-coded arrow labels on segment tables, donut and column-line combo charts, purple tagline banners, and a clean appendix of boxed reconciliation tables.
The slides show $936M of share buybacks and $305M of dividends in the September quarter (capital returns of $1,240.9M), and $2.68B of buybacks plus $1.11B of dividends over the last twelve months.
Official investor relations site where KLA publishes earnings releases and slide presentations.

Create Your Own Slides
Turn your ideas into professional presentations in seconds with 2slides AI.
Tham khảo thiết kế chuyên nghiệp, chọn phong cách của bạn và tạo slide với kết xuất văn bản hoàn hảo. Được hỗ trợ bởi Nano Banana—bắt đầu tạo trình bày của bạn ngay bây giờ.
Đại Lý AI Của Bạn Cho Slide. Tiết kiệm thời gian, tỏa sáng nhanh hơn với việc tạo bài thuyết trình thông minh.


© 2026 2slides. Bảo lưu mọi quyền.