
Thuộc bộ sưu tập Ví dụ bài thuyết trình cho nhà đầu tư · Ví dụ bài thuyết trình thương mại điện tử
Global-e Q2 2026 Earnings Presentation — second quarter 2026 results and business update from the cross-border e-commerce enabler, covering GMV of $2.09B (+43.7% YoY), revenue of $299.0M (+39.1% YoY), adjusted EBITDA of $62.4M (+62.3% YoY), merchant retention, operational leverage and FY26 guidance
Điều Hướng Nhanh
Thẻ
Chia sẻ slide
Global-e Q2 2026 Earnings Presentation — second quarter 2026 results and business update from the cross-border e-commerce enabler, covering GMV of $2.09B (+43.7% YoY), revenue of $299.0M (+39.1% YoY), adjusted EBITDA of $62.4M (+62.3% YoY), merchant retention, operational leverage and FY26 guidance
Xem chi tiết từng trang slide, bao gồm bố cục, nội dung chính và các phần tử trực quan.
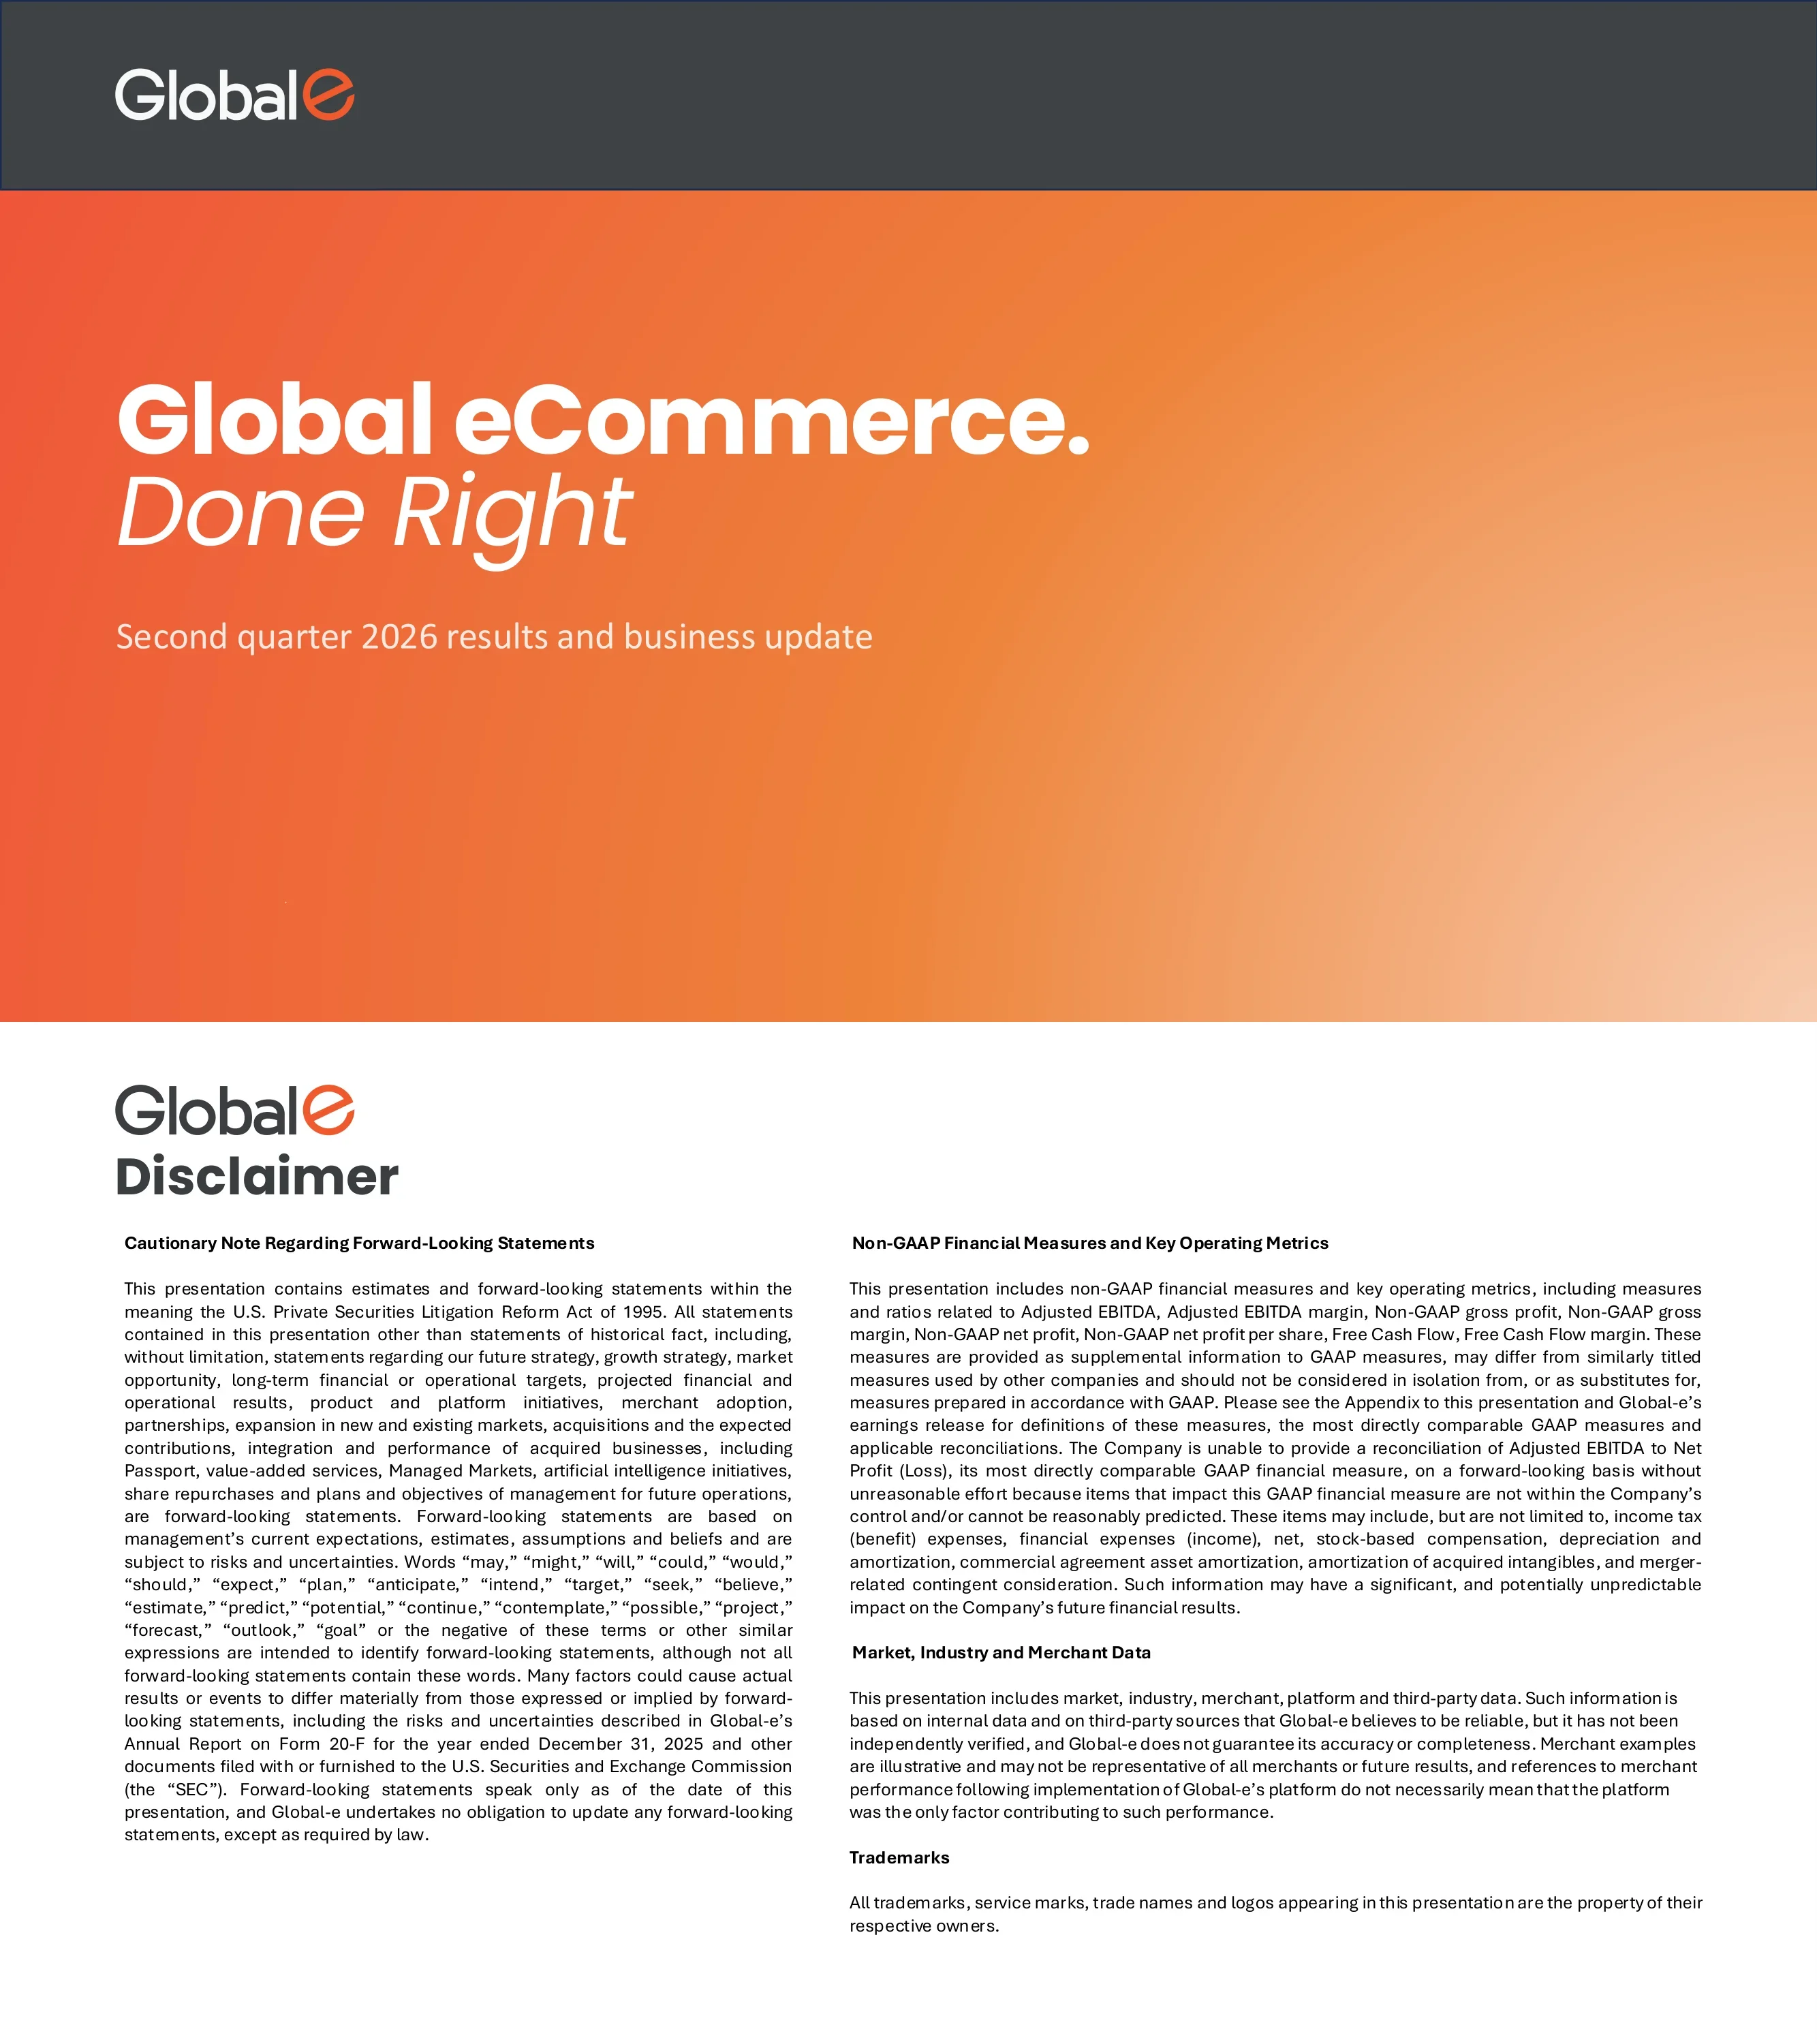
Cover slide introducing Global-e's second quarter 2026 results and business update under the brand tagline 'Global eCommerce. Done Right', with the Global-e logo in a charcoal header band.
Charcoal top band holding the white Global-e logo; below it a full-width orange-to-peach gradient field with a large bold white headline, an italic second line ('Done Right') and a small subtitle, all left-aligned.
Legal disclaimer covering forward-looking statements under the U.S. Private Securities Litigation Reform Act of 1995 (strategy, Passport, value-added services, Managed Markets, AI initiatives, share repurchases), non-GAAP measures and key operating metrics (adjusted EBITDA, non-GAAP gross profit, non-GAAP net profit, free cash flow), market and merchant data sourcing, and trademarks.
Logo and 'Disclaimer' heading top-left; two justified text columns — left for the forward-looking statements note, right split into Non-GAAP measures, Market/Industry/Merchant Data and Trademarks sub-sections with bold run-in headings.
Six headline KPIs: $1.33B annual revenue (FY26 guidance mid-point, 38% YoY growth), $8.96B annual GMV (FY26 guidance mid-point, 36% YoY growth), +22% adjusted EBITDA margin (FY26 guidance mid-point), +1,500 enterprise partner merchants, +35M transactions worldwide LTM, and +32% organic revenue growth (FY26 guidance mid-point).
Title top-left, then a 3x2 grid of big-number stat blocks; each block has a thin rule above, an oversized number, a bold label and a grey qualifier line. Only the first number (revenue) is set in brand orange.
Explains the Global-e platform as a hub of localization services around the core 'Global eCommerce Done Right' offering: local markets know-how, local pricing, local messaging, local payments, duties and taxes compliance, global shipping, easy returns, risk protection and demand generation.
Dark charcoal background; small orange eyebrow label 'THE PLATFORM' and a large white headline on the left; on the right a large circular wheel with concentric rings, a white centre disc holding the logo, and nine white icon circles arranged around it with dotted spokes.
Introduces Global Compass, Global-e's data engine built on >30M transactions, >2B sessions, >200 markets and >1,500 clients. It promises better results and conversion, more customers and transactions, and more data and insights across duty strategies, returns pricing, pricing coefficients, duty thresholds, shipping flat rates and conversion-rate benchmarks; right column lists optimized trading from day one, staying ahead of the market and making informed decisions.
Two-line headline with 'Global Compass' in orange; left half shows a ring diagram around the logo with three callout cards (top-left, top-right stats card in a 2x2 grid, bottom insights card with a row of six icons); right third holds three stacked text blocks separated by thin rules.
Shows a typical >30% uplift in international traffic conversion, two merchant testimonials (Lucy Aylen of Never Fully Dressed, Bianca Birgan of DISSH), and four merchant results: TAKOMO +26% YoY conversion rate, Hobonichi +70% YoY international online revenue, DISSH +86% YoY international online revenue, and Repetto +41% YoY sales in the UK.
Top row of three columns divided by rules — a giant orange '>30%' stat with italic caption, then two quote blocks with merchant logo and attribution; bottom area holds a 2x2 grid of merchant logo + large orange percentage + short descriptor.
Two bar charts for 2021–2025: Net Dollar Retention (152%, 130%, 127%, 123%, 122%) headlined '>120%', and Gross Dollar Retention (98%, 98%, 97%, 97%, 96%) headlined '>96%'. A footnote explains 2024 figures are adjusted for the Ted Baker bankruptcy and Borderfree merchants that did not re-platform; unadjusted 2024 NDR and GDR were 119% and 93.5%.
Full-width title, then two side-by-side panels each with a rule, a large orange headline number, a bold chart label and a five-bar column chart; the latest-year bar is orange, the rest charcoal; footnote in small grey italics at the bottom.
Logo wall of major merchants including Marks & Spencer, Reformation, FIGS, Alo, Disney Store, Victoria's Secret, Harrods, Mattel Creations, Logitech G, Bang & Olufsen, Glossier, Givenchy, Onitsuka Tiger, Montblanc, Marc Jacobs, Hugo Boss, Longchamp, Vuori, Stussy, Skims, adidas, Kith, Versace, L.L.Bean, Cole Haan, Aimé Leon Dore, Karl Lagerfeld, Wimbledon, Zadig & Voltaire, Kenzo, AllSaints, Anine Bing, Cartier and Repetto; a sidebar lists Q2 2026 latest additions: Ferrari, Naked Wolfe, N.Peal, Montirex, J.M. Weston, Malina, Root, Mikuta and McLaren Golf.
Left two-thirds on white: small two-line title and a dense 5-column grid of greyscale/black brand logos; right third is an orange gradient panel with an uppercase 'Q2 2026 LATEST ADDITIONS' label and a vertical stack of white logos.
Growth stack from the current base: existing merchants (same store sales, land and expand), contribution of new merchants (new geos, new verticals, growing YoY), value added services (demand generation, duty drawback, trading models, returns) and additional TAM (multi-local, Managed Markets, non-MoR, B2B).
A charcoal 'Current' block on the left followed by four progressively taller orange-gradient columns topped with roof-like triangles, forming an ascending staircase; each column carries a bold white heading and a short bulleted list.
Lists Global-e's business lines — cross border/multi-local, physical/digital goods, MoR/non-MoR, Managed Markets and advanced logistics — and the sources of efficiency: economies of scale and skill, shared services across business models, a multi-tenant platform where upgrades benefit all merchants, efficient go-to-market through brand recognition and channel partnerships, and disciplined cost management.
Split layout: left white area with a large two-colour headline (charcoal and orange) and an italic list of business lines; right third is an orange gradient panel with five white text statements separated by thin white rules.
Section divider opening the Q2 2026 quarterly financials, framing merchant success as the driver of Global-e's own results.
Same template as the cover: charcoal header band with logo over a full orange gradient, small uppercase eyebrow, bold white headline and italic white continuation line.
Quarterly GMV ($M) from Q1 2023 to Q2 2026: 704, 825, 839, 1,189; 930, 1,082, 1,134, 1,713; 1,243, 1,454, 1,512, 2,361; 1,742 and 2,089 in Q2 2026. YoY growth row runs from 54.6% to 43.7% in Q2 2026, re-accelerating from 33.4% in Q3 2025.
Title and subtitle top-left; 14-bar column chart grouped by year with dashed vertical separators, data labels above bars, quarter labels and a YoY % row beneath; a thick orange trend arrow rises across the chart; the Q2 26 bar and its labels are orange.
Quarterly revenue ($M) from Q1 2023 to Q2 2026: 117.6, 133.3, 133.6, 185.4; 145.9, 168.0, 176.0, 262.9; 189.9, 214.9, 220.8, 336.7; 252.1 and 299.0 in Q2 2026, with Q2 2026 YoY growth of 39.1% — the fastest since Q2 2023.
Mirrors the GMV slide: 14 charcoal bars with data labels, dashed year separators, a rising orange arrow and a YoY % row; the latest quarter highlighted in orange.
Adjusted opex as a % of revenue grouped by same quarter across years: Q1 from 35.2% (2022) to 27.4% (2026); Q2 from 29.6% (2022) to 24.7% (2026); Q3 from 30.0% to 28.0% (2025); Q4 from 26.2% to 21.1% (2025). Footnote defines adjusted opex as excluding SBC, intangible and commercial-agreement amortization, acquisition-related expenses and merger contingent consideration.
Column chart with a y-axis in percent, bars grouped into four same-quarter clusters separated by dashed lines; a dotted orange downward-sloping arrow runs across the top; Q1 26 and Q2 26 bars in orange.
Stacked adjusted opex for Q2 2024, Q2 2025 and Q2 2026: total falls from 29.5% to 29.0% to 24.7% of revenue. S&M 11.3% ($19M) → 12.7% ($27.2M) → 10.6% ($31.8M); R&D 12.6% ($21.2M) → 12.2% ($26.2M) → 10.2% ($30.4M); G&A 5.6% ($9.4M) → 4.1% ($8.8M) → 3.9% ($11.7M) — dollars rise while ratios fall.
Three stacked columns (charcoal G&A, orange R&D, light grey S&M) each labelled with % and $; totals printed above with a dotted orange connector line, the latest total in orange; legend centred below.
Quarterly adjusted EBITDA ($M) grouped by same quarter: Q1 14.5, 21.3, 31.6, 50.2 (Q1 26, +58.9%); Q2 21.0, 31.3, 38.5, 62.4 (Q2 26, +62.3%); Q3 22.1, 31.1, 41.3; Q4 35.2, 57.1, 87.2. A YoY % row sits beneath every bar.
Grouped column chart in four same-quarter clusters with dashed separators, data labels above and a YoY % row below; 2026 bars and their growth figures are orange.
Annual adjusted EBITDA ($M): 32 (2021), 49, 93, 141, 199 and 289 forecast for 2026, with margins rising from 9% to 21.7% and a 55% CAGR. Free cash flow ($M): 13 (2021), 81, 106, 167, 280 (2025), with FCF margin rising from 5% to 29% and a >116% CAGR.
Two side-by-side column charts with bold sub-headings; margin percentages printed in grey italics above each bar; dotted orange CAGR arrows with rotated orange 'CAGR' labels; dashed baseline above a YoY % row; the 2026F EBITDA bar in orange.
Closing statement: as global e-commerce continues to develop and grow, Global-e will be there building solutions to enable merchants to simply trade the right way.
Cover template reused: charcoal header with logo over an orange gradient, uppercase eyebrow and a five-line bold white statement ending in an italic phrase.
Divider introducing the appendix of supplementary materials.
Full-bleed photo of a laptop and desk with a translucent dotted globe, washed in an orange-red duotone overlay; white bold 'Appendix' and italic subtitle on the left.
Explains why Global-e uses non-GAAP measures and KPIs, defines Gross Merchandise Value as the combined amount collected from the shopper and the merchant for all components of a transaction (products, duties and taxes, shipping), and notes limitations and the lack of a forward-looking adjusted EBITDA to net profit reconciliation.
Orange 'APPENDIX' eyebrow, black bold title, two justified text columns occupying the upper two-thirds of a white slide.
Definitions of non-GAAP gross profit and margin, adjusted EBITDA and margin, non-GAAP net profit and per share, free cash flow and FCF margin, plus the methodology for Gross Dollar Retention (seasonality-adjusted annualized churned GMV) and Net Dollar Retention (GMV from the prior-period merchant cohort versus the comparable prior period).
Appendix eyebrow and title; two text columns, left with five definition paragraphs, right with GDR and NDR methodology paragraphs.
FY20–FY25 table: gross profit 43.5, 91.4, 158.2, 233.6, 339.4, 436.2 plus amortization of acquired intangibles in cost of revenue gives non-GAAP gross profit of 43.5, 91.4, 167.9, 244.8, 349.4, 445.8 and non-GAAP gross margin of 31.9%, 37.3%, 41.1%, 42.9%, 46.4%, 46.3%.
Clean financial table with uppercase grey column headers for six fiscal years, thin row rules, and the two result rows shaded light grey with orange bold text.
FY20–FY25 bridge from net profit (loss) — 3,914; (74,933); (195,405); (133,805); (75,548); 68,270 ($K) — through income tax, financial expenses, stock-based compensation by function, D&A, commercial agreement asset amortization, acquired intangibles amortization, secondary offering costs, merger contingent consideration and M&A costs to adjusted EBITDA of 12,604; 32,424; 48,703; 92,735; 140,767; 198,529 and margins of 9.2% to 20.6%.
Dense 15-row reconciliation table with six fiscal-year columns, an SBC sub-group, and the final two rows shaded with orange bold text.
FY20–FY25: net cash from operating activities 29,350; 18,151; 89,328; 108,222; 169,393; 283,782 less purchases of property and equipment gives free cash flow of 28,894; 15,268; 80,976; 106,481; 167,058; 280,683 ($K) and FCF margin of 21.2%, 6.2%, 19.8%, 18.7%, 22.2%, 29.2%.
Spacious four-row table with large type, six fiscal-year columns and shaded orange result rows.
FY20–FY25 bridge from reported R&D, S&M and G&A expenses to their adjusted versions excluding SBC, intangibles and commercial-agreement amortization, M&A and merger costs; adjusted operational expenses total 31,114; 59,425; 121,058; 154,477; 211,720; 250,597 ($K), or 22.8%, 24.2%, 29.6%, 27.1%, 28.1% and 26.0% of revenue.
Long reconciliation table grouped into R&D, S&M and G&A blocks with bold subtotal rows, followed by two orange shaded total rows.
Closing slide with the Global-e website (www.global-e.com) and investor relations contact Alan Katz at IR@global-e.com.
Full-bleed dark photo of a boardroom with a large holographic dotted globe and data overlays; white logo, bold 'Thank You' and contact details stacked on the left.
Các câu hỏi phổ biến về slide này và nội dung trình bày cơ bản.
The deck reports Q2 2026 GMV of $2,089M (+43.7% YoY), revenue of $299.0M (+39.1% YoY) and adjusted EBITDA of $62.4M (+62.3% YoY), with adjusted operating expenses down to 24.7% of revenue from 29.0% a year earlier.
The 'Company at a glance' slide shows FY26 guidance mid-points of $1.33B revenue (38% YoY growth), $8.96B GMV (36% YoY growth), about 22% adjusted EBITDA margin and 32% organic revenue growth; the annual chart shows 2026F adjusted EBITDA of $289M.
Yes. The gallery page provides the original PDF and an editable PPTX version, so you can reuse the chart layouts, KPI grids and reconciliation tables in your own deck.
Yes. It covers the full set of slides such a company needs — GMV and revenue trend charts, retention (NDR/GDR), merchant case studies, a logo wall, operating leverage, EBITDA and FCF, and a non-GAAP appendix — in a clean orange and charcoal style that is easy to rebrand.
Two slides handle it: one groups adjusted opex as a % of revenue by the same quarter across 2022–2026 with a downward trend arrow, and another stacks G&A, R&D and S&M for Q2 2024, Q2 2025 and Q2 2026 to show dollars rising while the total ratio falls from 29.5% to 24.7%.
Net Dollar Retention above 120% (122% in 2025) and Gross Dollar Retention above 96% (96% in 2025), with a footnote explaining that 2024 figures were adjusted for the Ted Baker bankruptcy and some Borderfree merchants.
It has 26 slides: cover and disclaimer, nine slides on the company and platform, a financials section of seven slides, a closing statement, and an eight-slide appendix with definitions and non-GAAP reconciliations, ending on a contact slide.
Highlight only the current period in the accent colour on every chart, add a YoY growth row under bar charts, use house-shaped ascending columns for a growth algorithm, and pair an orange gradient sidebar with a logo wall for 'latest additions'.

Create Your Own Slides
Turn your ideas into professional presentations in seconds with 2slides AI.
Tham khảo thiết kế chuyên nghiệp, chọn phong cách của bạn và tạo slide với kết xuất văn bản hoàn hảo. Được hỗ trợ bởi Nano Banana—bắt đầu tạo trình bày của bạn ngay bây giờ.
Đại Lý AI Của Bạn Cho Slide. Tiết kiệm thời gian, tỏa sáng nhanh hơn với việc tạo bài thuyết trình thông minh.


© 2026 2slides. Bảo lưu mọi quyền.