
Thuộc bộ sưu tập Ví dụ bài thuyết trình cho nhà đầu tư · Mẫu thuyết trình nhà đầu tư Nhật Bản
Denka H1 FY2026 Earnings Presentation — Denka Company Limited (TSE: 4061) results briefing for the first half of the fiscal year ending March 2027, dated 9 November 2026. This is a Japanese-language deck whose original was published on TDnet (Tokyo Stock Exchange Timely Disclosure network). It reports H1 operating profit of ¥24.7 billion (247 億円, +150 YoY) on net sales of 2,087 億円, raises the full-year operating profit forecast to 370 億円 (+70 vs. the initial plan), and covers AI-related low-dielectric resin Snecton, the US chloroprene subsidiary (DPE) shutdown, the spin-off of the styrene business into Nord Chemical, and Mission2030 Phase 2 targets.
Dùng trang bìa của bài trình bày này làm mẫu phong cách cho các slide tạo từ nội dung của bạn. Hoặc chọn bất kỳ trang nào bên dưới để lấy bố cục của trang đó làm tham chiếu.
Điều Hướng Nhanh
Thẻ
Chia sẻ slide
Denka H1 FY2026 Earnings Presentation — Denka Company Limited (TSE: 4061) results briefing for the first half of the fiscal year ending March 2027, dated 9 November 2026. This is a Japanese-language deck whose original was published on TDnet (Tokyo Stock Exchange Timely Disclosure network). It reports H1 operating profit of ¥24.7 billion (247 億円, +150 YoY) on net sales of 2,087 億円, raises the full-year operating profit forecast to 370 億円 (+70 vs. the initial plan), and covers AI-related low-dielectric resin Snecton, the US chloroprene subsidiary (DPE) shutdown, the spin-off of the styrene business into Nord Chemical, and Mission2030 Phase 2 targets.
Xem chi tiết từng trang slide, bao gồm bố cục, nội dung chính và các phần tử trực quan.
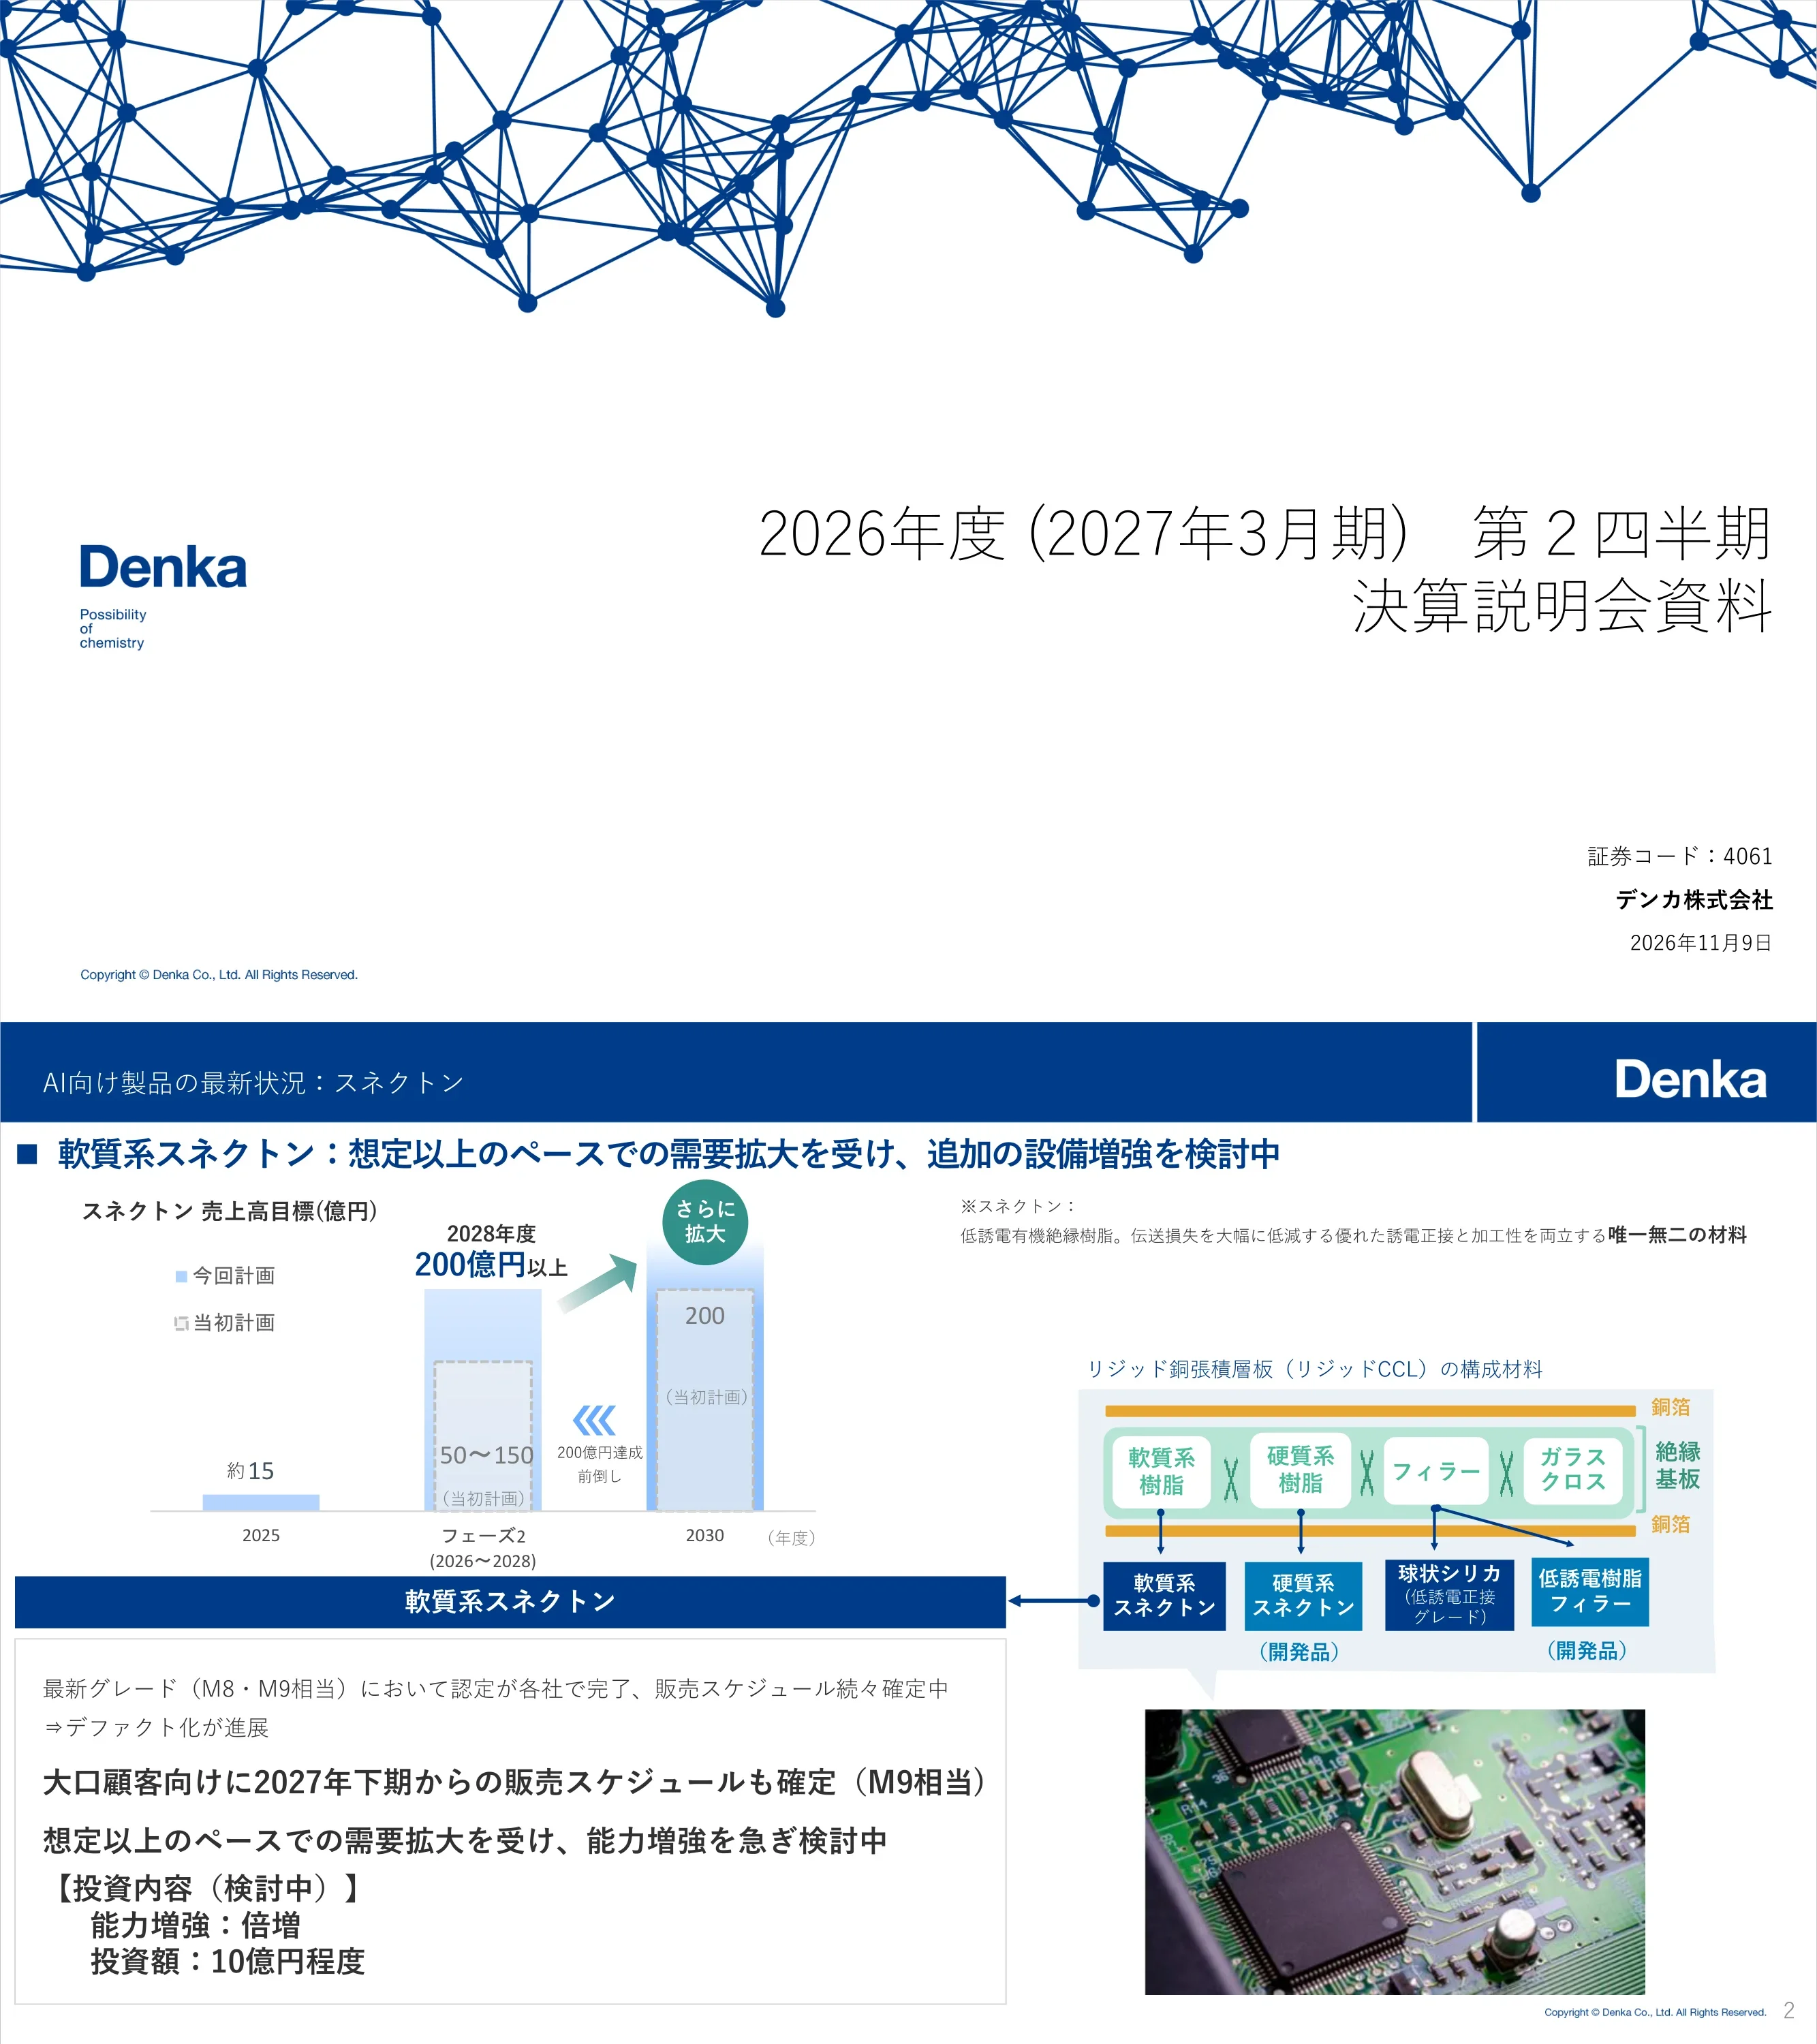
Cover slide for Denka Company Limited's FY2026 second-quarter earnings presentation, securities code 4061, dated 9 November 2026.
Full-width cover with network-graphic banner across the top, Denka logo at left and right-aligned title block with company name and date.
Demand for soft-type Snecton (low-dielectric insulating resin for rigid copper-clad laminates) is growing faster than expected, so the 200 億円 sales target is pulled forward from FY2030 to FY2028 (from about 15 億円 in FY2025; original Phase 2 plan 50–150 億円). Qualification of M8/M9-class grades is complete at multiple customers, sales to a major customer from H2 FY2027 are fixed, and a capacity doubling costing about 10 億円 (¥1 billion) is under consideration.
Left: bar chart of Snecton sales targets (current vs. original plan); right: CCL layer diagram mapping Denka materials; bottom-left text box with qualification and investment details; circuit-board photo.
FY2026 operating profit forecast rises from 300 億円 (initial) to 370 億円 (ROE 5.1%), led by Electronics & Innovative Products (130 → 160). The FY2028 plan stays at 450 億円 operating profit and 8.0% ROE, with Electronics raised from 210 to 260 億円 and Life Innovation cut from 105 to 50 億円 to reflect antigen test kit market conditions.
Left: four stacked bar columns (FY2026 initial vs. current, FY2028 original vs. current) with ROE dotted line; right: table of segment-level change reasons.
Denka is creating Nord Chemical Co., Ltd. (established December 2026) to act as sales agent for styrene monomer, functional resins and sheets from April 2027 and to take over manufacturing and sales from April 2028, with Denka Singapore's functional resin business moving to a Singapore entity from July 2028. The goal is faster decision-making and options such as capital alliances, JVs and an IPO.
Left: purpose bullets and schedule table; right: flow diagram of Denka group styrene businesses with dashed boxes marking Nord Chemical's initial and expanded scope.
The structural measures added 62 億円 to H1 operating profit vs. FY2025 (+30 in Q1, +32 in Q2), while DPE-related extraordinary losses were 91 億円 (47 + 44) for H1, to be offset by gains such as cross-shareholding sales. DPE has completed removal of raw materials and is cutting headcount from about 250 (March 2025) to about 70 (October 2026) and just over 40 from January 2027.
Top: status table (equipment, employees, stakeholders); bottom: quarterly table of operating-profit effect and extraordinary items with arrows showing offset logic.
H1 operating profit was 247 億円 (+150 YoY) and net income 69 億円 (+30), helped by AI and power-infrastructure demand, the +62 DPE shutdown effect and +81 inventory valuation gains. Full-year forecast: operating profit 370 億円 (+70 vs. initial, +108 YoY), net income 160 億円, dividend unchanged at ¥100 per share (total return ratio 54%), with a management briefing scheduled for 15 December.
Four horizontal bands with navy labels at left (H1 results, full-year forecast, shareholder returns, management briefing) and bullet text at right.
Section divider introducing the FY2026 (fiscal year ending March 2027) second-quarter results overview.
Minimal centered title with Denka logo header and thin blue rule.
H1 net sales rose to 2,087 億円 (+120 YoY, +37 vs. August forecast) and operating profit to 247 億円 (+150 YoY, +77 vs. forecast), lifting margin from 5.0% to 11.8%; ordinary profit was 212 億円 and net income 69 億円. Assumptions: ¥160.5/US$ and domestic naphtha ¥107,600/kl.
Financial table comparing H1 FY2025, H1 FY2026 (highlighted column) and the August forecast, with extraordinary items and FX/naphtha rows.
Operating profit bridge from 97 to 247 億円: volume −27, selling price +212, variable cost −160 (spread +52), inventory valuation +81 (Polymer Solutions +51, Elastomers +12), fixed cost −18 and DPE shutdown effect +62. Gains from AI/power-infrastructure products offset weaker antigen test kits, styrene resins and acetylene black.
Waterfall chart across the slide with annotations under each bar explaining drivers and FX effects.
Segment H1 operating profit: Electronics & Innovative Products 83 億円 (+20), Life Innovation 22 (−17), Elastomers & Infrastructure Solutions 57 (+91, from −34) and Polymer Solutions 72 (+57). Segment sales show Polymer Solutions up 113 to 767 億円 on price.
Two stacked tables (net sales and operating profit) with variance columns for volume, price, cost and DPE effect.
Q2 FY2026 net sales were 1,117 億円 (+148 vs. Q1) and operating profit 137 億円 (+27), with Electronics up 10 to 47 億円 and Life Innovation up 17 to 19 億円. The table shows quarterly figures from Q1 FY2024 onward.
Two quarterly trend tables (sales and operating profit) spanning FY2024–FY2026 with a highlighted Q2 column and Q-on-Q change column.
Segment operating profit rose 20 億円 to 83 億円 (volume +3, price +52, cost −35) on AI and power-infrastructure demand, with quarterly profit reaching 47 億円 in Q2 (+10 vs. Q1). Spherical silica and alumina for AI were strong, while acetylene black output was cut due to the Middle East situation even as ESS demand surged.
Left: small waterfall and quarterly bar chart; right: product-by-application matrix with arrow icons for volume, price and cost drivers.
Operating profit fell 17 億円 to 22 億円 (volume −33, cost +16 including R&D savings of 6) as prolonged channel-inventory adjustment cut antigen rapid test kit shipments. Q2 profit recovered to 19 億円 (+17 vs. Q1) as vaccine shipments began and infections increased.
Left: waterfall and quarterly bar chart; right: driver table for influenza vaccine, antigen test kits and clinical reagents.
Operating profit swung from −34 to 57 億円 (+91) on higher Ome-plant chloroprene rubber shipments replacing DPE product, price +35, and the +62 DPE shutdown effect; Q2 profit was 29 億円. A customs-statistics line chart tracks chloroprene export unit prices since 2022.
Left: waterfall and quarterly bars; right: driver table with embedded line chart of export unit price (yen/kg).
Operating profit rose 57 億円 to 72 億円 (volume −16, price +125, cost −103, inventory valuation +51) despite lower styrene resin sales, with Q2 flat vs. Q1 at 36 億円. MS resin for PC-monitor light guides lost share to Chinese products, while Toyokalon production consolidation cut costs.
Left: waterfall and quarterly bars; right: product driver table (MS resin, AS/ABS, food packaging sheets, Toyokalon).
H1 operating profit of 247 億円 beat the August forecast of 170 億円 by 77 (volume +20, price +28, cost +29), with Polymer Solutions +32 and Electronics +23. Net sales of 2,087 億円 exceeded the forecast by 37 億円.
Two tables (sales, operating profit) comparing the August forecast and actual with variance decomposition.
Section divider introducing the full-year FY2026 earnings forecast.
Minimal centered title with Denka logo header.
Full-year forecast revised upward: net sales 4,250 億円 (+408 YoY but −250 vs. initial), operating profit 370 億円 (+108 YoY, +70 vs. initial, margin 8.7%), ordinary profit 260 億円 and net income 160 億円 (unchanged). H2 implies operating profit of 123 億円, with assumptions of ¥158.0/US$ and naphtha ¥89,200/kl for H2.
Wide financial table across H1/H2/full year for FY2025 and FY2026 with highlighted forecast column and a callout showing losses to be offset.
AI-related semiconductor demand and ESS demand are now growing faster than initially assumed, while antigen test demand has worsened due to prolonged channel inventory adjustment. Chloroprene rubber (global demand 230,000 t), xEV and resin markets remain weak and unchanged.
Matrix by segment and market comparing initial vs. current outlook with weather icons from sunny to thunderstorm.
Operating profit bridge from 300 to 370 億円: volume −40, price −92, variable cost +108 (spread +16), inventory valuation +60 (Polymer Solutions +36, Electronics +10, Elastomers +10), fixed cost +35 and DPE effect ±0. Antigen test kits fell sharply but AI/power-infrastructure sales offset the decline.
Full-width waterfall chart with annotations under each driver bar.
Revised segment operating profit: Electronics 160 億円 (+30), Life Innovation 35 (−25), Elastomers 80 (+10) and Polymer Solutions 75 (+55), totaling 370 億円. Net sales were cut by 250 to 4,250 億円, mainly Polymer Solutions (1,700 → 1,500).
Two tables (sales, operating profit) comparing initial and current forecasts with variance decomposition columns.
Segment sales are expected to reach 1,170 億円 (vs. 1,100 initial and 1,044 in FY2025), with AI-related plus power-infrastructure applications rising to 25% of sales, up from 11% in FY2023, 15% in FY2024 and 21% in FY2025.
Stacked bar chart of five years by application (general semiconductors, automotive, xEV, power infrastructure, AI, other) with bracketed share labels.
Segment operating profit forecast raised by 30 億円 to 160 億円 (volume +8, price +12, cost +9 including inventory +10). Spherical silica and alumina for AI exceed plan and ESS acetylene black demand is well above plan, while Snecton AI sales ramp in H2 as planned; profit history runs from 142 億円 (FY2020) to 139 億円 (FY2025).
Left: waterfall and eight-year operating profit bar chart; right: product-by-application driver matrix with arrow icons.
Segment sales are now forecast at 400 億円 vs. 450 億円 initially (FY2023 471, FY2024 433, FY2025 405), as antigen rapid test kit sales shrink while clinical reagents (including Kainos) grow.
Stacked bar chart of sales by application (vaccines, antigen test kits, clinical reagents, hyaluronic acid) with dotted lines comparing initial and revised forecasts.
Operating profit forecast cut by 25 億円 to 35 億円 (volume −48, price +3, cost +21 including R&D savings of 5) because antigen test kit shipments fall far short of plan. Segment profit has declined from 155 億円 in FY2021 to 62 億円 in FY2025.
Left: waterfall and eight-year profit bars; right: driver table for vaccines, test kits and clinical reagents.
Operating profit forecast raised by 10 億円 to 80 億円, driven by inventory valuation +10 and depreciation savings, while special admixture volumes fall short due to construction delays. The segment recovers from losses of −93 (FY2023) and −80 億円 (FY2024) to 1 億円 in FY2025.
Left: waterfall and historical profit bars (negative values below axis); right: driver table for chloroprene rubber and special admixtures.
Operating profit forecast raised by 55 億円 to 75 億円 (volume +3, price −111, cost +126, inventory +36) as raw material prices came in below assumptions while styrene spreads were maintained. AS/ABS and Toyokalon shipments rose because Middle East impacts were milder than feared.
Left: waterfall and historical profit bars; right: product driver table with arrow icons.
H1 capex and investment totaled 288 億円 (vs. 191), with the full-year plan of 470 億円 unchanged. Full-year depreciation is trimmed to 315 億円 (from 320) and R&D to 155 億円 (from 160).
Single wide table with three column groups (capex/investment, depreciation, R&D), each showing H1 YoY and full-year initial vs. current.
Denka keeps the dividend at ¥100 per share (interim ¥50, year-end ¥50; total 86 億円), a 54% payout and total return ratio on forecast net income of 160 億円. Forecast ROIC is 5.6%, ROE 5.1%, DOE 2.7%, interest-bearing debt 2,450 億円 and net D/E 0.69x.
Eight-year table (FY2020–FY2026 revised) of net income, dividends, payout, buybacks, depreciation, capex, debt and return metrics, with highlighted current forecast column.
FY2026 forecast vs. FY2025 actual: net sales +408 to 4,250 億円 (price +423) and operating profit +108 to 370 億円, with Elastomers up 79 to 80 億円 and Polymer Solutions up 39 to 75 億円. Life Innovation falls 27 to 35 億円.
Two tables (sales, operating profit) with variance decomposition columns including DPE shutdown effect.
Quarterly segment sales and operating profit from Q1 FY2024 through Q2 FY2026 plus the H2 FY2026 forecast: H2 sales of 2,163 億円 and operating profit of 123 億円, after 110 and 137 億円 in Q1 and Q2.
Two quarterly grids (sales, operating profit) across FY2024, FY2025 and FY2026 (Q1, Q2, H2 forecast).
Consolidated ROIC is forecast to recover to 5.6% in FY2026 from 2.5% in FY2023–FY2024, with operating profit bars rising from 134 億円 (FY2023) to 370 億円. Polymer Solutions ROIC reaches 7.4%, Electronics and Elastomers 5.7%, and Life Innovation falls to 4.0%.
Combination chart: grey operating-profit bars on the right axis with segment ROIC lines on the left axis, FY2019–FY2026.
Disclaimer that forward-looking statements are based on currently available information and certain assumptions, involve risks and uncertainties, and that actual results may differ.
Centered title, subtitle and short paragraph on a white background.
Closing slide with Denka's slogan and contact details for the Corporate Communications Department: TEL 03-5290-5511, https://www.denka.co.jp.
Centered closing layout with tagline, large Denka logo, department name and contact rows.
Các câu hỏi phổ biến về slide này và nội dung trình bày cơ bản.
The original is a Japanese-language 決算説明会資料 (earnings briefing material) released by Denka Company Limited on 9 November 2026 via TDnet, the Tokyo Stock Exchange's Timely Disclosure network. The slide titles, figures and summaries on this page are English translations of that source.
Denka's fiscal year runs from April to March, so FY2026 is the fiscal year ending March 2027. H1 (the first half, reported as the second quarter cumulative) covers April to September 2026, and H2 covers October 2026 to March 2027.
Net sales were 2,087 億円 (¥100 million units), up 120; operating profit was 247 億円, up 150, with the margin rising to 11.8%; ordinary profit was 212 億円; and net income was 69 億円, up 30, after 91 億円 of DPE-related extraordinary losses.
Operating profit was raised from 300 to 370 億円 on AI-related and power-infrastructure demand plus inventory valuation gains, even though net sales were cut from 4,500 to 4,250 億円 and Life Innovation was revised down. Net income stays at 160 億円 and the dividend at ¥100 per share.
Snecton is Denka's low-dielectric organic insulating resin for rigid copper-clad laminates used in AI-server boards. Demand is outpacing plans, so Denka pulled its 200 億円 sales target forward to FY2028 and is considering doubling capacity for about 10 億円.
DPE, the US chloroprene rubber subsidiary, is in a temporary shutdown that added 62 億円 to H1 operating profit but generated 91 億円 of extraordinary losses. Separately, the styrene-related business is being moved into a new company, Nord Chemical, which starts as a sales agent in April 2027 and takes over manufacturing and sales in April 2028.
Yes, as a structural reference: it shows a summary page, YoY and vs.-forecast waterfall bridges, segment deep dives with arrow-icon driver tables, a weather-icon market outlook, and appendix KPI tables. The financial content is Denka's own disclosure and should be replaced with your company's data.

Create Your Own Slides
Turn your ideas into professional presentations in seconds with 2slides AI.
Tham khảo thiết kế chuyên nghiệp, chọn phong cách của bạn và tạo slide với kết xuất văn bản hoàn hảo. Được hỗ trợ bởi Nano Banana—bắt đầu tạo trình bày của bạn ngay bây giờ.
Đại Lý AI Của Bạn Cho Slide. Tiết kiệm thời gian, tỏa sáng nhanh hơn với việc tạo bài thuyết trình thông minh.


© 2026 2slides. Bảo lưu mọi quyền.