
Thuộc bộ sưu tập Ví dụ bài thuyết trình cho nhà đầu tư · Mẫu thuyết trình nhà đầu tư Nhật Bản
CyberAgent FY2026 Earnings Presentation is the Japanese-language full-year results deck (決算説明会資料) for the fiscal year October 2025 to September 2026, released on TDnet, the Tokyo Stock Exchange timely-disclosure service, on 11 November 2026. It covers group results, a ¥12 billion (120億円) buyback, the FY2027 outlook and segment reviews of Media & IP, Internet Advertising and Games.
Dùng trang bìa của bài trình bày này làm mẫu phong cách cho các slide tạo từ nội dung của bạn. Hoặc chọn bất kỳ trang nào bên dưới để lấy bố cục của trang đó làm tham chiếu.
Điều Hướng Nhanh
Thẻ
Chia sẻ slide
CyberAgent FY2026 Earnings Presentation is the Japanese-language full-year results deck (決算説明会資料) for the fiscal year October 2025 to September 2026, released on TDnet, the Tokyo Stock Exchange timely-disclosure service, on 11 November 2026. It covers group results, a ¥12 billion (120億円) buyback, the FY2027 outlook and segment reviews of Media & IP, Internet Advertising and Games.
Xem chi tiết từng trang slide, bao gồm bố cục, nội dung chính và các phần tử trực quan.
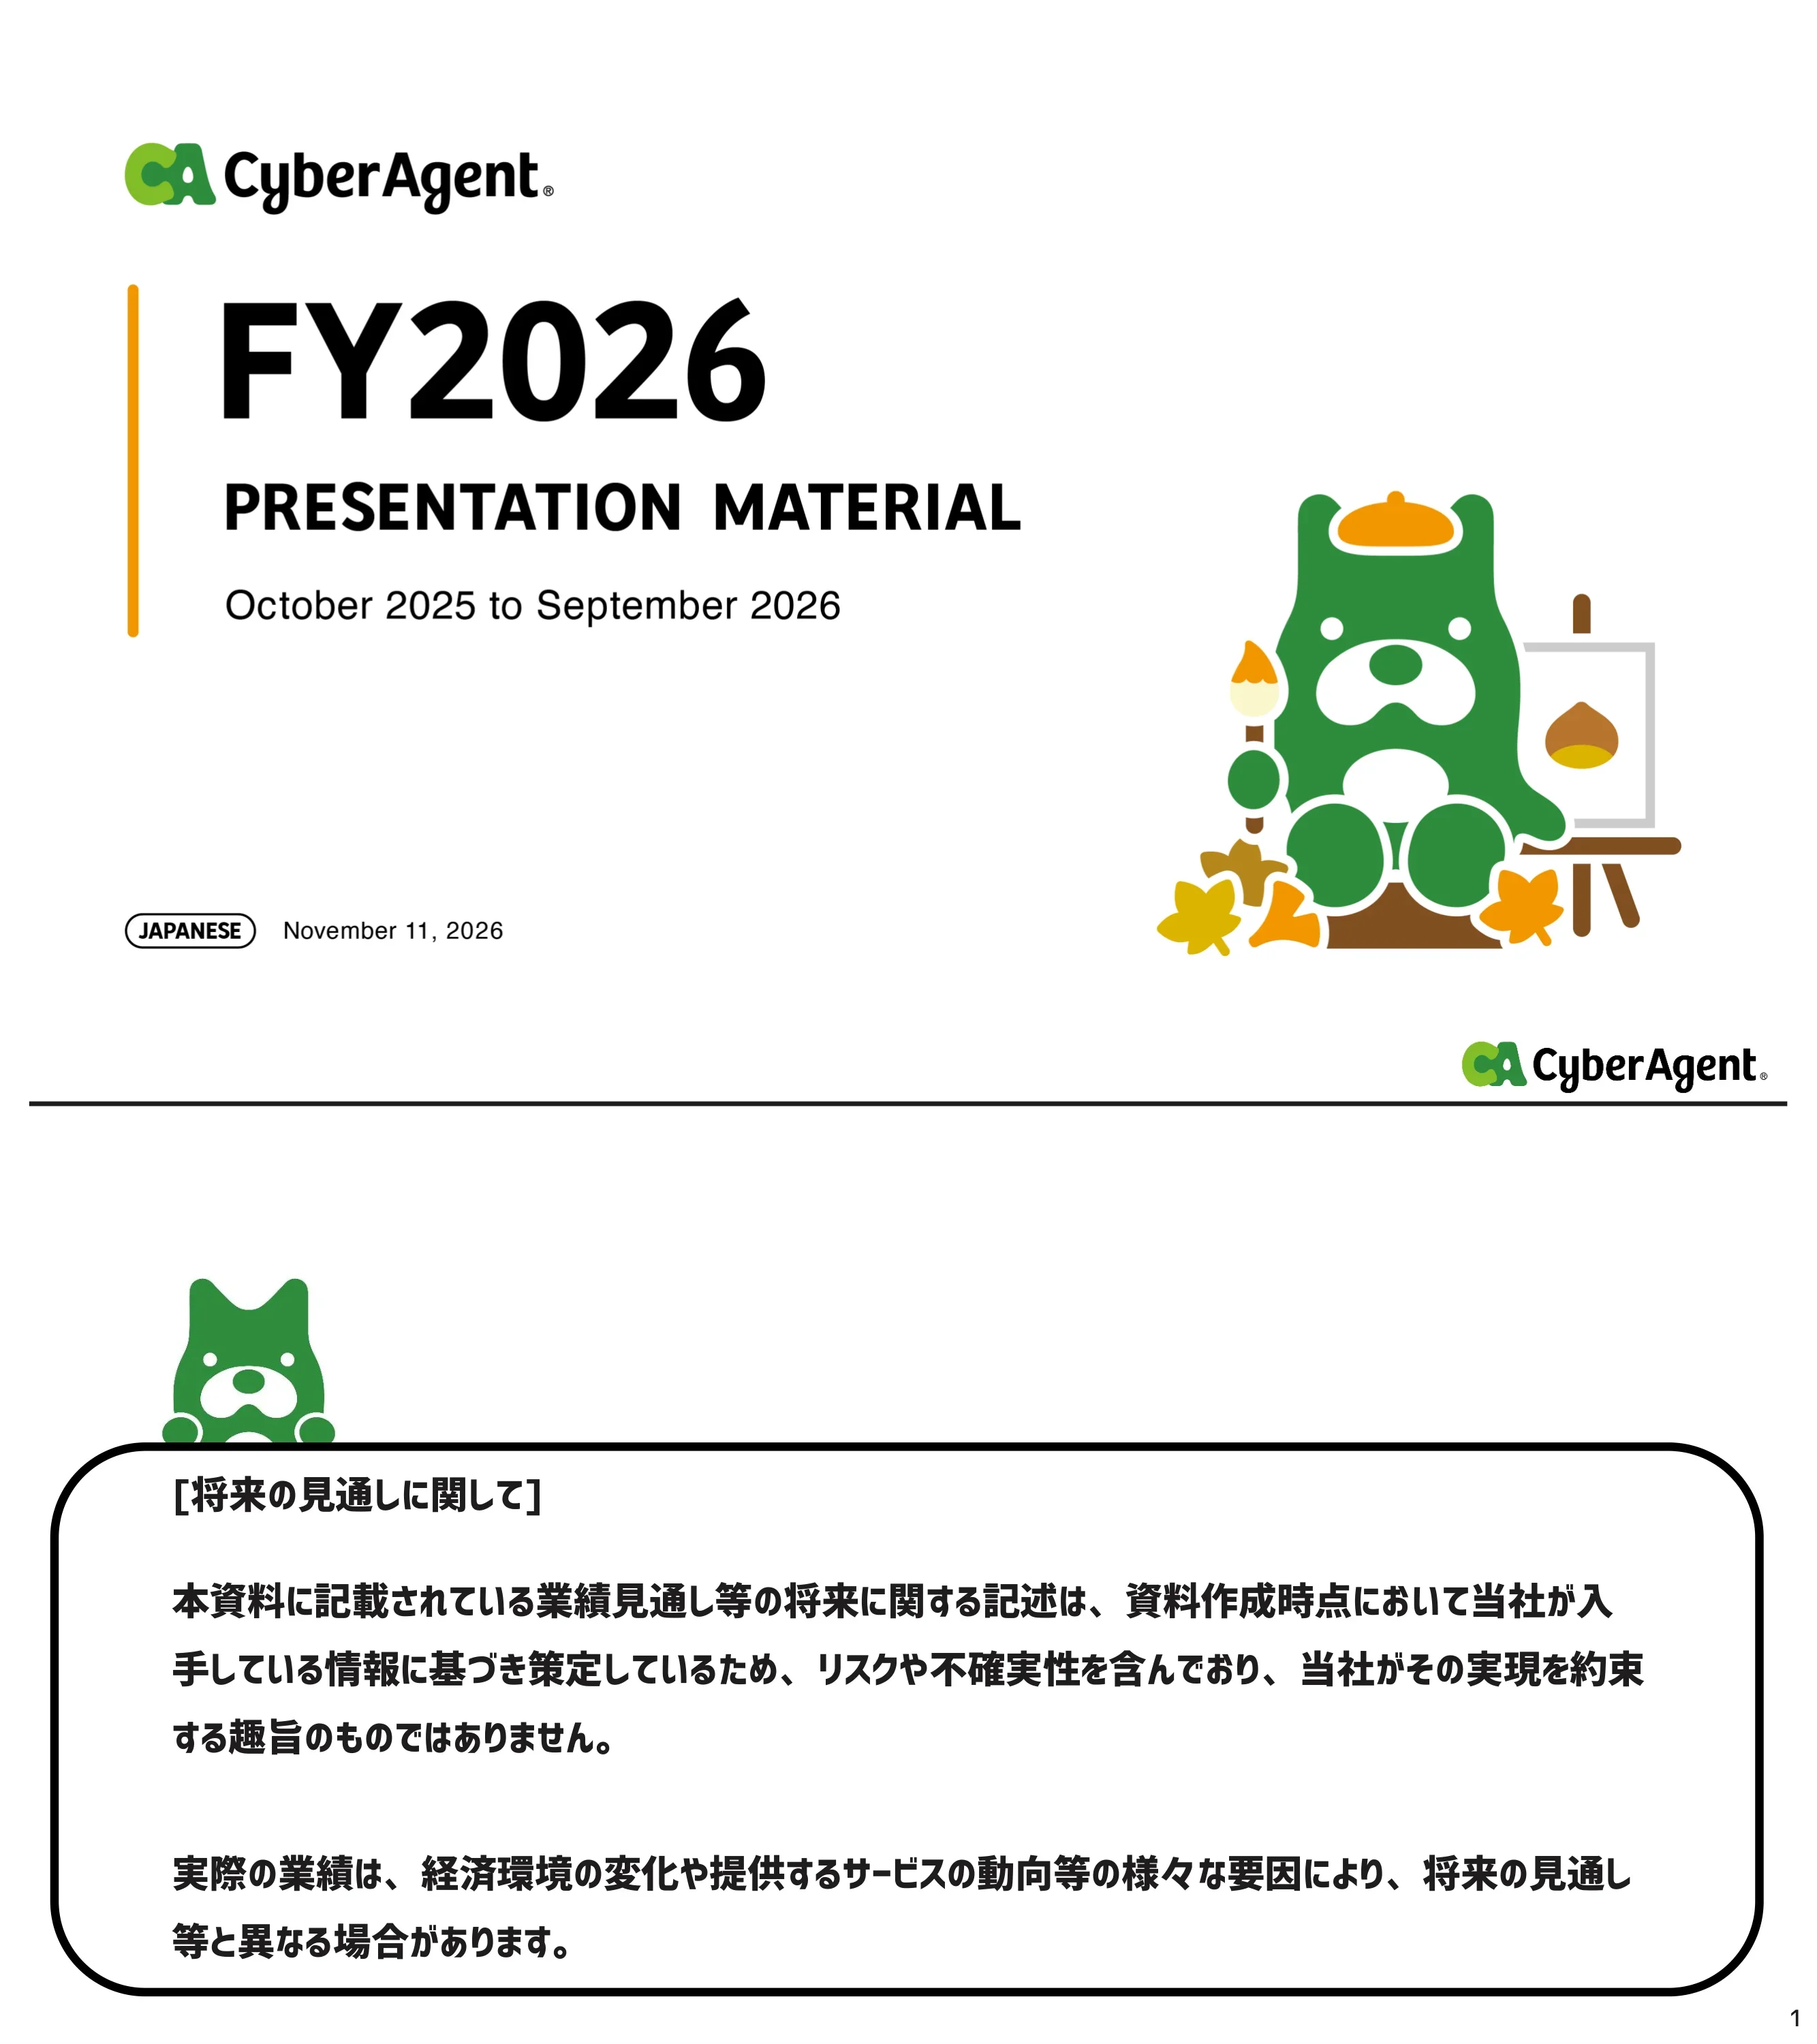
Cover of CyberAgent's full-year earnings deck for the fiscal year October 2025 to September 2026, marked as the Japanese-language version and dated November 11, 2026.
Left-aligned large 'FY2026' title with an orange vertical accent bar, subtitle and period below, language tag and date at bottom left, mascot illustration at bottom right.
Standard disclaimer: forecasts in the document are based on information available when it was prepared, contain risks and uncertainties, and are not a promise of results. Actual results may differ because of changes in the economy and in service trends.
Rounded black-outlined text box with the mascot peeking over its top edge; logo and rule at top.
Agenda in nine parts: full-year results (Oct 2025 to Sep 2026), thinking behind the forecast, share buyback and management metrics, FY2027 outlook, Media & IP, Internet Advertising, Games, medium- to long-term strategy, and reference material with quarterly results (Jul to Sep 2026).
Numbered vertical list centered on a white page with the standard header rule and logo.
Divider for section 1, full-year results for the period October 2025 to September 2026.
Centered large bold Japanese heading with the period in parentheses beneath it.
FY2026 was the company's 29th consecutive year of revenue growth, well above the initial forecast. Group sales were 9,706 (100 million yen units, 億円), +11.1% YoY, and operating profit 772, +7.7%. Media & IP: sales 2,500 (+8.0%), operating profit 148 (2.0x, helped by AbemaTV turning profitable excluding special incentives). Advertising: sales 4,876 (+5.7%, record), operating profit 185 (+5.2%). Games: sales 2,773 (+28.0%), operating profit 600 (-0.1%).
Four horizontal color-coded banners (green group, light green Media & IP, blue Advertising, orange Games), each with a headline on the left and sales and profit with YoY on the right.
Bar chart of consolidated sales from FY2000 (32) to FY2026 (9,706), in 100 million yen. FY2026 is highlighted in green with a +11.1% YoY call-out and the message that revenue has grown for 29 years since founding. Recent values include 8,740 for FY2025, 8,012 for FY2024 and 7,194 for FY2023.
Long 27-bar column chart rising to the right with the final bar in green, big headline and KPI text at upper left.
Operating profit bars from FY2000 (-16) to FY2026 (772). FY2023 (223) was the trough and profit has risen for three straight years: 400 in FY2024, 717 in FY2025 and 772 in FY2026 (+7.7%). The FY2021 peak of 1,040 is drawn with a broken bar; FY2022 was 675.
Column chart with negative early bars, a truncated FY2021 bar, and FY2023 to FY2026 highlighted in green with a red rising arrow.
Selling, general and administrative expenses reached 2,154 in FY2026 (+12.0% YoY), including a special incentive payment of 32. FY2026 breakdown: advertising 749, personnel 577, system-related 126, office 116, R&D 71, other 481. Totals for earlier years: 1,509 (FY2022), 1,692, 1,786, 1,923 (FY2025).
Five stacked columns (FY2022 to FY2026) with a color legend at left and a headline about the special incentive.
Consolidated headcount was 8,864 at FY2026 year end, up 580 YoY including 402 new graduates. By segment: Media & IP 2,355, Internet Advertising 2,690, Games 3,252, corporate functions 556, investment development 11. FY2022 was 6,472, FY2025 8,284.
Stacked column chart for five fiscal years with legend and a left-side headline and total.
Net income attributable to owners of the parent was 430 (43,001 million yen, +35.8%), a record high. Sales 970,618 million yen (+11.1%), gross profit 292,665 (+10.8%), SG&A 215,416 (+12.0%), operating profit 77,249 (+7.7%), operating margin 8.0% (-0.2pt), ordinary profit 78,884 (+10.0%), special gains 1,624, special losses 3,909, pre-tax profit 76,599 (+15.7%).
Green-headed table with FY2026 column emphasized next to FY2025 and YoY columns; unit stated as millions of yen.
Total assets 595,826 million yen (+6.9%), current assets 414,937, cash and deposits 234,222, fixed assets 180,860, current liabilities 189,304, fixed liabilities 106,458, shareholders' equity 200,592 (+20.6%), net assets 300,063 (+8.8%). Reference net cash was 135,605 versus 134,811.
Table with September 2026 column highlighted beside September 2025 and YoY; footnote defines net cash.
Divider for the section on how the company approaches its earnings guidance.
Black rounded pill with a green glowing dot and white heading on a grey background.
Sales rose from 7,194 (FY2023) to 8,012 (FY2024), 8,740 (FY2025) and 9,706 (FY2026), in 100 million yen. The message is three consecutive years of solid revenue growth.
Large rounded white text card on the left, four-bar chart on the right with an upward green arrow and the FY2026 bar in green.
Operating profit climbed from 223 (FY2023) to 400, 717 and 772 (FY2026), in 100 million yen, framed as three years of continued profit growth.
Same card-plus-chart layout as the sales slide, with a steeper arrow and green FY2026 bar.
ROE for FY2026 was 22.0%, up from 2.5% in FY2023, 10.8% in FY2024 and 18.9% in FY2025. A dashed line marks the Tokyo Stock Exchange Prime market average of 9.2% (2025 results, 1,430 companies, per TSE summary).
Left card with giant 'ROE 22%' text; right bar chart with a dashed benchmark line and a speech-bubble label.
The company says its PER was 15x as of September 30, 2026, and describes this as low relative to its results. A line chart of the share price from 2000 to 2026 shows peaks around 2021 and 2025, with a dashed line and green dot marking the current level.
Left card with large '15x' and message; right area chart of share price with y-axis 0 to 2,500 yen.
Management explains that game results are hard to forecast even internally. Initial operating profit forecasts versus actuals (100 million yen): FY2024 300 vs 400, FY2025 420 vs 717, FY2026 500 to 600 vs 772. The conclusion is to build track record over the years to understand game hit rates and longevity.
Left side has a cause box, a down arrow and a conclusion box; right side shows paired forecast/actual bars for three years with upward arrows.
The company cites an 88% hit rate for large smartphone games, defined in the footnote as 7 titles with monthly sales above 1 billion yen out of 8 titles with development cost above 1 billion yen since Uma Musume Pretty Derby. Artwork from Uma Musume, Gakuen Idolmaster, Shadowverse: Worlds Beyond, Final Fantasy VII Ever Crisis, Jujutsu Kaisen Phantom Parade, SD Gundam G Generation Eternal and hololive Dreams is shown.
Giant '88%' card at left and a mosaic of seven game key visuals at right and bottom.
The company lists 7 new large smartphone games planned through FY2030 (development cost of 1 billion yen or more, excluding casual and console games, as of November 11, 2026). A bar chart of game sales shows existing titles and dashed placeholder slots for New 1 to New 7 in the coming years.
Left card with giant '7' and right chart of game segment sales bars with app icons and green 'New' tags.
Divider for the section on share repurchases and management indicators.
Black pill banner with white heading on grey.
The board authorized a share repurchase of 120 (100 million yen), i.e. 12 billion yen. The acquisition period runs from November 12, 2026 to January 29, 2027, ending earlier if the total value or share-count limit is reached first.
Single large white card with the amount and a green 'share buyback' pill, with the period in a banner below.
The company aims to keep ROE at about 20% as a guide, excluding special factors such as extraordinary losses. The chart repeats ROE of 2.5%, 10.8%, 18.9% and 22.0% for FY2023 to FY2026 against the TSE Prime average of 9.2%, with a green line at the 20% level.
Left card with 'ROE 20%' text and right ROE bar chart with a green target line.
The dividend policy of a 5% dividend on equity (DOE) continues. Per-share dividends were 8 yen in FY2017 and FY2018, rising to 17 yen in FY2025, 20 yen in FY2026 (forecast) and 22 yen planned for FY2027. Total dividends grow from 40 to 101 in FY2026 and 111 in FY2027 (100 million yen).
Bars for total dividends with a green line for per-share dividend; right-hand card spotlights the FY2027 forecast of 22 yen with an 'increase' pill.
Divider for the section on the FY2027 results outlook.
Black pill banner with white heading on grey.
Headline guidance: sales of 1.07 trillion yen (1兆700億円, i.e. 10,700 in 100 million yen units) and operating profit of 66 billion yen (660).
Two white cards on grey, each with a green label and a huge number.
FY2027 forecast versus FY2026 (100 million yen): sales 10,700 vs 9,706 (+10.2%), operating profit 660 vs 772 (-14.6%), ordinary profit 660 vs 788 (-16.3%), net income attributable to parent 350 vs 430 (-18.6%).
Table with the FY2027 forecast column in a green rounded highlight next to FY2026 and YoY.
Divider for the Media & IP segment section.
Large centered heading on white page with header rule and logo.
Media & IP sales were 2,500 in FY2026 (+8.0%), up from 2,315 in FY2025, 2,001 in FY2024, 1,684 in FY2023 and 1,364 in FY2022 (100 million yen), described as layered revenue build-up.
Five green columns with a red YoY call-out and a headline on the left.
Segment operating profit reached 148 (2.0x), from -132 in FY2022, -125, -14 and 72 in FY2025. The company attributes the doubling to AbemaTV turning profitable, excluding special incentives.
Column chart crossing a zero baseline with negative bars below, headline on the left.
AbemaTV sales were 671 (+15.4%) and operating profit +2 for FY2026, its first full-year operating profit since the channel launched about ten years ago (excluding special incentives). Sales rose from 0 in FY2015 and losses peaked at -190 in FY2017; FY2023 loss was -161 with the FIFA World Cup broadcast.
Black panel with yellow sales bars above the axis and grey loss bars below, with call-outs for launch, World Cup and profit.
Original shows such as romance reality, drama and variety are performing well, and quality has earned nominations in 10 categories at overseas awards (as of October 2026).
Dense poster mosaic of ABEMA original program key art under a two-line headline.
ABEMA recorded 3,000万 (30 million) weekly active users, up 12.0% YoY, comparing the average WAU of Jul to Sep weeks in 2026 and 2025. The long-term chart runs 2016 to 2026 with a spike at the FIFA World Cup broadcast.
Black panel with a yellow area chart, y-axis in 10,000 users, key-art thumbnails and a red circled call-out.
CyberAgent has signed a partnership with MAPPA and invested in its parent MHD. The companies will consider collaboration across anime planning and production, broadcast and distribution, games, merchandise and events.
Two equal logo boxes (CyberAgent and MAPPA) with a headline above and description below.
The IP business is expanding through anime production, business partnerships and global marketing. Three anime studios (Cypic, Studio Kurm, CA Soa) are shown with titles including Chiikawa film, Kagurabachi (TV anime from April 2027), Shin Samurai Den YAIBA (from January 9, 2027) and Sosou Kyoshitsu; MAPPA is listed under partnerships and Anime Expo World Tour under global marketing.
Three panels: studios with posters, business partnership, and a world map for global marketing.
The slide features key art for Kagurabachi, announced as a TV anime to start broadcasting in April 2027, and states the FY2027 goal of cultivating and maximizing IP with the whole group.
Left text block and a full-bleed manga key visual at right.
Three-stage flow: IP creation (original works and manga, anime studios), diffusion (ABEMA streaming and advertising tie-ups), and monetization (events and merchandise, global, games). Logos from group companies fill each box.
Three black-headed columns joined by grey arrows, filled with logos.
Divider for the Internet Advertising segment.
Large centered heading on white page.
Segment sales set a record at 4,876 (+5.7%), up from 4,612 in FY2025, 4,346, 4,045 and 3,670 in FY2022 (the FY2022 figure excludes the formerly consolidated MicroAd).
Five blue columns with a red YoY call-out and a footnote.
Operating profit grew to 185 (+5.2%) while the company continued investing in AI. Prior values: 237 (FY2022), 174, 204, 176.
Five blue columns, headline at left, red YoY badge.
The company sees AI advances and changing consumer behavior as a turning point and has organized specialist units: an AI Search Marketing division (new June 2026), a Next division for trend media (new June 2026), a center pursuing Japan's best AI video, and CyberGrip for performance-based models. The aim is maximum customer satisfaction and value.
Left box of two change drivers, right box of four focus areas and matching organizations, with a gray arrow to a bottom conclusion.
Competitive strengths are sales force and scale (about 1,400 advertisers, 2025 results) and AI technology from CyberAgent AI Lab (Japanese LLMs and VLM). In-house AI agents include the Kiwami series (creative production), screening AI, CA-GAS (search ad account structure, new), Kouka Omakase AI (ad delivery operation, new) and CA Assistant (PDCA support).
Three stacked bands: competitive advantages, five AI agent boxes, and a blue result banner, linked by arrows.
Divider for the Games segment.
Large centered heading on white page.
Game sales surged to 2,773 (+28.0%) on strong flagship titles, overseas expansion and a hit new title. Prior years: 2,283 (FY2022), 1,791, 1,959, 2,167. Overseas share of sales rose from 4.8% to 5.1%, 10.3%, 15.5% and 28.1% in FY2026.
Stacked domestic/overseas columns with a grey ratio line and a red YoY badge.
Operating profit was 600, flat versus 600 in FY2025 and better than the company's expectation of a decline. History: 605 (FY2022), 227, 305.
Five orange columns with headline at left.
hololive Dreams was released worldwide on July 23 (some regions excluded) on smartphone and Steam, and ranked 6th on average in the App Store domestic game sales ranking in its first month (July 23 to August 22, 2026).
Large collage key art with the game logo at center and footnotes.
Timeline showing years of revenue contribution as of November 11, 2026: Granblue Fantasy 12 years, Shadowverse 10, Princess Connect Re:Dive 8, Project Sekai 6, Uma Musume 5, Jujutsu Kaisen Phantom Parade 2, Gakuen Idolmaster 2, SD Gundam G Generation Eternal 1, plus Shadowverse: Worlds Beyond and hololive Dreams.
Staircase of horizontal arrows from 2014 to 2026 with app icons and years of operation labels.
Game segment sales are charted from FY2014 (507) to FY2026 (2,773), with a peak of 2,627 in FY2021. Seven new large titles are planned: one each in FY2027 and FY2029 and two in FY2028 and three in FY2030, per the colored placeholders.
Column chart with app icons on bars and dashed future columns holding colored New tags.
Divider for the strategy section.
Large centered heading on white page.
Venn diagram of the group's strengths: ABEMA as customer acquisition engine (about 30 million WAU), games as monetization (No. 1 smartphone games in Japan, per the company's 3Q FY2026 comparison of public information), and advertising as marketing (top-class internet advertising in Japan), overlapping on IP.
Three overlapping circles (black, orange, blue) around a green IP center.
CyberAgent logo with the statement that it aims to be a company supported over the medium to long term.
Centered logo and single line of text.
Divider for reference material containing quarterly results for July to September 2026.
Large heading with a bullet line on white page.
4Q sales were 2,613 (100 million yen), +8.0% YoY versus 2,420. Quarterly series from FY2022 1Q (1,709) to FY2026 shows steady growth, e.g. FY2026 1Q 2,323, 2Q 2,462, 3Q 2,306.
Twenty quarterly columns grouped by fiscal year, with 4Q bars in green and a red YoY label.
4Q operating profit was 97, down 57.2% YoY from 229. FY2026 quarters: 233, 290, 149, 97. The chart reaches back to FY2022 and includes one loss quarter (-17 in FY2023 1Q).
Twenty columns with a zero baseline and green 4Q bars.
4Q SG&A was 627 (+8.5%), including a special incentive of 32; 4Q advertising 206, personnel 171, other 129. Earlier FY2026 quarters: 515, 508, 501.
Stacked quarterly columns with legend and the 4Q total highlighted.
Headcount at the end of September was 8,864, +580 YoY. Quarterly totals rose from 5,815 in FY2022 1Q; FY2026 quarters were 8,264, 8,267, 8,878 and 8,864.
Twenty stacked columns by segment with legend.
4Q: sales 261,345 million yen (+8.0% YoY, +13.3% QoQ), gross profit 72,579 (-10.1%), SG&A 62,779 (+8.5%), operating profit 9,799 (-57.2%), margin 3.7% (-5.7pt), ordinary profit 9,701, net income attributable to parent 6,966 (-7.9%).
Table comparing 4Q FY2026 with 4Q FY2025, YoY, 3Q FY2026 and QoQ.
At end of September 2026: total assets 595,826 million yen versus 551,172 at end of June 2026; cash and deposits 234,222; net assets 300,063; net cash 135,605 versus 113,401 at end of June.
Table with September 2026, September 2025, YoY, June 2026 and QoQ columns.
Promotes the LINE official account 'CyberAgent IR News' (ID @cyberagent_ir) with a QR code and says the FY2027 1Q results are scheduled for February 5, 2027 at 15:30 or later.
Left text and a QR code at right, a green notice line at the bottom.
Credits for artwork used on slides 17, 18, 33, 45 and 46, including Cygames, Bandai Namco, Square Enix, COVER, QualiArts, Sumzap and anime production committees. Text is small but largely legible.
Four rounded boxes of numbered credit lists.
Các câu hỏi phổ biến về slide này và nội dung trình bày cơ bản.
It is CyberAgent's FY2026 full-year earnings presentation (決算説明会資料), written in Japanese, covering October 2025 to September 2026. It was released on TDnet, the Tokyo Stock Exchange timely-disclosure service, on 11 November 2026. Titles and key figures are summarised here in English.
Sales were 9,706 (100 million yen), up 11.1%, operating profit 772 (+7.7%) and net income attributable to owners of the parent 430 (+35.8%), a record. ROE was 22.0%.
The deck forecasts sales of 10,700, operating profit of 660 (-14.6%), ordinary profit of 660 and net income of 350, all in 100 million yen.
Media & IP sales 2,500 and operating profit 148; Internet Advertising sales 4,876 and operating profit 185; Games sales 2,773 and operating profit 600, all in 100 million yen.
A share buyback of 120 (100 million yen) between 12 November 2026 and 29 January 2027, a continued DOE 5% policy, and a planned dividend of 22 yen per share for FY2027.
The first half uses classic header-rule slides with tables and bar charts; the middle section uses grey slides with black pill labels, white cards and giant numbers for single messages. Segment sections open with plain full-page dividers.
Yes. The reference section gives quarterly sales, operating profit, SG&A and headcount from FY2022 to FY2026, plus a 4Q income statement and balance sheet.
Most are, but the copyright credit page at the end is small print and some footnotes are tiny at this resolution.

Create Your Own Slides
Turn your ideas into professional presentations in seconds with 2slides AI.
Tham khảo thiết kế chuyên nghiệp, chọn phong cách của bạn và tạo slide với kết xuất văn bản hoàn hảo. Được hỗ trợ bởi Nano Banana—bắt đầu tạo trình bày của bạn ngay bây giờ.
Đại Lý AI Của Bạn Cho Slide. Tiết kiệm thời gian, tỏa sáng nhanh hơn với việc tạo bài thuyết trình thông minh.


© 2026 2slides. Bảo lưu mọi quyền.