
Thuộc bộ sưu tập Ví dụ bài thuyết trình cho nhà đầu tư · Ví dụ bài thuyết trình thương mại điện tử
Commerce (formerly BigCommerce) Q2 2026 Earnings Presentation — a 37-slide investor deck that recasts the company as a three-brand agentic commerce stack (Feedonomics data, BigCommerce engine, Makeswift experience) and reports $361M ARR, $84.5M quarterly revenue, $8.8B quarterly GMV, 95.8% net revenue retention, a 9.6% non-GAAP operating margin and Q3/FY2026 guidance.
Điều Hướng Nhanh
Thẻ
Chia sẻ slide
Commerce (formerly BigCommerce) Q2 2026 Earnings Presentation — a 37-slide investor deck that recasts the company as a three-brand agentic commerce stack (Feedonomics data, BigCommerce engine, Makeswift experience) and reports $361M ARR, $84.5M quarterly revenue, $8.8B quarterly GMV, 95.8% net revenue retention, a 9.6% non-GAAP operating margin and Q3/FY2026 guidance.
Xem chi tiết từng trang slide, bao gồm bố cục, nội dung chính và các phần tử trực quan.
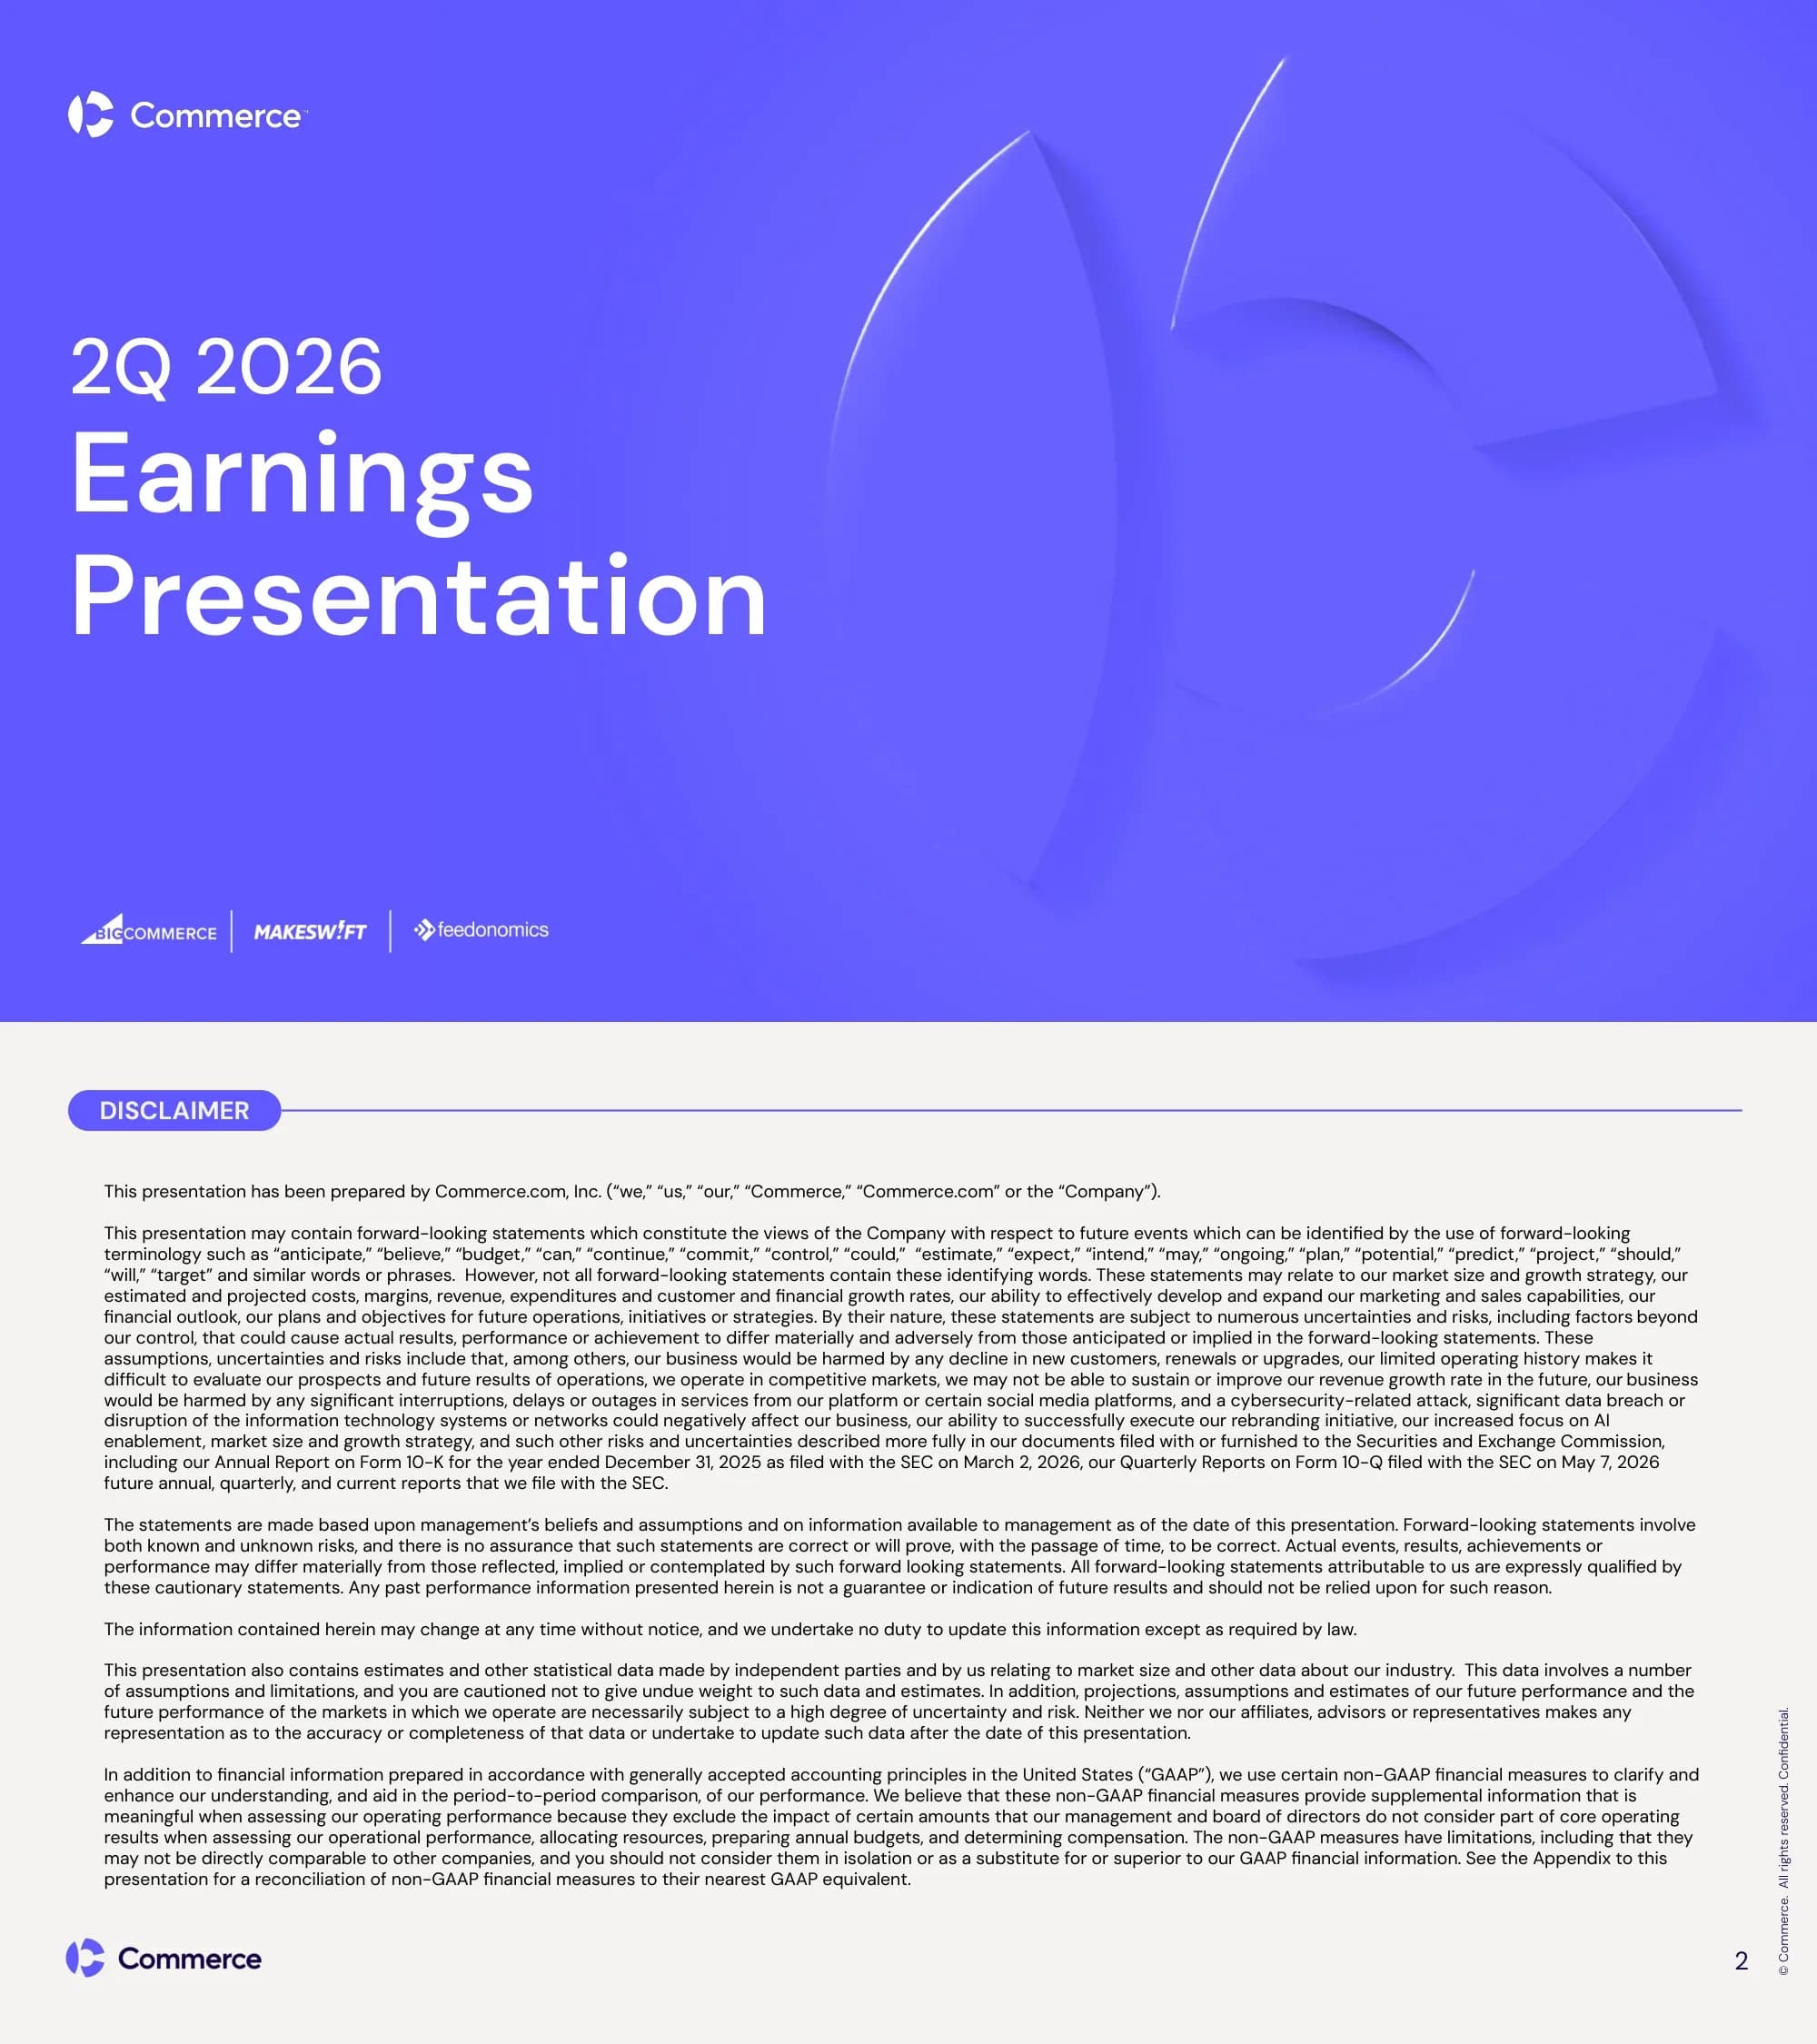
Cover slide introducing Commerce's second-quarter 2026 earnings presentation, with the Commerce logo at top and the BigCommerce, Makeswift and Feedonomics brand marks along the bottom.
Full-bleed periwinkle background, left-aligned large white title stack, oversized embossed 'C' logo sculpture filling the right half, brand-family logo strip bottom left.
Forward-looking statements and non-GAAP disclaimer from Commerce.com, Inc., citing risks such as competition, AI enablement, the rebranding initiative and SEC filings (10-K filed March 2, 2026; 10-Q filed May 7, 2026), and explaining the use of non-GAAP measures.
Light background with a pill-shaped 'DISCLAIMER' section tag and rule line, dense full-width body text in several paragraphs, logo and page number in the footer.
Section divider opening the company overview part of the deck.
Pale grey-lavender background with soft abstract 3D logo shapes, single headline left-center with a lime highlighter band behind the text.
Vision: powering an open, intelligent ecosystem for next-generation commerce. Mission: empowering businesses to innovate, grow and thrive through an open, AI-driven commerce ecosystem that unlocks their data and delivers personalized experiences across every channel.
Midnight navy background, two staggered text blocks (vision top left, mission lower right), each topped by a lime pill accent on a thin rule.
Contrasts traditional commerce problems Commerce solves (fragmented discovery, slow digital adoption, rigid tech stacks) with agentic commerce challenges (AI search engines skipping storefronts, brands losing control of the experience, AI agents soon handling transactions via APIs and MCP).
Section tag 'A NEW ERA OF AI-LED COMMERCE', two-line bold headline, two equal columns of three bulleted problem statements each, footnote pointing to the AI glossary.
Layered stack diagram: Makeswift storefront (BigCommerce storefront, intelligent storefront), Feedonomics agentic commerce (agentic search and discovery, agentic checkout), BigCommerce commerce engine (B2C/B2B, catalog, orders, cart, promotions, personalization) and Feedonomics platform-agnostic intelligence (enrichment, normalization, optimization, syndication, data orchestration).
Four horizontal bands, each with a colored brand pill label and a row of outlined capability capsules; color-coded pink, blue and black per brand.
Customer segmentation chart rising from B2C commerce ($) through B2B ($$) and omnichannel ($$$) to agentic commerce ($$$$), with logos such as Dell, DoorDash, Rakuten, Samsung, Sonos, L'Oreal, Sony, CVS Health, Whirlpool, plus agentic partners Perplexity, Gemini, Copilot, PayPal and Stripe.
Navy background with a diagonal growth line crossing dashed grid, lime-circled dollar-sign markers at each tier, logo clusters per column, lime pill labels along the bottom axis with short descriptions.
Company timeline across three eras: omnichannel (mid-market expansion, Feedonomics and B2B Ninja acquisitions), composable (Makeswift acquisition, Catalyst build) and agentic (AI partnerships, the Commerce brand family), with dots color-coded by platform, data and content needs.
Navy background, horizontal timeline with era pills and dashed dividers, milestone dots with labels beneath, highlighted gradient panel for the agentic era, legend bottom right.
Snapshot KPIs: $361M ARR, 76% non-GAAP gross margin in 2Q26, non-GAAP operating income improving from ($9M) in 4Q22 to $8M in 2Q26, and operating cash flow from ($3M) to $5M.
Navy background, large donut ring with the ARR figure on the left, three stacked outlined KPI cards on the right with mini start-to-end line charts.
Explains the three-brand positioning: Feedonomics for data (enrich and syndicate product data), BigCommerce as the engine (enterprise-grade B2C/B2B transactions) and Makeswift for experience (AI-optimized no-code journeys), converging traditional and agentic commerce.
Navy background with intro paragraph on the left, three white rounded cards with brand logos on the right, and a full-width white banner underneath for the convergence message.
Customer logo wall of 28 brands including Dell, L'Oreal, HP, Estee Lauder, Hershey, The RealReal, NVIDIA, Patagonia, Wayfair, Puma, Skechers, Tiffany & Co., Uniqlo, New Balance and Cole Haan.
Light background, headline at top, 7x4 grid of white tiles with monochrome logos.
Partner ecosystem map with 90+ preferred and elite partners grouped into ad channels, marketplaces, checkout and lending, payments, point of sale, agentic search, CMS, ERP, martech, sales and merchandising, shipping, tax, OMS and PIM.
Category pill labels with rule lines arranged in three columns, rows of partner logos under each, central white card with the Commerce logo, lime banner at the bottom.
Eight recognition cards for 2024-2025: AI readiness, Gartner user trust, Paradigm B2B best-in-class (24 medals), TrustRadius top rated, Gartner execution and vision, G2 grid leader, Forrester strong performer and IDC multichannel commerce leader.
Navy background, 4x2 grid of white rounded cards each with a lime year tab, source logo, periwinkle heading and short description.
Section divider introducing the competitive differentiation part of the deck.
Navy background, headline left with periwinkle underline bar, large wireframe 3D 'C' logo outline on the right.
Six investment theses: multi-billion-dollar TAM expansion, rebuilt leadership and GTM, high gross margins with expanding cash flow, a unified AI-era platform, high-quality relationships at scale (Google, Microsoft, Meta, OpenAI, Perplexity) and leadership in modern B2B commerce.
Full periwinkle background, white headline, 3x2 grid of white cards with periwinkle headings and short body copy.
B2B value metrics in three groups: accelerate growth ($20M+ additional net revenue per 100 customers, 13% AOV increase, 19% ROAS increase), streamline operations (24% more efficient sales teams, 50% more productive platform managers, 25% quicker transactions) and lower costs (391% ROI in three years, 7 months to positive ROI, $10K+ IT cost avoidance per 1,000 customers).
Light background, navy section tag 'WHY 12,000+ LEADING B2B BRANDS TRUST COMMERCE', two-line headline, three white columns each stacking three big-number stats.
B2B differentiation in three pillars: out-of-the-box B2B functionality (multi-company hierarchy, configure-price-quote, invoice portal), enterprise scale (+17K data feeds, +30M products, +20M product configurations) and business agility (composable architecture, flexible payments, multi-storefront).
Three white cards with an icon tile, periwinkle heading, three gear-icon feature rows joined by a connector line and a bracketed outcome note.
B2C value metrics: 61.9% average checkout conversion rate, 65+ payment providers, 100% Google Lighthouse scores; $180K+ integration savings, 15% channel revenue lift, 19% ROAS increase; 211% ROI in under eight months, $700K+ legacy-retirement savings, 90% developer time savings by year three.
Mirrors page 16: navy section tag, headline, three white columns with three large statistics each.
B2C differentiation: customization (custom checkout, real-time visual page editing, feed-based personalization), complex business models (multi-storefront pricing, component-based sites, automated channel syndication) and unified ecommerce infrastructure (pre-integrated composable architecture, low-code development, AI-optimized product data).
Same three-card icon-and-gear template as page 17, applied to B2C.
Agentic differentiation: discoverability in the AI era (structured product data, AI-optimized storefronts, extensible APIs and MCPs), merchant control and brand integrity (customizable storefronts, data ownership, composable infrastructure) and intelligent agentic commerce (agentic search and checkout, syndicated data for AI, AI-personalized experiences), with an MCP footnote.
Third use of the three-card gear template, with a footnote defining Model Context Protocol.
Section divider opening the financial results section.
Navy background, headline left with periwinkle underline, wireframe 'C' logo on the right.
Matrix of how each line earns revenue: BigCommerce and Makeswift SaaS subscriptions, Feedonomics subscriptions that scale with AI growth, and partner and services revenue via take-rate fees; compares sales-led motions (direct to mid-market) with self-serve motions (freemium, Makeswift self-serve coming 2026, future branded payments).
Navy background, four-row by three-column table with brand logos and icon squares in the row headers, periwinkle column headings and thin grid lines.
Total ARR grew from $167M at the 3Q20 IPO to $361M in 2Q26 (14% CAGR); five-quarter ARR of $355M, $356M, $359M, $360M and $361M with YoY growth of 2-3%; footnote defines ARR.
Light background, two white chart cards: a narrow two-bar CAGR chart with arrow and a wider five-bar quarterly chart with lavender YoY bubbles above each bar.
Revenue split into subscription and partner-and-services: annual revenue from $152M (2020) to $342M (2025), an 18% CAGR; annual series $279M, $309M, $333M, $342M (2022-2025); quarterly $40M at IPO to $85M in 2Q26 (14% CAGR); last five quarters $84M, $86M, $90M, $87M, $85M with YoY of +3%, +3%, +3%, +5%, +0%.
Four side-by-side white chart cards of stacked bars (periwinkle subscription, black partner and services) with YoY bubbles and a shared legend.
Non-GAAP opex as a share of revenue: annually from 96% at IPO (S&M 48%, R&D 30%, G&A 18%; -18% margin) to 72% in 2025 (38/19/15; 8% margin); quarterly from 3Q20 (49/29/19; -18% margin) to 2Q26 (32/19/15; 10% margin).
Two white chart cards each comparing a tall and a short stacked bar with S&M, R&D and G&A segments and the resulting margin labeled above.
Quarterly operating cash flow line from 4Q22 (($3M), -4% margin) to 2Q26 ($5M, 6% margin), volatile early on but staying mostly positive over the last two years.
Single wide white card with a periwinkle line chart, a zero baseline and labeled start and end points.
Quarterly GMV of $7.7B, $7.9B, $8.9B, $8.3B and $8.8B (2Q25 to 2Q26), +14% YoY in 1Q26 and 2Q26; annual GMV $25.4B (2023), $28.2B (2024, +11%) and $31.7B (2025, +12%); footnote defines GMV.
Two white chart cards: five-bar quarterly chart and three-bar annual chart, each with lavender YoY bubbles.
Total net revenue retention rising from 94.5% in 2Q25 and 3Q25 to 95.2%, 95.4% and 95.8% in 2Q26, with a footnote explaining how NRR is calculated.
Single white card with a gently rising periwinkle line, dot markers and percentage labels under each point.
Q3 2026 guidance: revenue $82.5M-$85.5M (-2% YoY at midpoint), non-GAAP operating income $3.3M-$5.3M, margin 4-6%. FY2026: revenue $336.5M-$344.5M (-1% at midpoint), non-GAAP operating income $28.0M-$34.0M, margin 8-10%.
Light background, clean four-column table with periwinkle row labels, thin dividers and a footnote on non-GAAP guidance.
Section divider introducing the appendix of financial statements, reconciliations and glossary.
Navy background, underlined headline left, wireframe logo graphic right.
Three months ended June 30: revenue $84.5M vs $84.4M, gross profit $63.5M vs $66.7M, total operating expenses $60.8M vs $73.5M, income from operations $2.7M vs a ($6.8M) loss, and net income $1.1M vs an ($8.4M) loss.
Financial table with navy header band, dotted row separators, two numeric columns for 2026 and 2025, footnote on stock-based compensation.
As of June 30, 2026 vs December 31, 2025: cash $57.2M, marketable securities $99.2M, total assets $324.8M (vs $308.8M), convertible notes $152.5M, deferred revenue $69.8M, total liabilities $273.2M and stockholders' equity $51.6M.
Compact two-column financial table in small type with bold section headers and total rows.
Quarter cash flows: operating cash flow $5.1M (vs $13.6M), investing ($5.7M) (vs ($21.2M)), financing ($0.2M), ending cash and restricted cash $58.3M vs $47.4M.
Two-column cash flow table split into operating, investing and financing sections with bold subtotals.
Bridges GAAP to non-GAAP by function: non-GAAP gross margin 75.7% vs 79.8%, S&M 31.8% vs 39.4% of revenue, R&D 19.3% vs 18.4%, G&A 14.9% vs 16.4%, and non-GAAP operating income $8.1M (9.6% margin) vs $4.8M (5.7%).
Long table with navy subsection bands for each cost line and italic percentage rows.
Net income of $1.1M adjusted for stock-based compensation, depreciation, amortization, interest, taxes, restructuring and other items to adjusted EBITDA of $9.7M, up from $5.7M a year earlier.
Spacious two-column reconciliation table with dotted separators and a shaded total row.
Net income of $1.1M plus stock-based compensation, amortization of intangibles and restructuring charges gives non-GAAP net income of $6.5M vs $3.2M in Q2 2025.
Short reconciliation table with generous row height, matching page 35's style.
Defines ten AI commerce terms with practical applications: agent, agentic checkout, agentic discovery, agentic search, buyer agent, data syndication, LLMs, merchant agent, product data enrichment and shopper agent.
Three-column bordered table (term, definition, application) with a navy header row.
Các câu hỏi phổ biến về slide này và nội dung trình bày cơ bản.
It is a 37-slide investor deck covering the company's vision, its three-brand agentic commerce stack (Feedonomics, BigCommerce, Makeswift), customer and partner proof, investment highlights, Q2 2026 financials (ARR, revenue, GMV, NRR, margins, cash flow), Q3 and full-year 2026 guidance and a GAAP/non-GAAP appendix with an AI glossary.
The deck reports $361M ARR, $84.5M revenue, $8.8B GMV (+14% YoY), 95.8% total net revenue retention, a 76% non-GAAP gross margin, $8.1M non-GAAP operating income (9.6% margin), $5.1M operating cash flow and GAAP net income of $1.1M.
BigCommerce rebranded its parent company as Commerce, with BigCommerce, Feedonomics and Makeswift as product brands under it. The deck explains this brand family and positions the company for agentic, AI-driven commerce.
Yes. The gallery page offers the original PDF and a PPTX converted from it, so you can reuse the slide layouts, charts and tables in PowerPoint, Keynote or Google Slides.
It works well as a reference: it follows a classic earnings structure (cover, disclaimer, company overview, why we win, financials, guidance, appendix) and includes reusable chart patterns for ARR, stacked revenue, opex mix, cash flow, GMV and retention.
A modern corporate style mixing midnight-navy and light-grey slides with an electric periwinkle brand color, lime-green highlights, pill-shaped section tags, rounded white cards and a wireframe 3D logo on section dividers.
Q3 2026 revenue of $82.5M-$85.5M with non-GAAP operating income of $3.3M-$5.3M, and FY2026 revenue of $336.5M-$344.5M with non-GAAP operating income of $28.0M-$34.0M (an 8-10% margin).
Investors following e-commerce software, SaaS finance and IR teams building earnings decks, founders pitching AI or agentic-commerce strategies, and designers looking for a polished corporate presentation reference.

Create Your Own Slides
Turn your ideas into professional presentations in seconds with 2slides AI.
Tham khảo thiết kế chuyên nghiệp, chọn phong cách của bạn và tạo slide với kết xuất văn bản hoàn hảo. Được hỗ trợ bởi Nano Banana—bắt đầu tạo trình bày của bạn ngay bây giờ.
Đại Lý AI Của Bạn Cho Slide. Tiết kiệm thời gian, tỏa sáng nhanh hơn với việc tạo bài thuyết trình thông minh.


© 2026 2slides. Bảo lưu mọi quyền.