
Thuộc bộ sưu tập Ví dụ bài thuyết trình cho nhà đầu tư
Alphabet Q3 2026 Earnings Presentation — Alphabet Inc.'s official 13-slide quarterly earnings deck dated October 28, 2026, covering consolidated results, Google Services and Google Cloud segment performance, an AI product launch timeline, TPU systems, capital expenditures and free cash flow.
Dùng trang bìa của bài trình bày này làm mẫu phong cách cho các slide tạo từ nội dung của bạn. Hoặc chọn bất kỳ trang nào bên dưới để lấy bố cục của trang đó làm tham chiếu.
Điều Hướng Nhanh
Thẻ
Chia sẻ slide
Alphabet Q3 2026 Earnings Presentation — Alphabet Inc.'s official 13-slide quarterly earnings deck dated October 28, 2026, covering consolidated results, Google Services and Google Cloud segment performance, an AI product launch timeline, TPU systems, capital expenditures and free cash flow.
Xem chi tiết từng trang slide, bao gồm bố cục, nội dung chính và các phần tử trực quan.
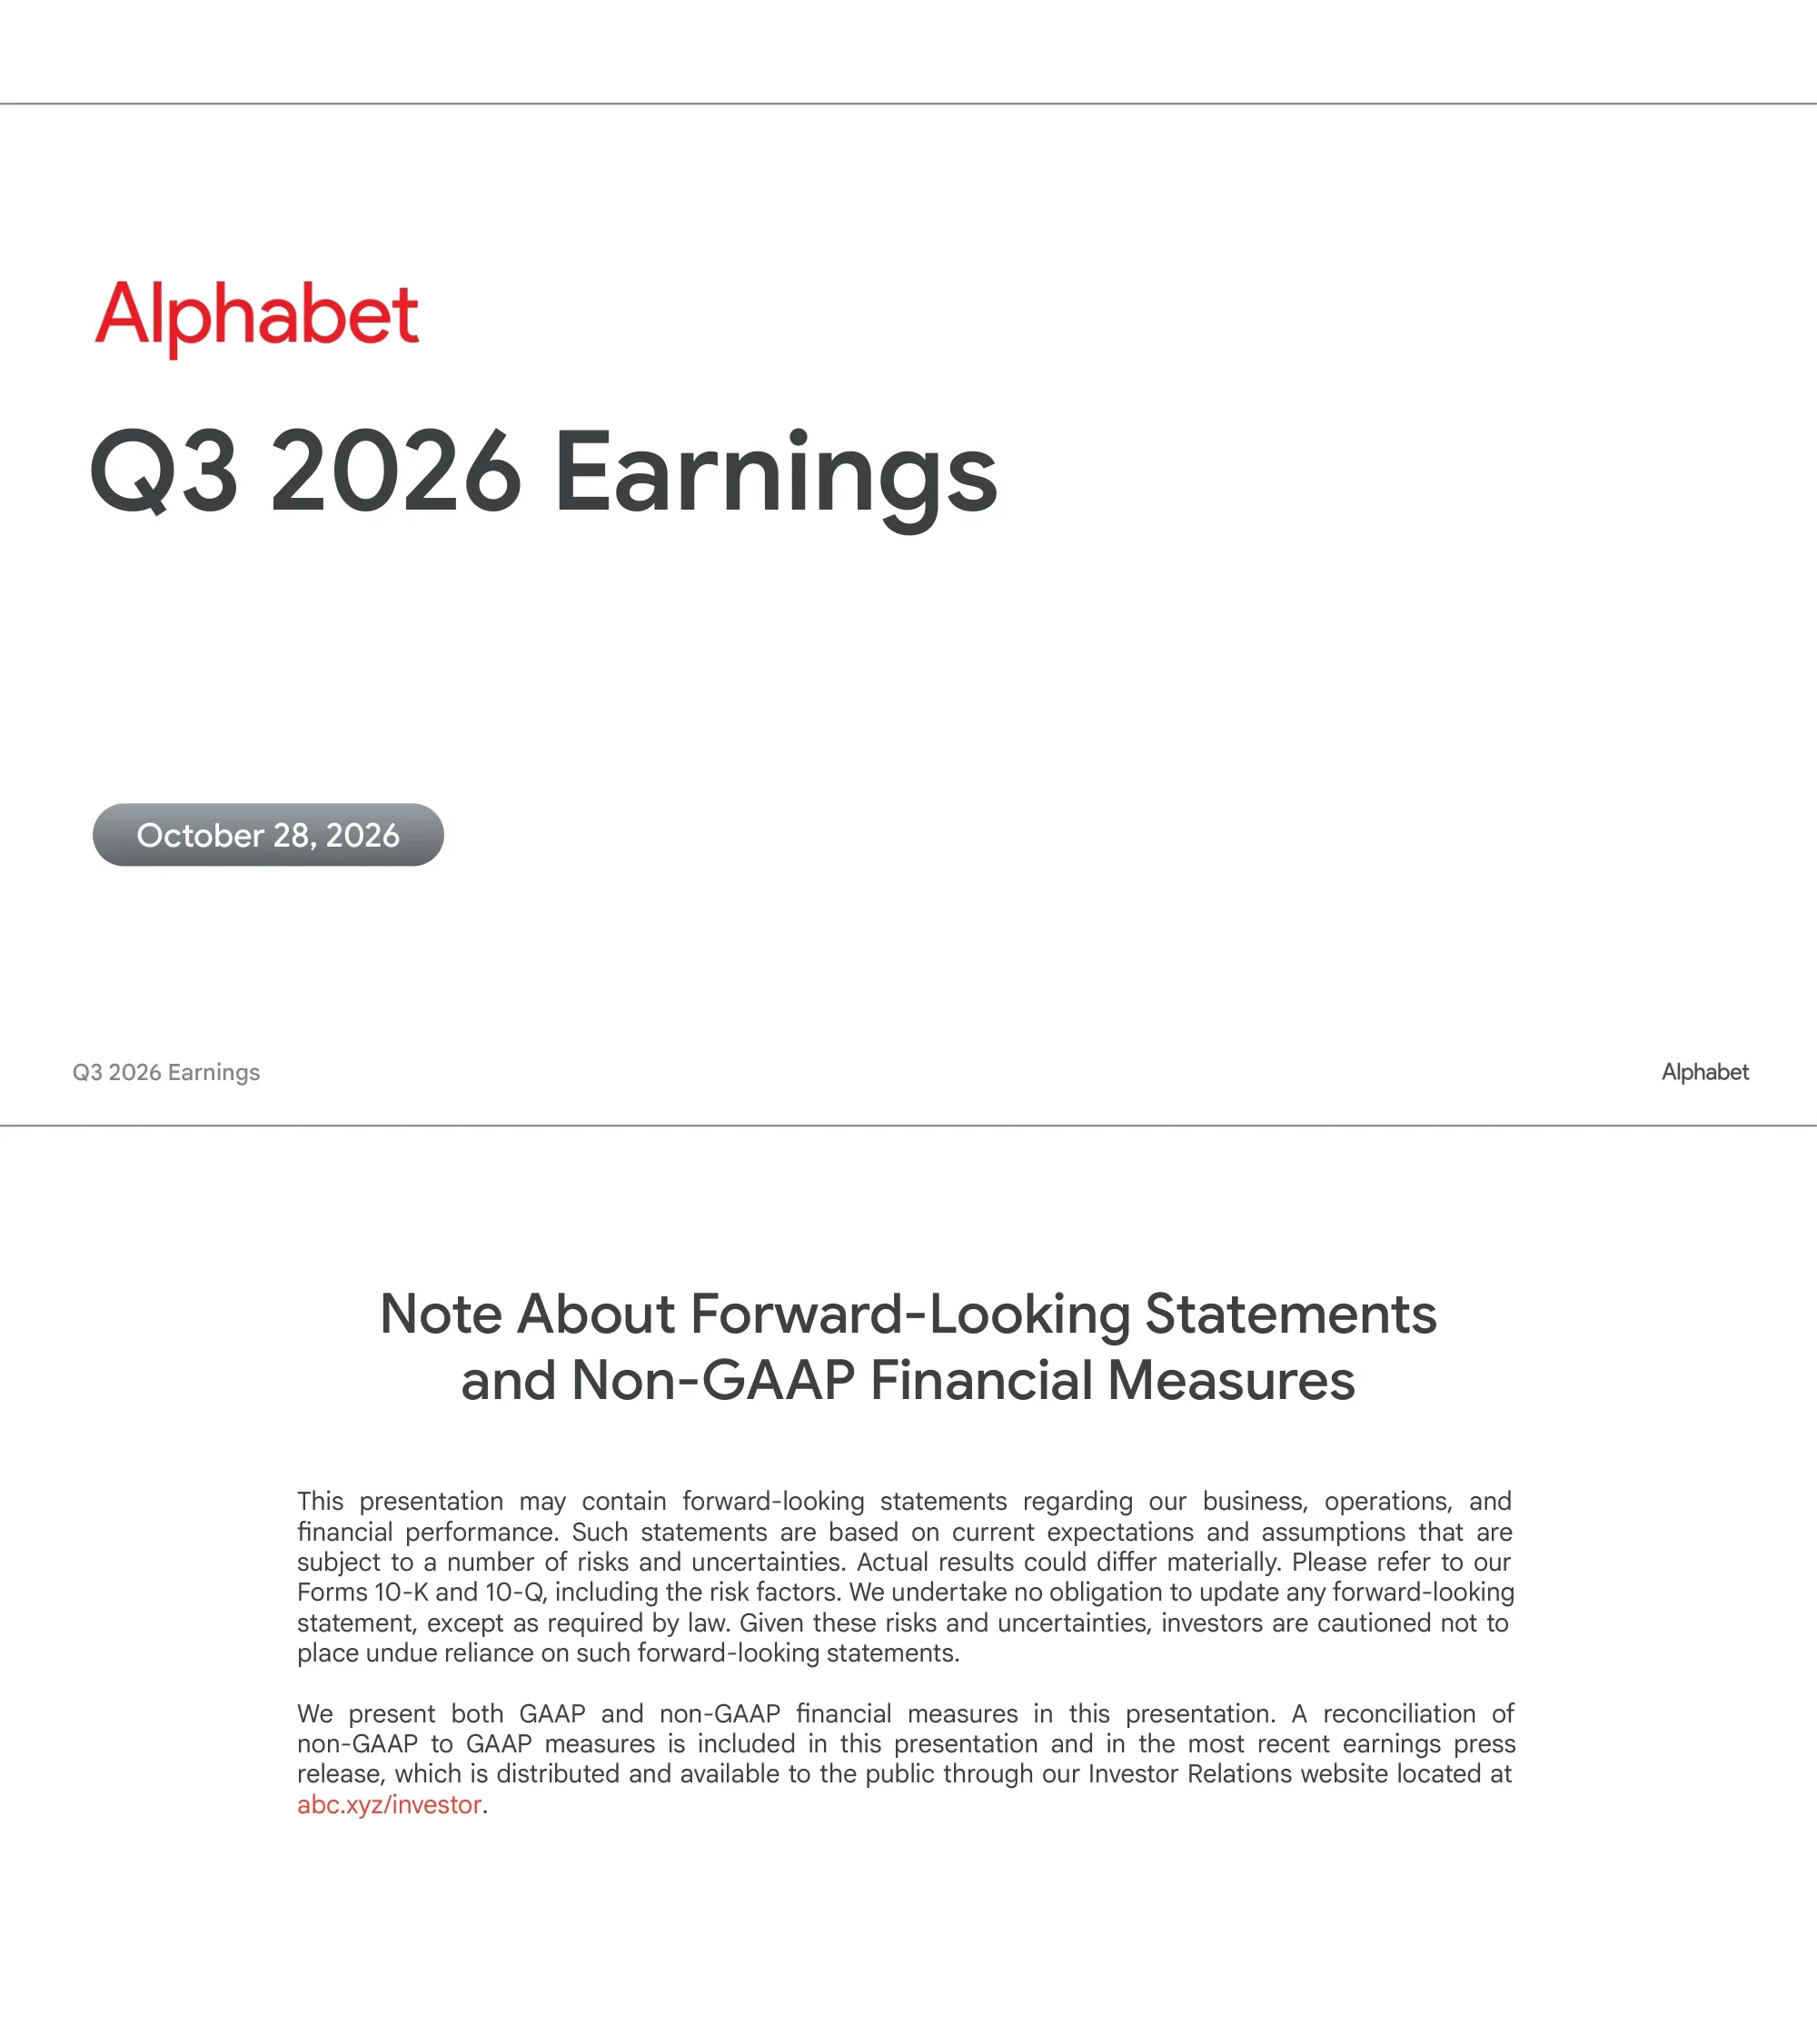
Cover slide with the red Alphabet wordmark, the title 'Q3 2026 Earnings' and a grey pill-shaped date badge reading October 28, 2026.
Left-aligned title stack on a white background with a thin grey rule across the top; large dark-grey headline below the brand wordmark and a rounded date label in the lower left.
Legal disclaimer: the presentation may contain forward-looking statements subject to risks and uncertainties (referring readers to Forms 10-K and 10-Q), and it presents both GAAP and non-GAAP measures, with a reconciliation included in the deck and in the earnings press release at abc.xyz/investor.
Centered two-line heading over two justified paragraphs of body text; running header with 'Q3 2026 Earnings' at left and 'Alphabet' at right.
A July 2026 to October 2026 timeline of ten AI model launches: Gemini 3.6 Flash and 3.5 Flash Cyber, Gemini 3.5 Transcribe, Gemini 3.7 Flash, Omni 1.1 Flash (available via APIs), Gemini 3.8 Flash & 3.8 Flash Cyber, Lyria 3.5, Gemini 4 Argon, Gemini 3.8 Live & Extended Thinking, Gemini 4 Carbon and Nano Banana 2.1.
Horizontal timeline with nine blue dots across the middle, five rounded cards above and five below, alternating; each card has a product name and a thumbnail of its launch graphic.
Six KPI tiles: Alphabet +25% Q3 Y/Y revenue growth to ~$128B, now a half-trillion annual revenue run rate; Search & Other Ads +12% Q3 Y/Y revenue growth with the fastest growth in Search queries in 5 years; Google Cloud +103% Q3 Y/Y revenue growth; Gemini App 1B+ monthly active users; ~32B tokens per minute, up 40% Q/Q, across 1P models including Gemini via direct API usage; YouTube 150M YouTube Music and Premium subscribers, including trials.
Six equal-width vertical cards in a row, each with a brand icon at the top, a large blue headline number in the middle, a description, and a grey business-unit label at the bottom.
Unaudited income statement in millions: revenues $102,346 (Q3'25) vs $127,577 (Q3'26), +25%; cost of revenues 41,369 vs 51,419 (+24%); R&D 15,151 vs 20,640 (+36%); sales and marketing 7,205 vs 8,804 (+22%); G&A 7,393 vs 6,138 (-17%); total costs and expenses 71,118 vs 87,001 (+22%); income from operations 31,228 vs 40,576 (+30%); other income (expense), net 12,759 vs (8,221), NM; income before taxes 43,987 vs 32,355 (-26%); provision for income taxes 9,008 vs 5,887 (-35%); preferred stock dividends - vs 298, N/A; net income available to common stockholders $34,979 vs $26,170 (-25%); diluted EPS $2.87 vs $2.12 (-26%).
Title and units subtitle at top left; a wide rounded table with a dark grey gradient header row (Q3'25, Q3'26, Y/Y), alternating light row shading, bold subtotal rows and a footnote 'NM = Not Meaningful'.
Two bar charts in millions: revenues rose from $102,346 in Q3'25 to $127,577 in Q3'26, with Y/Y growth of +16% and +25% respectively; operating income rose from $31,228 to $40,576, with operating margin of 30.5% and 31.8%.
Two side-by-side rounded chart cards, each with a two-bar column chart, dotted horizontal gridlines, data labels above bars, and a metric row (Y/Y Growth or Operating Margin) beneath the axis.
Left stacked bar: cost of revenues $41,369 in Q3'25 (Total TAC $14,876 + other cost of revenues $26,493) vs $51,419 in Q3'26 (TAC $16,366 + other $35,053), Y/Y growth +13% and +24%. Right stacked bar: operating expenses $29,749 in Q3'25 (R&D $15,151, S&M $7,205, G&A $7,393) vs $35,582 in Q3'26 (R&D $20,640, S&M $8,804, G&A $6,138), Y/Y growth +28% and +20%.
Two chart cards side by side with legends at the top, two stacked columns each, segment values printed inside the bars, totals above, and a Y/Y Growth row at the bottom.
Stacked revenue bars: Google Services $87,052 in Q3'25 (Search & other $56,567, YouTube ads $10,261, Google Network $7,354, Subscriptions, platforms & devices $12,870) vs $96,302 in Q3'26 (Search & other $63,350 +12% Y/Y, YouTube ads $11,207 +9%, Network $7,455 +1%, Subscriptions, platforms & devices $14,290 +11%); total Y/Y growth +14% and +11%. Operating income $33,527 vs $39,157, with operating margin 38.5% and 40.7%.
Left card: four-segment stacked column chart with legend and per-segment Y/Y growth call-outs to the right of the Q3'26 bar. Right card: two-bar operating income chart with an operating margin row.
Google Cloud revenues rose from $15,157 million in Q3'25 to $30,709 million in Q3'26, with Y/Y growth of +34% and +103%; operating income rose from $3,594 million to $11,121 million, with operating margin expanding from 23.7% to 36.2%.
Two side-by-side chart cards with two-bar column charts on truncated axes (revenues from $15,000, operating income from $2,500), data labels above bars and growth/margin rows underneath.
Describes Google's TPU v7 as comprehensive full-stack integration from purpose-built silicon to open software and support. Open Software and Support: frameworks (native support for JAX, PyTorch & XLA compiler), inference engine (high-throughput vLLM, SGLang & model serving engines), support (post-sales product support and warranty). System Components: TPU trays (four proprietary chips on one liquid-cooled board) → TPU racks (16 TPU machines with battery backup) → TPU pods (144 TPU racks with 3 optical switch racks). Purpose-built Hardware: compute (custom TPUs & high-performance host CPUs), storage (HBM and other memory), networking (Optical Circuit Switches, Datacenter Network & ultra-low latency ICI).
Three horizontal layered bands, each with a blue section heading and three outlined boxes; arrow connectors link the System Components boxes; a tall photo of a cabled v7 rack fills the right column.
Five-quarter capex trend in millions: Q3'25 $23,953 (+83% Y/Y), Q4'25 $27,851 (+95%), Q1'26 $35,674 (+107%), Q2'26 $44,924 (+100%), Q3'26 $51,355 (+114%).
Single wide chart card with a five-column bar chart, values above each bar, quarter labels below and a Y/Y Growth row along the bottom.
Quarterly table Q3'25 to Q3'26 (millions): net cash provided by operating activities 48,414 / 52,402 / 45,790 / 39,069 / 42,290; purchases of property and equipment (23,953) / (27,851) / (35,674) / (44,924) / (51,355); free cash flow $24,461 / $24,551 / $10,116 / ($5,855) / ($9,065); TTM free cash flow $73,552 / $73,266 / $64,429 / $53,273 / $19,747. Q3'26 Y/Y: operating cash flow (13%), capex 114%, FCF NM, TTM FCF (73%). Footnotes mark FCF as a non-GAAP measure and NM = Not Meaningful.
Wide five-column table with a blue gradient header row, plus a separate narrow Y/Y column card at right; footnotes at the bottom left.
Explains why Alphabet provides non-GAAP free cash flow and defines FCF (operating cash flow less capital expenditures) and TTM FCF. Reconciliation table Q4'24 to Q3'26 (millions): operating cash flow 39,113 / 36,150 / 27,747 / 48,414 / 52,402 / 45,790 / 39,069 / 42,290; purchases of property and equipment (14,276) / (17,197) / (22,446) / (23,953) / (27,851) / (35,674) / (44,924) / (51,355); free cash flow 24,837 / 18,953 / 5,301 / 24,461 / 24,551 / 10,116 / (5,855) / (9,065). TTM rows from Q3'25 to Q3'26: operating cash flow 151,424 / 164,713 / 174,353 / 185,675 / 179,551; capex (77,872) / (91,447) / (109,924) / (132,402) / (159,804); FCF 73,552 / 73,266 / 64,429 / 53,273 / 19,747.
Two-line title with units, an explanatory paragraph and two bullet definitions, then a full-width eight-quarter reconciliation table with a blue gradient header split into quarterly and TTM blocks; footnote 'TTM = Trailing Twelve Months'.
Các câu hỏi phổ biến về slide này và nội dung trình bày cơ bản.
It is Alphabet Inc.'s official 13-slide earnings deck for the third quarter of 2026, dated October 28, 2026 and published on its investor relations website (abc.xyz/investor). It covers consolidated results, the Google Services and Google Cloud segments, AI model launches, TPU systems, capital expenditures and free cash flow.
According to the slides, revenues were $127,577 million, up 25% year over year (about $128B, described as a half-trillion annual revenue run rate). Income from operations was $40,576 million (31.8% operating margin), net income available to common stockholders was $26,170 million and diluted EPS was $2.12, down 26% because other income swung to a loss of $8,221 million.
Google Cloud revenues grew 103% year over year to $30,709 million, and Cloud operating income rose to $11,121 million with operating margin expanding from 23.7% to 36.2%.
Capex was $51,355 million in Q3 2026, up 114% year over year, continuing a rise from $23,953 million in Q3 2025. As a result quarterly free cash flow was ($9,065) million and trailing twelve-month free cash flow fell to $19,747 million.
The Earnings Highlights slide lists 1B+ Gemini App monthly active users and ~32B tokens per minute (up 40% quarter over quarter) across first-party models including Gemini via direct API usage, and a timeline slide shows ten model launches between July and October 2026, including Gemini 4 Argon, Gemini 4 Carbon and Nano Banana 2.1.
Yes. The page offers the original PDF and an editable PPTX version converted from the PDF. The PPTX is a machine conversion, so charts and tables may come through as images or text boxes rather than native chart objects and may need some clean-up.
The six-tile Earnings Highlights KPI slide (page 4), the paired bar chart slides with growth and margin rows (pages 6–9), the stacked cost breakdown (page 7) and the layered technology-stack diagram (page 10) are all clean, reusable layouts.
The previous quarter's deck, Alphabet Q2 2026 Earnings Presentation, is also in the 2slides gallery, and Alphabet hosts all quarterly earnings materials on its investor relations site.
Original source file of this presentation
Earnings press releases, SEC filings and quarterly earnings materials

Create Your Own Slides
Turn your ideas into professional presentations in seconds with 2slides AI.
Tham khảo thiết kế chuyên nghiệp, chọn phong cách của bạn và tạo slide với kết xuất văn bản hoàn hảo. Được hỗ trợ bởi Nano Banana—bắt đầu tạo trình bày của bạn ngay bây giờ.
Đại Lý AI Của Bạn Cho Slide. Tiết kiệm thời gian, tỏa sáng nhanh hơn với việc tạo bài thuyết trình thông minh.


© 2026 2slides. Bảo lưu mọi quyền.