
Thuộc bộ sưu tập Ví dụ bài thuyết trình cho nhà đầu tư
Advantech Q3 2026 Earnings Presentation (3Q26 Online Investor Conference, 研華2026年第三季法人說明會), November 4, 2026. This is the English version of the deck Advantech filed on Taiwan's Market Observation Post System (MOPS) for its investor conference (法說會), hosted online by Daiwa-Cathay securities. Advantech is a Taiwanese industrial IoT and embedded computing company. In 3Q26 net sales reached NT$ (New Taiwan dollars) 32,440 million, up 83% year over year and 24% quarter over quarter, with net income to parent of NT$6,218 million (+125% YoY) and EPS of NT$7.15, both described as single-quarter records.
Dùng trang bìa của bài trình bày này làm mẫu phong cách cho các slide tạo từ nội dung của bạn. Hoặc chọn bất kỳ trang nào bên dưới để lấy bố cục của trang đó làm tham chiếu.
Điều Hướng Nhanh
Thẻ
Chia sẻ slide
Advantech Q3 2026 Earnings Presentation (3Q26 Online Investor Conference, 研華2026年第三季法人說明會), November 4, 2026. This is the English version of the deck Advantech filed on Taiwan's Market Observation Post System (MOPS) for its investor conference (法說會), hosted online by Daiwa-Cathay securities. Advantech is a Taiwanese industrial IoT and embedded computing company. In 3Q26 net sales reached NT$ (New Taiwan dollars) 32,440 million, up 83% year over year and 24% quarter over quarter, with net income to parent of NT$6,218 million (+125% YoY) and EPS of NT$7.15, both described as single-quarter records.
Xem chi tiết từng trang slide, bao gồm bố cục, nội dung chính và các phần tử trực quan.
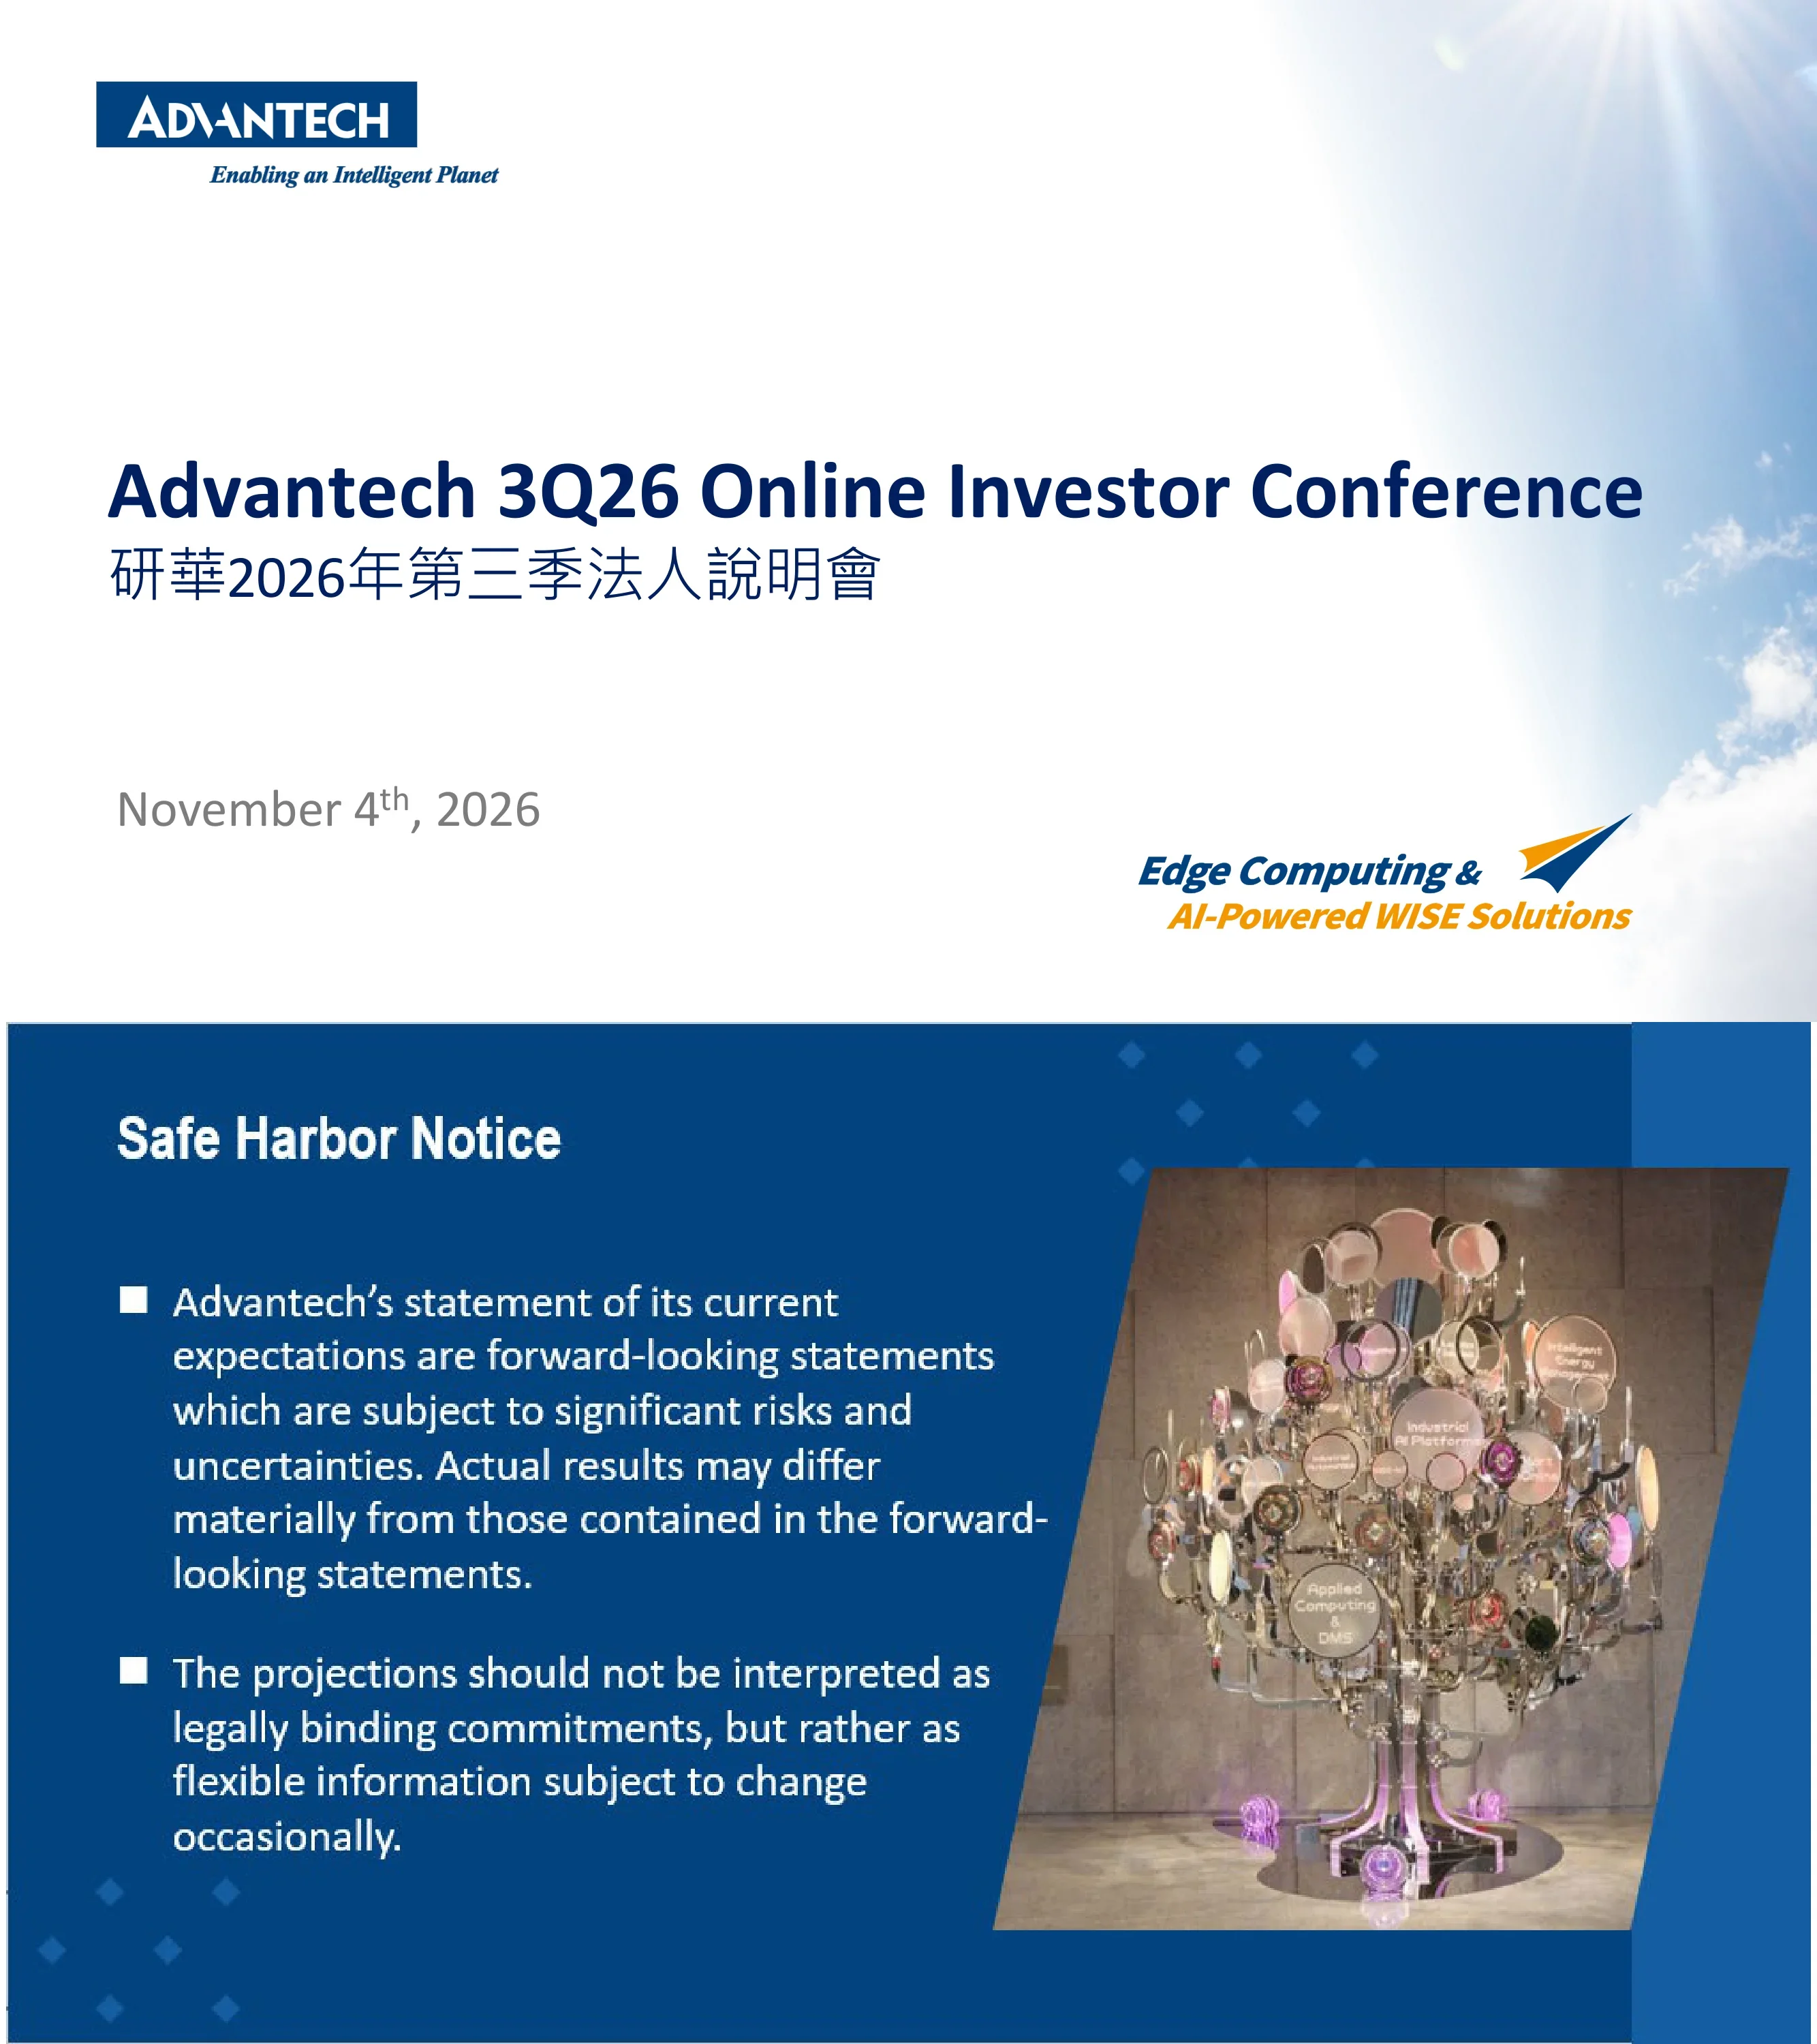
Cover slide titled "Advantech 3Q26 Online Investor Conference" with the Chinese subtitle 研華2026年第三季法人說明會, dated November 4th, 2026, carrying the Advantech logo, the tagline "Enabling an Intelligent Planet" and the theme line "Edge Computing & AI-Powered WISE Solutions".
Left-aligned title block on a white background with a sky-and-sunlight photo fading in from the right edge; logo top left, date bottom left, theme slogan with paper-plane mark bottom right.
Forward-looking statement disclaimer: Advantech's current expectations are subject to significant risks and uncertainties and actual results may differ materially; projections are not legally binding commitments and may change.
Full-bleed navy background with two square-bulleted paragraphs on the left and a slanted, parallelogram-cropped photo on the right; scattered light-blue diamond motifs in the corners.
Income statement in NT$ million: 3Q26 net sales 32,440 (+24% QoQ from 26,126; +83% YoY from 17,774); gross profit 11,896 at 36.7% (2Q26 37.7%, 3Q25 38.9%); operating expense 5,101 (15.7%); operating profit 6,795 at 20.9% (+33% QoQ, +151% YoY); non-operating items 1,106; pretax profit 7,901 (+141% YoY); tax 1,700; net income to parent 6,218 at 19.2% (+38% QoQ, +125% YoY); EPS NT$7.15 vs NT$5.20 and NT$3.20. Year to date: net sales 78,952 (+49%), gross profit 29,721 at 37.6% vs 39.8%, operating profit 15,651 at 19.8% (+79%), pretax 17,559 (+95%), net income to parent 14,070 (+88%), EPS NT$16.21 vs NT$8.67. Commentary: quarterly sales and profit are single-quarter records; gross margin fell on higher material costs while operating margin rose on operating leverage and OPEX discipline; non-operating income came from dividends, FX gains and a one-time disposal gain; effective tax rate 21.5%.
Bold title with Chinese subtitle above a wide blue-header table split into quarterly columns (3Q26, 2Q26, QoQ, 3Q25, YoY) and year-to-date columns (YT3Q2026, YT3Q2025, YoY); bold rows for profit lines, a solid blue EPS footer row; two bullet columns below headed 3Q26 and 3Q26 YTM.
Year-to-date sales by region in US$ million (columns labelled 3Q26 vs 3Q25; the total of 2,485 matches the year-to-date figure): North America 822 vs 519 (+58%, 33% of revenue), Europe 377 vs 276 (+36%, 15%), China 556 vs 358 (+55%, 22%), North Asia 220 vs 154 (+43%, 9%), Taiwan 196 vs 114 (+72%, 8%), Asia & InterCon 223 vs 163 (+37%, 9%), Others 91 vs 113 (-20%, 4%); total 2,485 vs 1,697 (+46%). A stacked bar compares regional mix YTM3Q25 vs YTM3Q26 (North America 31% to 33%, China 21% to 22%, Europe 16% to 15%, Others 6% to 4%). Sub-tables: North Asia — Japan (AJP) 119 (+31%), Korea (AKR) 101 (+61%); Asia & InterCon — Australia/New Zealand 14 (+19%), ASEAN 67 (+75%), India 25 (+33%), LATAM 20 (+15%), ME&A & Others 98 (+27%).
Full-width regional table at top with a blue total row; bottom third split into a framed two-column stacked bar chart on the left and two small sub-region tables (North Asia, Asia & InterCon) on the right.
Year-to-date results by business group in US$ million: IoT Automation (iAutomation) revenue 156, 6% of sales, +25% YoY, gross margin 65%~70%, operating profit 89, OP margin 57%; Intelligent Systems (iSystems) 1,030, 42%, +49%, GM 40%~45%, OP 237, 23%; Embedded 798, 32%, +40%, GM 30%~35%, OP 176, 22%; Intelligent Service (iService) 136, 5%, +7%, GM 30%~35%, OP 13, 10%; Advantech Service+ / Others (AS+) 365, 15%, +95%, GM 21%~25%, OP 28, 8%; total 2,485, +46%, GM 37.6%, OP 492 after US$51M unallocated expenses, OP margin 19.8%. Drivers: iAutomation from factory automation in North America, China and Taiwan plus transportation channel projects; iSystems from semiconductor equipment projects, cloud infrastructure and data center projects in North America, and robotics and AI demand from China and Korea distributors; Embedded from medical equipment, machine automation, semiconductor equipment, video solutions and mission-critical; iService from healthcare and a distributor recovery in China and ME&A, partly offset by retail and hospitality declines.
Seven-column blue-header table (Revenue, Rev. %, YoY, Gross Margin, Operating Profit, OP Margin) with segment names and short codes in the first column, blue total row and a footnote; four square-bulleted driver explanations below, each starting with the segment name and growth rate in bold.
Balance sheet in NT$ million for 3Q26 / 2Q26 / 3Q25: cash and equivalents 18,095 / 18,728 / 14,726; accounts receivable 18,581 / 15,604 / 11,056; inventory 23,018 / 20,908 / 11,047; total assets 98,985 / 93,204 / 70,053; accounts payable 14,425 / 14,525 / 7,084; short-term debt 5,703 / 385 / 351; long-term debt 1,466 / 1,554 / 1,553; total liabilities 36,224 (37%) / 37,750 (41%) / 18,556 (26%); total equity 62,761 / 55,454 (59%) / 51,497 (74%). The 3Q26 equity share is printed as 18%, although 62,761 of 98,985 is about 63%. Key indices: inventory days 95 / 101 / 93; AR days 51 / 51 / 55; AP days 60 / 70 / 60; cash conversion cycle 86 / 82 / 84 days.
Single large table with a two-tier blue header (period, then Amount and %), blue highlighted subtotal rows for total assets, liabilities and equity, a 'Key Indices' sub-header and a blue CCC footer row.
Management guidance for 4Q26 based on an exchange rate of US$1 to NT$31.8: consolidated revenue US$970M to US$990M, gross margin 36.0% to 38.0%, operating margin 18.0% to 20.0%.
Centered title, one-sentence assumption line with the FX rate bold and underlined, then a two-column table (Items, 4Q26 Estimation) with three large-type rows.
Closing slide repeating the theme 'Edge Computing & AI-Powered WISE Solutions' with the company website www.advantech.com and investor relations email IR@advantech.com.tw.
Same sky-photo background as the cover; logo top left, large two-line italic slogan centered with the paper-plane mark, website and email lines with icons below.
Các câu hỏi phổ biến về slide này và nội dung trình bày cơ bản.
It is the English version of the deck Advantech filed on Taiwan's Market Observation Post System (MOPS) for its 3Q26 investor conference (法說會, 研華2026年第三季法人說明會) held online on November 4, 2026 and hosted by Daiwa-Cathay securities. MOPS also carries a Traditional Chinese version of the same deck.
Net sales were NT$ (New Taiwan dollars) 32,440 million, up 83% year over year and 24% quarter over quarter. Operating profit was NT$6,795 million (20.9% margin), net income to parent NT$6,218 million (+125% YoY) and EPS NT$7.15. Gross margin slipped to 36.7% on higher material costs.
At an assumed rate of US$1 = NT$31.8, management guided consolidated revenue of US$970M to US$990M, gross margin of 36.0% to 38.0% and operating margin of 18.0% to 20.0%.
Advantech Service+ / Others grew 95% and Intelligent Systems (iSystems), the largest group at US$1,030M, grew 49%, helped by semiconductor equipment and North American data center projects. Embedded grew 40%, IoT Automation 25% (with the highest margins) and Intelligent Service 7%.
No. Advantech makes industrial IoT, edge computing and embedded computing hardware and software. Semiconductor equipment makers are among its customers, which is why that end market shows up in the segment commentary.
Yes. On the balance sheet slide the 3Q26 total equity share is printed as 18%, while the amounts imply about 63%. On the regional slide the columns are labelled 3Q26 and 3Q25, but the US$2,485M total matches the year-to-date figure, so the table is year-to-date.
Yes. Its eight slides follow a common quarterly structure: cover, safe harbor, income statement table, regional mix, segment table, balance sheet with working-capital days, outlook and closing. You can download the PDF and rebuild the layout with your own numbers.
Original English investor conference deck filed by Advantech (2395) on November 4, 2026.

Create Your Own Slides
Turn your ideas into professional presentations in seconds with 2slides AI.
Tham khảo thiết kế chuyên nghiệp, chọn phong cách của bạn và tạo slide với kết xuất văn bản hoàn hảo. Được hỗ trợ bởi Nano Banana—bắt đầu tạo trình bày của bạn ngay bây giờ.
Đại Lý AI Của Bạn Cho Slide. Tiết kiệm thời gian, tỏa sáng nhanh hơn với việc tạo bài thuyết trình thông minh.


© 2026 2slides. Bảo lưu mọi quyền.