
Şu koleksiyonda: Yatırımcı sunumu örnekleri
Vale Q3 2026 Earnings Presentation (3Q26 Performance, October 30, 2026): the Brazilian miner's quarterly results deck covering iron ore, copper and nickel operations, freight, costs, hedging, free cash flow and expanded net debt. Filed with the SEC as an exhibit to Form 6-K; all amounts are in US dollars (US$) as presented by Vale. Headline figures: proforma EBITDA of US$3,508 million (down 20% from US$4,399 million in 3Q25), iron ore production of 88.4 Mt with sales of 86.3 Mt, free cash flow of US$2,230 million, and expanded net debt of US$16.4 billion, within the US$10-20 billion target range.
Bu sunumun kapağını, kendi içeriğinizden oluşturulan slaytlar için stil referansı olarak kullanır. Ya da aşağıdan herhangi bir sayfayı seçip düzenini referans olarak kullanın.
Hızlı Navigasyon
Etiketler
Slaytları paylaş
Vale Q3 2026 Earnings Presentation (3Q26 Performance, October 30, 2026): the Brazilian miner's quarterly results deck covering iron ore, copper and nickel operations, freight, costs, hedging, free cash flow and expanded net debt. Filed with the SEC as an exhibit to Form 6-K; all amounts are in US dollars (US$) as presented by Vale. Headline figures: proforma EBITDA of US$3,508 million (down 20% from US$4,399 million in 3Q25), iron ore production of 88.4 Mt with sales of 86.3 Mt, free cash flow of US$2,230 million, and expanded net debt of US$16.4 billion, within the US$10-20 billion target range.
Her slayt sayfasının detaylı görünümü, düzen, temel içerik ve görsel öğeler dahil.
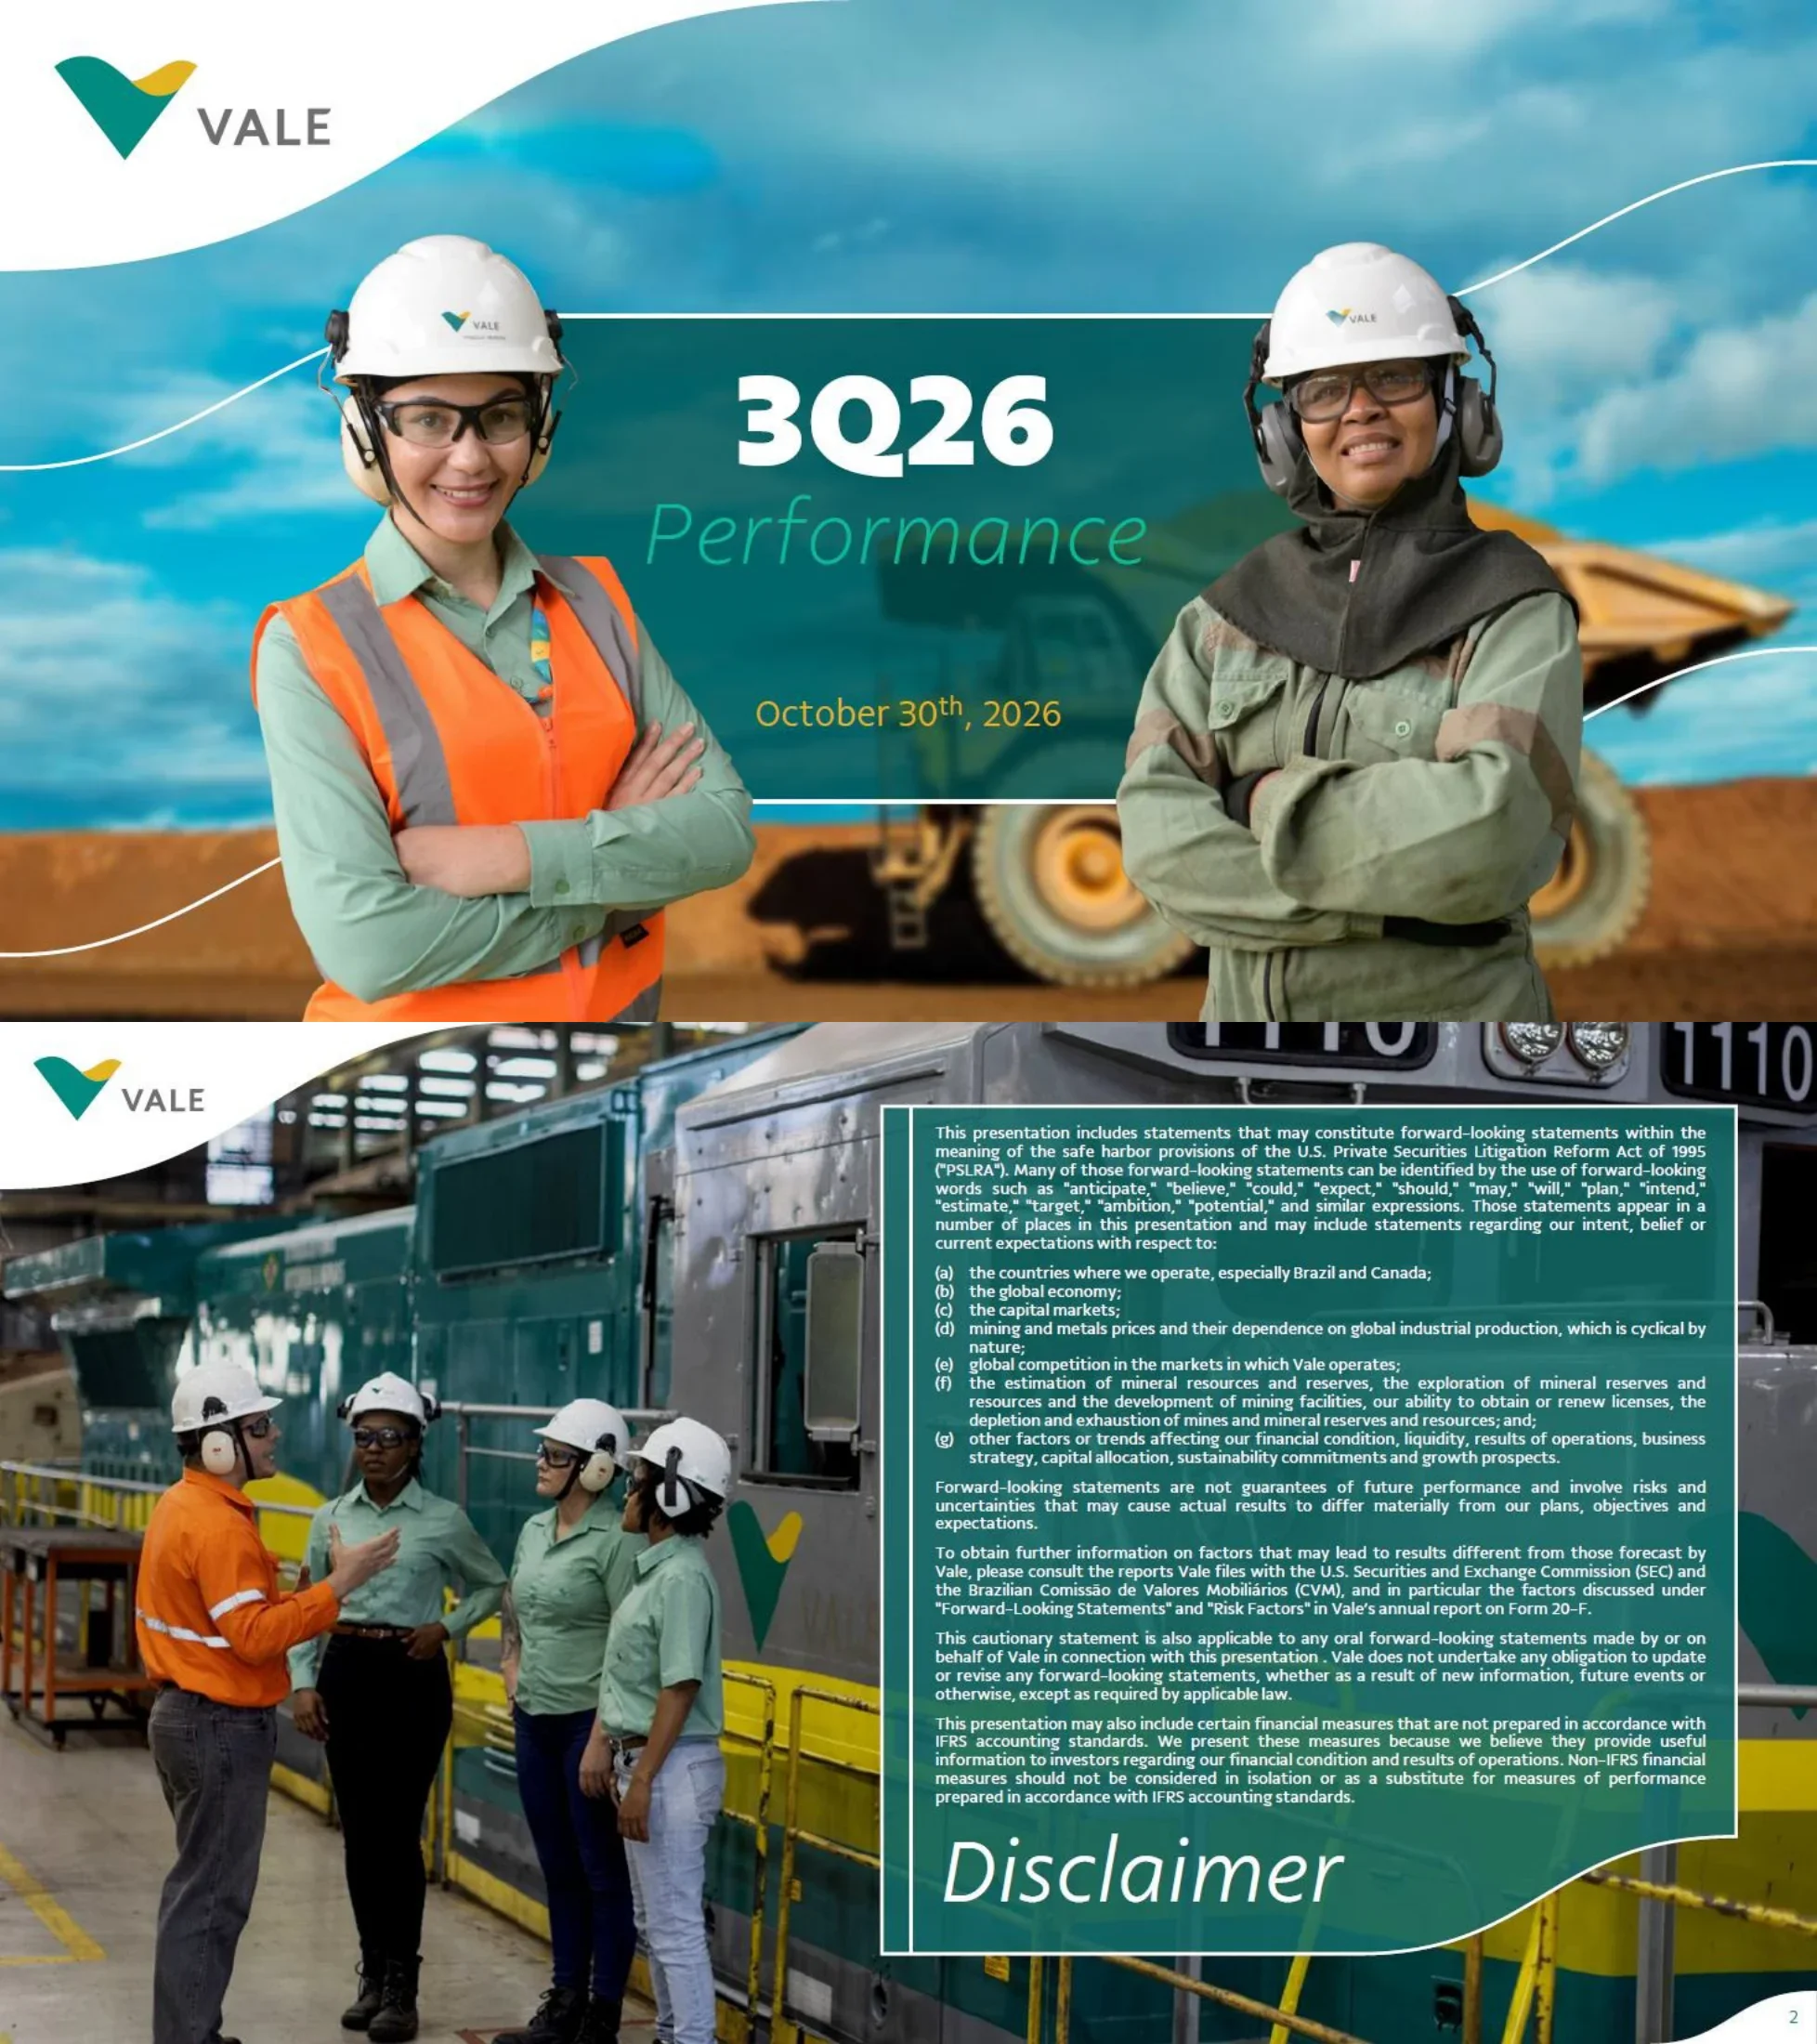
Cover slide titled '3Q26 Performance', dated October 30th, 2026, with the Vale logo top left and two Vale employees in hard hats and safety gear standing in front of a haul truck at a mine site.
Full-bleed photograph with a white wave shape carrying the logo at top left and a central semi-transparent teal title box holding the quarter, the word 'Performance' and the date.
Forward-looking statements notice under the safe harbor of the U.S. Private Securities Litigation Reform Act of 1995, listing risk areas: the countries where Vale operates (especially Brazil and Canada), the global economy, capital markets, mining and metals prices, global competition, estimation of mineral resources and reserves and licensing, and other factors affecting financial condition and strategy. It refers readers to Vale's filings with the SEC and Brazil's CVM, including the 'Risk Factors' section of the Form 20-F, and notes the deck includes non-IFRS financial measures.
Photo of four workers beside a locomotive on the left; a large teal text panel on the right with dense justified legal copy and the word 'Disclaimer' in large italic type at the bottom.
Agenda divider highlighting section 1, 'Opening remarks', with section 2, 'Financial Performance', shown greyed out alongside it.
Full-bleed photo of an iron ore conveyor and stacker discharging ore in front of rainforest; two square boxes, the active one filled teal and the inactive one outlined and translucent.
Strategy overview. Ambition: leading value creation in the mining industry through ethical and sustainable practices. Business: Iron Ore (leading global production and driving steel decarbonization with the most competitive costs and customer-centric flexibility), Copper (accelerating growth to double production) and Nickel (focus on operational efficiency). Levers wheel: Cultural Evolution (safety, people, innovation), Trusted Partner (sustainability, communication, institutional engagement) and Superior Portfolio (operational excellence, capital allocation, licensing, projects).
Three-column wave layout: bright green 'Our ambition' panel with an eye icon, teal 'Our business' panel with three icon-led commodity blocks, and a grey panel with a three-segment circular 'Our levers' diagram.
Iron ore production was 88.4 Mt in 3Q26 versus 94.4 Mt in 3Q25 (-6%), while sales rose 0.3% to 86.3 Mt from 86.0 Mt. 2026 production guidance is 335-345 Mt. Highlights: production impacted by restrictions at Serra Norte, Fabrica and Viga; record S11D production and continued ramp-up of Capanema and VGR1; solid sales supported by inventories. 4Q26 outlook: higher Serra Norte production q/q and y/y, the Fabrica restart supports volume recovery, and Vale is on track to achieve iron ore and pellet guidance.
White title band with a two-tone headline and a 2025/2026 legend; below, an aerial mine photo with a left chart panel (paired bars for production and sales) and a right text panel with highlights and outlook bullets.
Freight rates in US$/t for 1Q26, 2Q26 and 3Q26: C3 route (Brazil-China) 24.8, 34.0 and 36.8 (+12.0, +48%); C5 route (Australia-China) 9.7, 13.4 and 14.6 (+4.9, +51%); Vale's realized freight 18.1, 22.0 and 22.8 (+4.7, +26%), or 21.4 adjusted for the cash effect of oil hedges and forward freight agreements. Callouts: about 75% of Vale's freight needs covered by long-term contracts, over 80% of 2027 freight needs already secured at competitive rates, a fuel advantage from larger vessels and use of HSFO, and about US$3 billion in cost avoided with Vale's shipping strategy in 2026.
Title band over a port and ship-loading aerial photo; left panel with a three-group clustered bar chart, right side a 2x2 grid of teal stat cards.
Copper (kt): production 85.5 vs 90.8 in 3Q25 (-6%), sales 86.3 vs 90.0 (-4%); 2026 production guidance 360-380 kt. Nickel (kt): production 49.7 vs 46.8 (+6%), sales 49.8 vs 42.9 (+16%); 2026 guidance 185-200 kt. Copper highlights: highest Q3 production at Salobo and planned maintenance at Sossego. Nickel highlights: highest production at the Sudbury refinery since 4Q13, Onca Puma 2nd furnace, and the Thompson transaction completed with a multi-year nickel concentrate offtake for VBM.
Title band with 2025/2026 legend; three panels over an aerial plant photo: copper bar chart, nickel bar chart and a highlights text panel.
The Salobo CPF project was approved: about 30 ktpy of copper and about 15 kozpy of gold, capex of about US$215 million (VBM's capex of US$175 million after US$40 million funding from Wheaton Precious Metals) and start-up in 1H28. Copper production path (kt): 360-380 in 2026; Bacaba/Sossego +15-25 (start-up 3Q27); Salobo/CPF +30-50 (1H28); polymetallics +20-30 (start-up 1Q27, Sudbury mill expansion); Alemao +5-15 in its first year (start-up 2030); reaching 420-500 kt in 2030 and about 700 kt in 2035.
Title band; left teal fact box for Salobo CPF, right a wide waterfall-style chart of copper volume additions with start-up labels and check marks, over a photo of thickener tanks and a plant.
Agenda divider now highlighting section 2, 'Financial Performance', with 'Opening remarks' greyed out.
Same conveyor-and-rainforest photo as page 3 with the highlight moved to the right-hand teal box.
Proforma EBITDA bridge, 3Q26 vs 3Q25, in US$ million: from 4,399 in 3Q25, Iron Ore Solutions external effects of price -673, freight -275 and FX -91, plus costs and expenses -331; VBM EBITDA contribution +418 (price +680, maintenance and other costs -190); others +61; ending at 3,508 in 3Q26, a 20% decline. Proforma EBITDA excludes Brumadinho expenses and non-recurring items; VBM price includes a positive US$18 million provisional price adjustment.
Title band; one wide teal panel with a horizontal waterfall bridge, a dashed box grouping the external effects, a dashed box detailing VBM, and a -20% bubble on a trend arrow.
C1 cash cost (US$/t, excluding third-party purchases): 20.7 in 3Q25, 24.1 in 2Q26 and 23.1 in 3Q26 (+12% y/y, -4% q/q); 2026 guidance 22.5-23.5. Main y/y effects: FX +0.8, mix and fixed cost dilution +0.6, higher diesel +0.5, Alianca Energia deconsolidation +0.3, efficiency program -0.1. All-in costs (US$/t): 50.1, 61.6 and 60.4 (+21% y/y, -2% q/q), or 59.0 adjusted for the oil hedge effect; 2026 guidance 58-62. Effects: higher freight +4.0, higher C1 +2.4, stoppage costs at Fabrica and Viga +1.0, distribution and concentration +0.5, lower all-in premiums +0.5. Guidance assumes BRL 5.13 and Brent US$86/bbl.
Title band; one teal panel split into two halves, each with a three- or four-bar chart, change bubbles, a guidance tag and a 'Main effects' bullet list.
Copper all-in costs ('000 US$/t) fell from 1.0 in 3Q25 to -0.2 in 3Q26 (-1.2) against 2026 guidance of 0.0-0.5, driven by higher by-product revenues (-1.1), fixed cost dilution at Salobo (-0.3) and the Sossego SAG mill rebuild (+0.6). Nickel all-in costs rose 18% from 12.3 to 14.6 against guidance of 10.0-11.5, due to higher external feed prices (+1.4), inventory turnover (+1.0), planned maintenance (+0.6) and higher by-product revenues (-1.2). Guidance assumes gold US$4,390/oz, BRL 5.13, copper US$13,236/t, palladium US$1,394/oz and platinum US$1,824/oz.
Title band; teal panel with copper and nickel bar pairs side by side, each with a guidance tag, a change bubble and a cost-driver bullet list; assumptions footnote at bottom.
Hedging program cash gains in 2026 (US$ million): 116 in 1Q26 (FX 70, oil 29, others 17), 337 in 2Q26 (FX 236, oil 99, others 2), 249 in 3Q26 (FX 150, oil 82, others 17) and 702 for 9M26 (FX 456, oil 210, others 36). Coverage: about 70% of oil exposure hedged for 4Q26 at about US$79/bbl, about 67% for 2027 at about US$78/bbl, about US$0.7 billion of BRL exposure hedged for 4Q26 at USD/BRL about 5.8, and about US$5.0 billion hedged for 2027 at about 5.7.
Title band; left teal panel with a stacked bar chart and legend; right a 2x2 grid of bright green stat cards.
3Q26 free cash flow bridge in US$ million: proforma EBITDA 3,508, working capital +250, cash effect of hedging +249, capex -1,250, net financial expenses and income taxes -444, associates and JVs -280, Brumadinho incurred expenses and dam decharacterization -241, others -419, giving recurring free cash flow of 1,373; non-recurring events +857 bring free cash flow to 2,230. Cash and liability management: Brumadinho and Samarco payments -459, cash management and others -2,506 (including dividends and interest on capital of US$1,676 million and debt repayment of US$830 million), and a 735 decrease in cash and equivalents. Dividends and interest on capital of US$1.7 billion were paid in September 2026.
Title band; wide teal panel with a long waterfall chart split by a dotted line into 'Cash flow' and 'Cash & liability management' sections, plus a callout box at top right and dense footnotes.
Expanded net debt moved from US$16,677 million in 2Q26 to US$16,413 million in 3Q26. Cash effects: recurring FCF -1,373, non-recurring events -857, dividends and interest on capital +1,676. Accounting effects: swaps mark-to-market -154, provisions adjustments +425, debt, leases and cash adjustments (FX, others) +19. The 3Q26 figure is comfortably positioned within the US$10-20 billion target range.
Title band; teal panel with a net debt waterfall grouped into dashed 'Cash effects' and 'Accounting effects' boxes, and a gold bracket showing the US$10-20 billion target range beside the ending bar.
Five takeaways: on track to deliver production and cost guidances (consistently delivering on operational commitments); accelerating copper growth (Salobo CPF expected to start up in 1H28); driving cost competitiveness (accelerating efficiency initiatives and capturing carve-out benefits); delivering resilience through market cycles (hedging strategy protecting FCF generation); and disciplined capital allocation (balancing capex, growth and strong shareholder returns).
Photo of a conveyor gantry over a red-earth mine on the left with a 'Key takeaways' heading; large teal panel on the right with five icon-led statements, each with a bold white headline and an italic gold subline.
Bu slayt ve temel sunum içeriği hakkında yaygın sorular.
It is Vale's 16-slide '3Q26 Performance' deck dated October 30, 2026, covering iron ore, copper and nickel operations, freight, costs, hedging, free cash flow and net debt for the third quarter of 2026. Vale filed it with the U.S. SEC as an exhibit to Form 6-K.
All financial figures are in US dollars (US$), as Vale presents them, for example proforma EBITDA of US$3,508 million and expanded net debt of US$16,413 million. Production is in million tonnes (Mt) for iron ore and thousand tonnes (kt) for copper and nickel.
Proforma EBITDA was US$3,508 million, down 20% from US$4,399 million in 3Q25. Iron ore production was 88.4 Mt and sales 86.3 Mt. Recurring free cash flow was US$1,373 million and total free cash flow US$2,230 million. Expanded net debt ended at US$16.4 billion, within the US$10-20 billion target range.
Iron ore production 335-345 Mt, copper 360-380 kt and nickel 185-200 kt. Iron ore C1 cash cost guidance is US$22.5-23.5/t and all-in cost US$58-62/t. Copper all-in cost guidance is US$0.0-0.5 thousand per tonne and nickel US$10.0-11.5 thousand per tonne.
The source PDF filed with the SEC was assembled from rasterised slide images, so the original has no selectable text. The PPTX download on this page was converted from that PDF and keeps each slide as an image, which makes it useful as a visual reference rather than a fully editable template.
The deck was furnished to the SEC on Form 6-K and is available on EDGAR under Vale S.A. (CIK 917851). Vale also publishes its quarterly results materials on its investor relations website.
Yes, as a structural reference. It shows a clean earnings-deck flow: cover, disclaimer, strategy, operational highlights by business, growth pipeline, EBITDA bridge, cost analysis, hedging, free cash flow, net debt and key takeaways. Replace Vale's branding, photos and figures with your own content.
The Form 6-K filing to which this 3Q26 Performance presentation was attached as an exhibit.

Create Your Own Slides
Turn your ideas into professional presentations in seconds with 2slides AI.
Profesyonel tasarımları referans alın, stilinizi seçin ve mükemmel metin oluşturma ile slaytlar oluşturun. Nano Banana ile desteklenir—şimdi sunumunuzu oluşturmaya başlayın.
Slaytlar için AI Ajanınız. Akıllı sunum oluşturma ile zaman kazanın, daha hızlı parlayın.


© 2026 2slides. Tüm hakları saklıdır.