
Şu koleksiyonda: Yatırımcı sunumu örnekleri
PSEG Q3 2026 Earnings Presentation: Public Service Enterprise Group's third quarter 2026 financial results deck (November 2, 2026), filed with the SEC as Exhibit 99.1 to Form 8-K. It covers Q3 net income of $0.76 per share and non-GAAP Operating Earnings of $1.15 per share, the reaffirmed 2026 guidance of $4.28-$4.40 per share, PSE&G regulated utility highlights, PSEG nuclear fleet metrics and PJM capacity auction results, credit ratings, debt maturities, liquidity and full non-GAAP reconciliations. The slides in the SEC filing are rasterized images.
Bu sunumun kapağını, kendi içeriğinizden oluşturulan slaytlar için stil referansı olarak kullanır. Ya da aşağıdan herhangi bir sayfayı seçip düzenini referans olarak kullanın.
Hızlı Navigasyon
Etiketler
Slaytları paylaş
PSEG Q3 2026 Earnings Presentation: Public Service Enterprise Group's third quarter 2026 financial results deck (November 2, 2026), filed with the SEC as Exhibit 99.1 to Form 8-K. It covers Q3 net income of $0.76 per share and non-GAAP Operating Earnings of $1.15 per share, the reaffirmed 2026 guidance of $4.28-$4.40 per share, PSE&G regulated utility highlights, PSEG nuclear fleet metrics and PJM capacity auction results, credit ratings, debt maturities, liquidity and full non-GAAP reconciliations. The slides in the SEC filing are rasterized images.
Her slayt sayfasının detaylı görünümü, düzen, temel içerik ve görsel öğeler dahil.
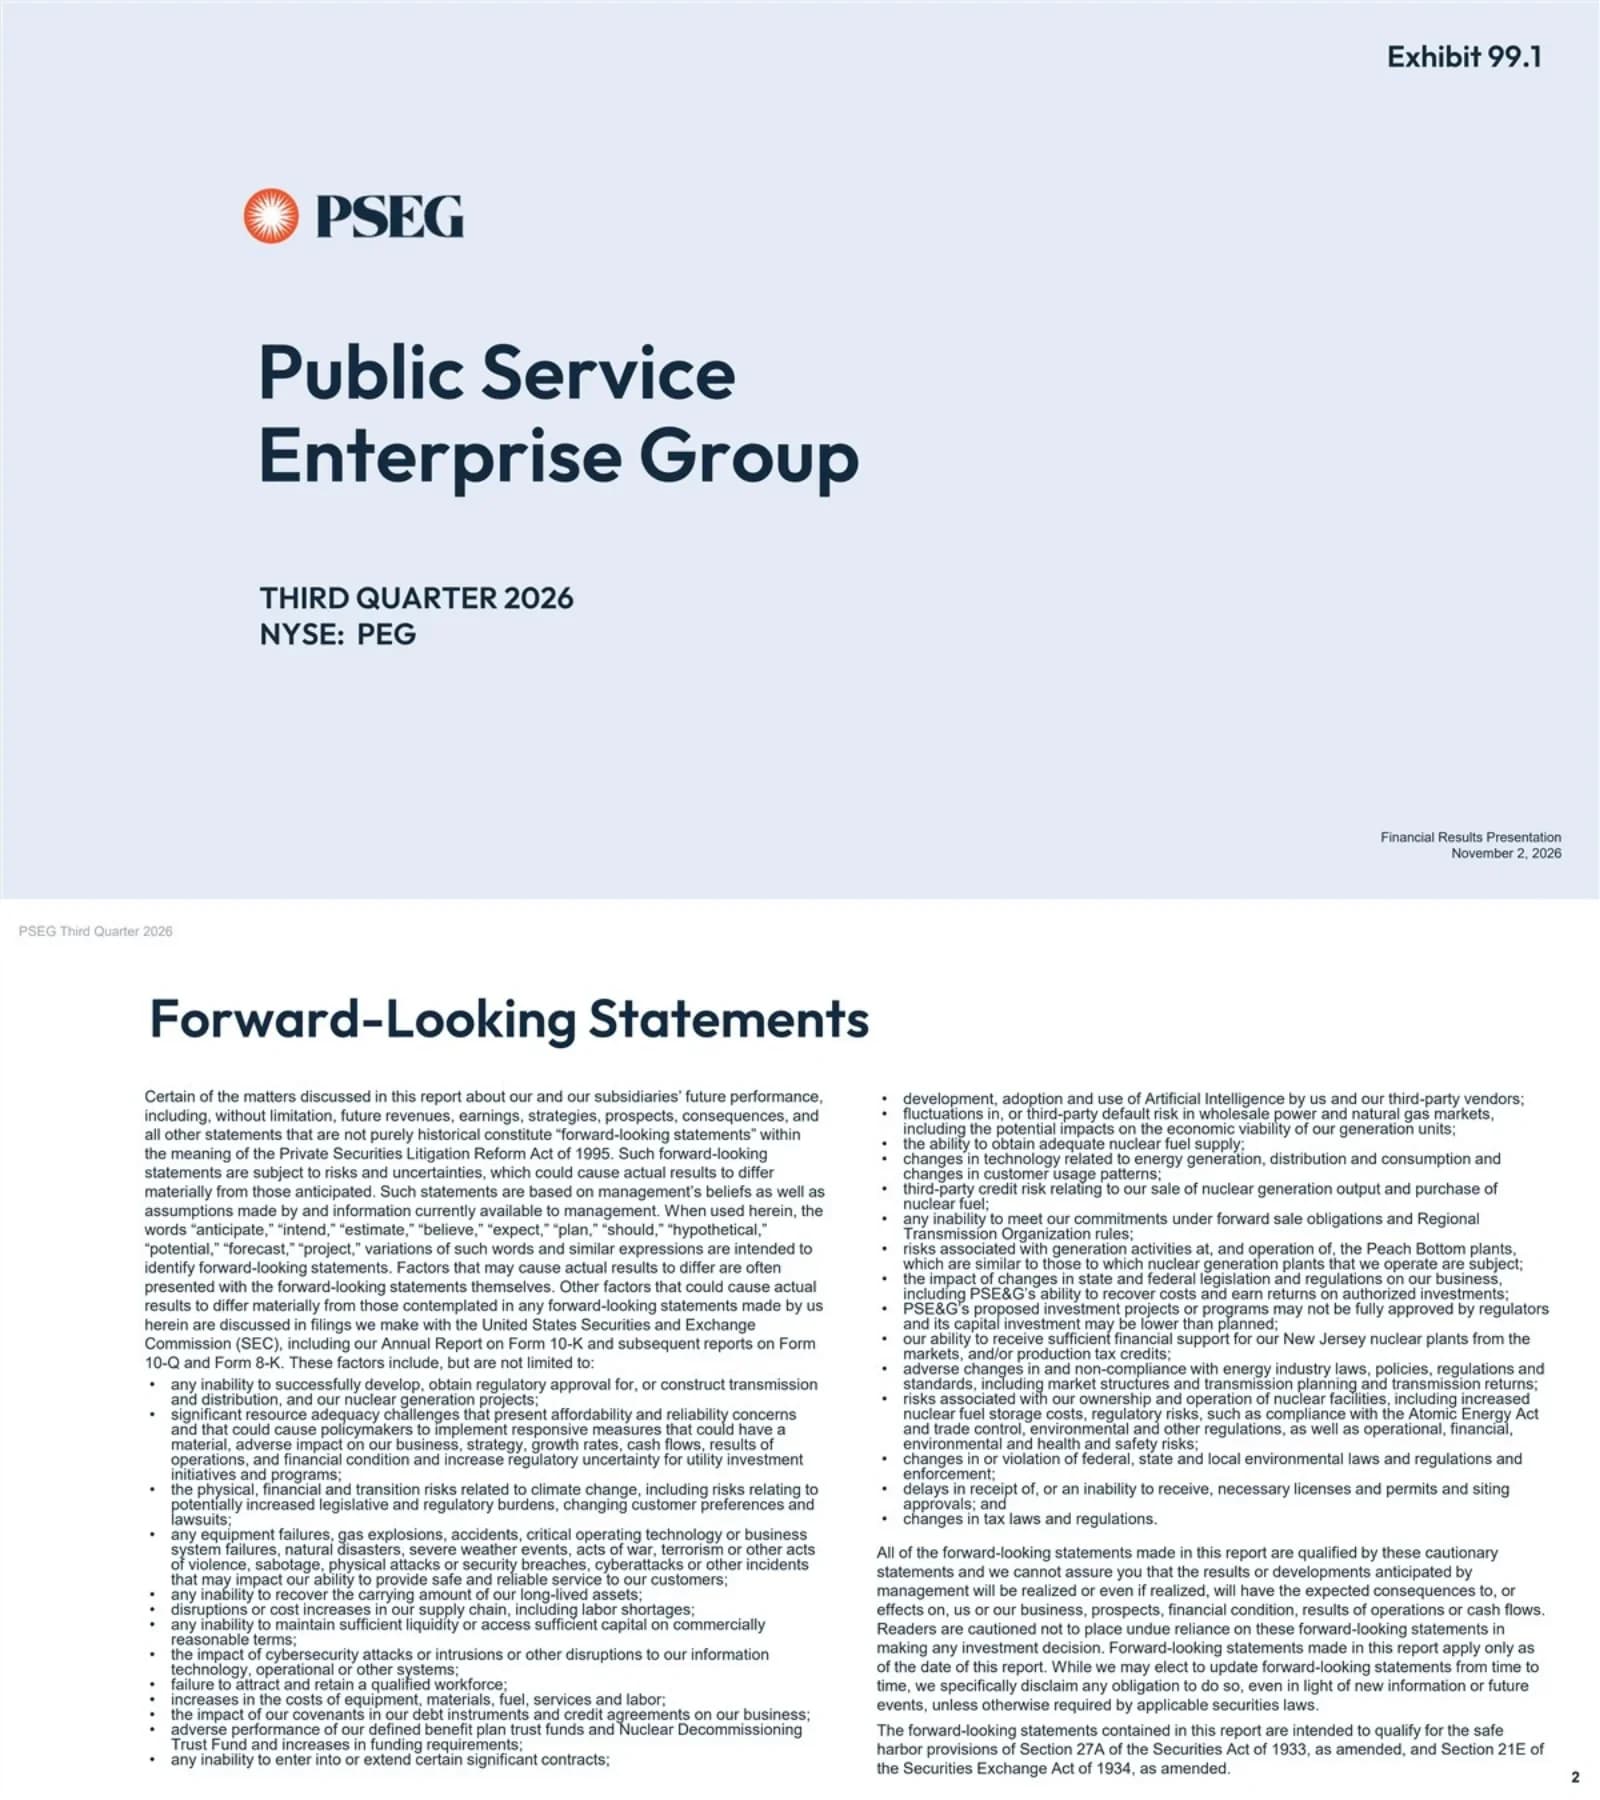
Cover slide with the PSEG sunburst logo, the company name Public Service Enterprise Group, 'Third Quarter 2026' and the ticker NYSE: PEG; the corner notes 'Exhibit 99.1' and 'Financial Results Presentation, November 2, 2026'.
Pale blue-grey full-bleed background, logo top-left, large two-line navy company name left-aligned, period and ticker beneath, exhibit label top-right and date bottom-right.
Safe-harbor legal text under the Private Securities Litigation Reform Act of 1995 listing risk factors: approval and construction of transmission, distribution and nuclear projects, resource adequacy and affordability concerns, climate risk, equipment failures and cyberattacks, supply chain costs, liquidity, AI adoption, wholesale power and gas markets, nuclear fuel supply, Peach Bottom operations, state and federal regulation, PSE&G cost recovery, New Jersey nuclear plant support and production tax credits, and tax law changes.
Two-column dense text: an introductory paragraph and a long bullet list running across both columns, with closing disclaimer paragraphs at the bottom right.
Explains that PSEG reports non-GAAP Operating Earnings, which exclude gains and losses on the Nuclear Decommissioning Trust (NDT), mark-to-market (MTM) accounting and other material infrequent items, and defines non-GAAP Funds From Operations (FFO) and non-GAAP Debt used in the FFO/Debt target; guidance is stated as of November 2, 2026. A shaded box points investors to investor.pseg.com and its email alerts.
Two text columns of definitions with a light-blue callout band across the bottom containing investor relations website links.
Financial results: Q3 2026 net income of $0.76 per share ($2.91 YTD) and non-GAAP Operating Earnings of $1.15 per share ($3.56 YTD), with 2026 non-GAAP Operating Earnings guidance maintained at $4.28-$4.40 per share. Operations: PSE&G handled the Fourth of July weekend storms and a September nor'easter, won the 2026 Escalent Most Trusted Utility Brand award for a third consecutive year, PSEG Nuclear posted a 95.5% capacity factor in the quarter (94.3% YTD), and Salem Unit 1 completed a 491-day breaker-to-breaker run. Investment: about $1.1 billion of regulated investment in Q3, a ~$4.2 billion 2026 regulated capex plan on track, and a $24B-$28B 2026-2030 capital program that is over 90% regulated.
Single text column with three orange subheadings (Financial Results & Guidance, Operational Excellence, Disciplined Investment) each followed by bullet points; the guidance bullet is bolded.
Three-pillar investment thesis. Steady Execution: long-term non-GAAP Operating Earnings CAGR of 6%-8% through 2030, a $24B-$28B 2026-2030 capital program (>90% regulated), rate base CAGR of 6%-7.5%, no equity issuance or asset sales needed to fund the plan, nuclear hedging, and 21 consecutive years meeting or beating guidance. Alignment with NJ Energy Policy: cost control for affordability, reliability-focused capital, jobs in New Jersey, best-in-class operations and transparency on connecting renewables. Energy Solutions Provide Upside: contracting nuclear output above market prices, competitive transmission wins, grid connections for solar and battery storage, and regulated or contracted supply opportunities.
Three equal columns, each with a dark navy header bar in orange italic serif type above a light-blue panel of bullet points.
Section divider introducing the Q3 2026 results review.
Full-bleed dark navy background with a large orange diagonal arrow on the left, 'Q3 2026' in white bold sans-serif and 'Review' in orange italic serif.
Three months ended September 30 ($ millions). Net income: PSE&G $506 vs $515 (-$9); PSEG Power & Other -$130 vs $107 (-$237); total PSEG $376 vs $622 (-$246). Non-GAAP Operating Earnings: PSE&G $506 vs $515 (-$9); PSEG Power & Other $68 vs $50 (+$18); total PSEG $574 vs $565 (+$9).
Two stacked financial tables with grey header rows (segment, 2026, 2025, Change) and bold total rows, under a centered summary subtitle.
Waterfall bridging Q3 2025 net income of $1.24 per share and Q3 2025 operating earnings of $1.13 to Q3 2026 operating earnings of $1.15 and net income of $0.76. PSE&G contributed -$0.02 (transmission +0.02, distribution margin +0.03, O&M -0.01, depreciation and interest -0.02, taxes and other -0.04); PSEG Power & Other contributed +$0.04 (gross margin +0.04, O&M +0.02, depreciation and interest flat, taxes and other -0.02).
Vertical bar waterfall chart with a $/share axis; grey bars for net income, orange bars for operating earnings, small floating bars with boxed driver breakdowns for each segment.
Nine months ended September 30 ($ millions). Net income: PSE&G $1,425 vs $1,393 (+$32); PSEG Power & Other $26 vs $403 (-$377); total PSEG $1,451 vs $1,796 (-$345). Non-GAAP Operating Earnings: PSE&G $1,425 vs $1,393 (+$32); PSEG Power & Other $352 vs $274 (+$78); total PSEG $1,777 vs $1,667 (+$110).
Same two-table layout as the Q3 results slide, applied to year-to-date figures.
Waterfall from YTD 2025 net income of $3.59 per share and YTD 2025 operating earnings of $3.33 to YTD 2026 operating earnings of $3.56 and net income of $2.91. PSE&G added $0.07 (transmission +0.03, distribution margin +0.14, O&M -0.03, depreciation and interest -0.06, taxes and other -0.01); PSEG Power & Other added $0.16 (gross margin +0.13, O&M +0.08, depreciation and interest -0.03, taxes and other -0.02).
Same waterfall design as the Q3 bridge with a $0-$4.00 per share axis and boxed driver details.
Operations: residential electric customers up ~1% and gas customers flat over the trailing 12 months; weather-normalized electric sales up ~1% and gas sales down ~3%; ~167 miles of gas main and ~21,435 services replaced, with methane emissions down over 34% from 2018-2025 through GSMP. Financial: ~$1.1 billion regulated investment in Q3 and ~$4.2 billion 2026 plan on track. Regulatory: work with the Sherrill Administration on two Executive Orders and a planned BPU filing on regulatory lag; residential gas heating bills cut 5% from October 1, 2026; PJM to reduce wholesale transmission costs after a PSE&G-led FERC effort with a retail credit filing expected early 2027; a transmission formula rate update adding ~$60 million of annual revenue from January 1, 2027; energy efficiency Triennium 2.5 extension (7/1/2027-6/30/2028); refunds of 2024 Zero Emission Certificates; BPU-approved $14 million (IAP) and $8 million (CEF-EV) revenue increases effective October 1, 2026; and a BPU Phase 2 report on New Jersey's utility business model expected early 2027.
Split layout: left side has the orange arrow motif, PSE&G title in navy and orange italic serif, and Operations and Financial bullets above a navy arrow-pattern block; right column lists Regulatory and Market Environment bullets.
Nuclear generation measures: capacity factor 95.5% in Q3 2026 vs 92.4% (94.3% vs 93.7% YTD); fuel cost $59M vs $53M ($167M vs $154M YTD); generation 8,172 GWh vs 7,903 GWh (23,948 vs 23,769 YTD); fuel cost $7.18/MWh vs $6.68 ($6.96 vs $6.49 YTD). PJM capacity auction results: $270/MW-day for June 2025-May 2026, $329 for 2026/27, $333 for 2027/28 and $325 for 2028/29 on 3,500-3,600 MW cleared. Financial considerations: 2026 nuclear generation forecast of 30-32 TWh, over 95% of 2026 output hedged, Hope Creek fuel cycle extended to 24 months, a ~200 MW Salem uprate (~112 MW PSEG share), planned 20-year license extensions to 2056, 2060 and 2066, and data center/PPA optionality above the production tax credit. An illustrative table shows gross margin upside of $100M-$1,500M for 10-30 TWh at $10-$50/MWh above the PTC.
Dense four-quadrant layout: nuclear metrics table top-left, PJM capacity auction table bottom-left, Financial Considerations bullets top-right and an illustrative gross margin sensitivity grid bottom-right, all with navy header bars.
Section divider marking the start of the appendix.
Dark navy full-bleed background with the orange arrow motif and the word 'Appendix' in large white sans-serif.
Credit ratings: PSEG senior unsecured Baa2/BBB (stable), PSE&G senior secured A1/A (stable), PSEG Power senior unsecured Baa2/BBB (stable). Debt: PSEG long-term debt $5.82B, PSE&G long-term debt $17.11B, PSEG Power 364-day term loan $0.50B and long-term debt $1.64B; consolidated debt to capitalization 60%. Liquidity: about $3.9B available including $837M of cash, variable-rate debt ~3% of total, and PSEG Power net cash collateral postings of $610M. A stacked bar chart shows the 2026-2030 maturity profile by entity (no maturities in 2026, roughly $1.1-1.3B a year in 2027-2029 and about $2.2B in 2030; individual bar values are not labeled, so these are read off the axis). Footnotes note the term loan was increased to $500 million and extended to December 2026, and that PSEG Power issued $400 million of 5.55% Senior Notes due September 2031.
Left half: stacked navy-header panels with ratings text and grey value bars, plus a liquidity bullet panel; right half: PSE&G ratings panel and a stacked column chart of debt maturities; small-print footnotes along the bottom.
Credit facility table ($ millions): PSE&G $1,000 revolver (March 2031) with $27 used and $973 available; PSEG Money Pool revolvers of $1,500 for PSEG ($595 used, $905 available) and $1,250 for PSEG Power ($58 used, $1,192 available), both expiring March 2031, plus a $75 PSEG Power letter of credit facility (March 2028). Total facilities $3,825 with $742 used and $3,083 available; adding $44 money pool cash and $793 PSE&G cash gives total liquidity available of $3,920 and money pool liquidity of $2,154. Footnotes describe the $2.75B master facility sub-limits and PSEG Power's $425 million uncommitted facilities.
Wide financial table with company, facility, expiration date, total, usage and available columns; totals stacked at the bottom right with Total Liquidity Available highlighted in an orange-bordered box.
Glossary of about 40 abbreviations used in the deck, from AFUDC, BGS, BPU, CAGR, CWIP and FERC to PJM, PTC, RBP, UCAP and ZEC, plus PSEG Investor Relations contact details (80 Park Plaza, Newark NJ 07102) and links to the investor relations and sustainability websites.
Three columns: two glossary columns of acronym and definition pairs separated by thin vertical rules, and a right column with the IR address and two play-button style links.
Consolidated reconciliation ($ millions, unaudited): Q3 2026 net income of $376 plus a $21 NDT loss and a $251 MTM loss, less $74 of related taxes, gives operating earnings of $574 (Q3 2025: $622 to $565). Nine months: $1,451 to $1,777 (2025: $1,796 to $1,667). Diluted shares of 499 million vs 501 million; per share, Q3 net income $0.76 to operating earnings $1.15 (2025: $1.24 to $1.13) and YTD $2.91 to $3.56 (2025: $3.59 to $3.33).
Bordered accounting-style reconciliation table with quarter and nine-month column groups, a dollar block and a per-share block, with explanatory footnotes in a narrow right-hand column.
PSEG Power & Other reconciliation ($ millions, unaudited): Q3 2026 net loss of $130 adjusted for the $21 NDT loss, $251 MTM loss and -$74 taxes gives operating earnings of $68 (Q3 2025: $107 to $50); nine months $26 to $352 (2025: $403 to $274), on 499 million diluted shares (501 million in 2025).
Single bordered reconciliation table in the same accounting style as Slide A, with footnotes on the right and empty space below.
Bu slayt ve temel sunum içeriği hakkında yaygın sorular.
PSEG reported Q3 2026 net income of $376 million, or $0.76 per share, versus $622 million ($1.24) a year earlier. Non-GAAP Operating Earnings were $574 million, or $1.15 per share, versus $565 million ($1.13). The gap between the two comes mainly from a $251 million pre-tax mark-to-market loss and a $21 million Nuclear Decommissioning Trust loss.
No. The deck says PSEG is maintaining 2026 non-GAAP Operating Earnings guidance of $4.28-$4.40 per share, with year-to-date operating earnings at $3.56 per share. It also repeats a long-term operating earnings CAGR outlook of 6%-8% through 2030.
It is PSEG's Third Quarter 2026 Financial Results Presentation dated November 2, 2026, filed with the SEC as Exhibit 99.1 to Public Service Enterprise Group's Form 8-K. The slides in the filing are rasterized images, which is how they appear in the downloadable PDF.
PSEG plans $24B-$28B of capital spending for 2026-2030, more than 90% of it regulated, supporting rate base growth of 6%-7.5% a year. Regulated investment was about $1.1 billion in Q3 and the 2026 regulated plan of about $4.2 billion is on track. Management says it can fund the plan without issuing equity or selling assets.
PSEG Nuclear ran at a 95.5% capacity factor in Q3 2026 (94.3% year to date) and generated 8,172 GWh in the quarter; 2026 output is forecast at 30-32 TWh with over 95% hedged. PSEG cleared about 3,500 MW in PJM capacity auctions at $329/MW-day for June 2026-May 2027 and $333/MW-day for 2027/28.
Yes, as a structural reference. It shows a compact utility earnings deck: highlights, investment thesis, segment results tables, EPS waterfall bridges, a segment KPI page, balance sheet and liquidity slides, a glossary and GAAP to non-GAAP reconciliations. You can download the PDF and use 2Slides to build your own deck following the same layout.
PSE&G is the regulated New Jersey electric and gas utility, which earned $506 million in Q3 2026. PSEG Power & Other includes the nuclear generating fleet, gas supply operations, PSEG Long Island, competitively bid transmission investments and the parent company; it posted $68 million of operating earnings but a $130 million GAAP net loss due to mark-to-market and NDT items.
Total liquidity available was $3,920 million, made up of $3,083 million of unused credit facilities, $793 million of PSE&G cash and short-term investments and $44 million of money pool cash. Consolidated debt to capitalization was 60%, and PSE&G's senior secured debt is rated A1 by Moody's and A by S&P.
Original filing of this presentation as an exhibit to Public Service Enterprise Group's Form 8-K.
Company investor relations site referenced in the deck for earnings materials and email alerts.

Create Your Own Slides
Turn your ideas into professional presentations in seconds with 2slides AI.
Profesyonel tasarımları referans alın, stilinizi seçin ve mükemmel metin oluşturma ile slaytlar oluşturun. Nano Banana ile desteklenir—şimdi sunumunuzu oluşturmaya başlayın.
Slaytlar için AI Ajanınız. Akıllı sunum oluşturma ile zaman kazanın, daha hızlı parlayın.


© 2026 2slides. Tüm hakları saklıdır.