
Palo Alto Networks Q4 Fiscal 2026 Earnings Presentation
Hızlı Navigasyon
Etiketler
Slaytları paylaş
Palo Alto Networks Q4 Fiscal 2026 Earnings Presentation
Her slayt sayfasının detaylı görünümü, düzen, temel içerik ve görsel öğeler dahil.
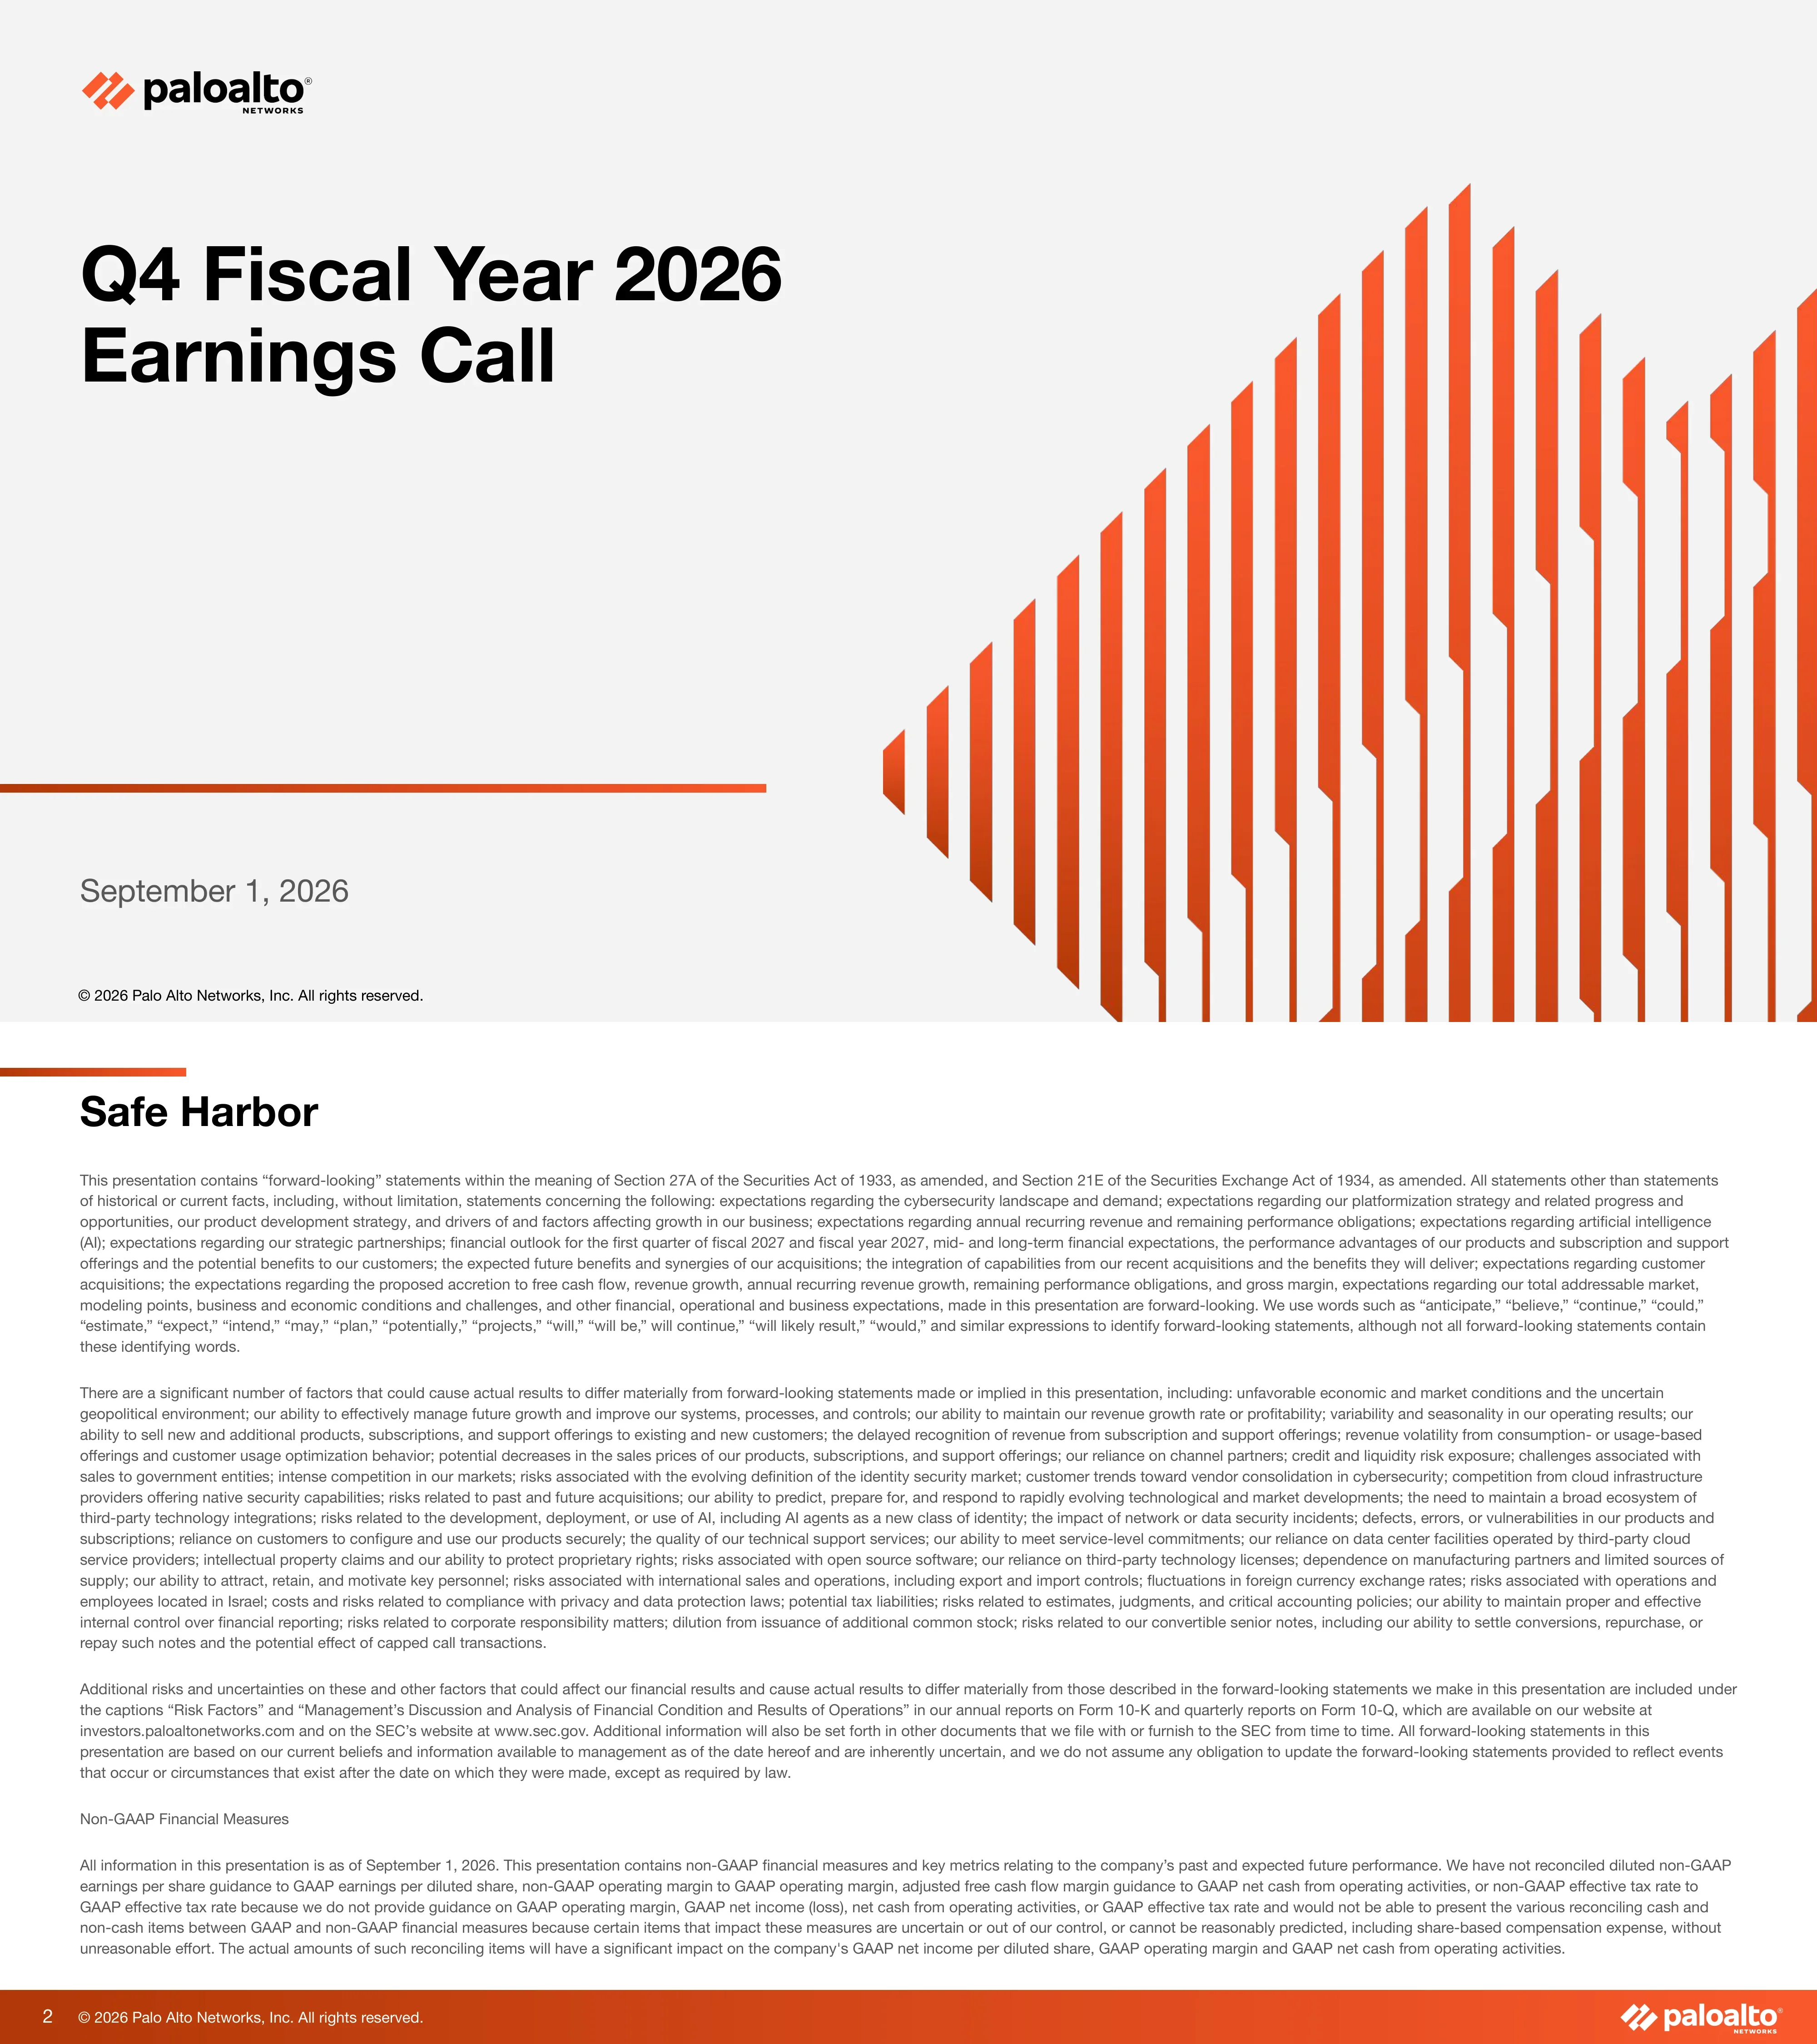
Cover slide for Palo Alto Networks' Q4 fiscal year 2026 earnings call, dated September 1, 2026.
Light gray background; paloalto logo top left; large bold black two-line title on the left; thin orange horizontal rule above the date; right half filled with a stepped mountain of orange-to-rust vertical bars.
Forward-looking statements disclaimer covering platformization, ARR/RPO, AI, FY'27 outlook and acquisitions, plus a list of risk factors and a non-GAAP measures note stating all information is as of September 1, 2026.
Text-only slide: orange accent bar top left, bold title, four dense paragraphs of small gray body text across the full width, orange gradient footer with page number and logo.
Speaker introduction slide for Nikesh Arora, CEO & Chairman, which opens the CEO part of the call.
White background; large black name and orange all-caps title on the left with the logo below; cut-out portrait photo on the right, set over rising orange vertical bars that fade to white.
Q4'26 highlights: total RPO $21.2B (+34% y/y), NGS ARR $9.10B (+63%), total revenue $3.41B (+34%), ~$970M net new NGS ARR (+98%) and ~220 net new platformizations (+44%). FY'26 non-GAAP operating margin was 29.2% (+40 bps), adj. FCF margin 38.4% ($4.41B, +26%) and non-GAAP EPS $3.84 (+15%).
Three horizontal rows split by thin gray rules; each row has a large orange theme headline on the left and two or three rounded, orange-outlined KPI cards on the right, each showing a value, label and y/y change; footnotes define NGS ARR.
Total platformizations grew from ~1,000 in Q4'24 to ~1,400 (Q4'25), ~1,450, ~2,160 (pro forma), ~2,280 and ~2,500 in Q4'26 (~1,830 NetSec & Cortex plus ~670 Identity & Observability). Callouts: ~220 record net new in Q4, >120% net retention among platformized customers and >65% of NGS ARR from platformized customers. The company says it is on track for 4K+ platformizations driving most of $20B NGS ARR by FY'30.
Left panel: stacked bar chart over six quarters (orange for NetSec & Cortex, dark gray for Identity & Observability). Middle: three stacked stat cards with large orange numbers. Right: a large callout card with orange-highlighted target text.
Four anonymized deals: Telecommunications Leader $126M (full NetSec platformization plus Idira and XSIAM cross-sell), Global Technology Services $72M, Global Payments Platform $53M (nearly $10M in AIRS) and Regional Bank $42M (Cortex XSIAM and Agentic Endpoint Security). Customers with >$5M NGS ARR: 223 (+45% y/y); with >$10M: 78 (+50% y/y).
2x3 card grid: four white, orange-outlined deal cards with a gray industry heading, a large orange deal value and a short description, plus two pink-tinted stat cards in the right column.
A 2026 timeline of AI inflections: January 'The Open Claw Catalyst' (agentic AI creates more traffic, data and credentials to secure), April 'The Mythos Moment' (AI used to find and exploit vulnerabilities) and June 'Open Weight Models Normalize' (every AI deployment adds attack surface).
Three full-width stacked white cards with soft orange shadows; each has a centered orange headline and centered gray body text with the key phrase in bold.
Total firewall bookings growth (HW+SW) rose from 13% in FY'25 to 17% in FY'26. Software firewall AI traffic is up >4x since June'26, NGFW competitive displacements reached >$250M in FY'26 TCV and software firewall ARR grew 29% in Q4. In SASE: agentic traffic grew >9x over 9 months, competitive displacements reached ~$450M TCV (~2x y/y), Prisma Access bookings grew >30%, SD-WAN >80%, and Secure Browser licenses >2x to ~15M.
Two rounded panels. Left: two-bar chart (FY'25 vs FY'26) with a trend arrow and three KPI cards below. Right: two KPI cards on top and a gray-gradient 'Strong Growth Across the SASE Platform' band with three product cards.
Prisma AIRS reached ~$120M ARR within one year of general availability, with >800 customers (>2x q/q) and >100 Agentic Endpoint Security logos (up ~2.5x since the Koi close). A timeline shows the platform growing from four capabilities at the April 2025 launch to 14 today, including agent red teaming, AI agent gateway and agentic identity security.
Left panel: rising cyan wedge from 'Apr'25' to 'Today' with stacked capability label boxes under each milestone and a gray arrow banner at the bottom. Right: three cyan-outlined stat cards with large cyan numbers. Orange 'Spotlight |' prefix in the title.
XSIAM ARR grew from >$400M in FY'25 to >$700M in FY'26 (~70% y/y), with ~1K customers (>2x y/y) and +45% y/y growth in $10M+ deals. Observability (Chronosphere) ARR grew from >$200M in Q2'26 to >$500M in Q4'26 (>2.5x), including a $20M deal with a fast-growing AI inference provider. 50% of Q4 Observability net new logos included an XSIAM cross-sell in 2H'26.
Two green-tinted rounded panels, each with a two-bar green chart, an angled growth arrow label and two KPI cards below with large green numbers.
CyberArk ACV growth rose from 20% in Q2'26 to 27% in Q4'26, and Secrets & AI bookings grew ~40% in FY'26. Integration results: >400 shared leads between PANW and CYBR sales teams (up ~50% from May 2026), >200 CyberArk new logo wins from the core PANW installed base, and +50% y/y more $5M+ deals in Q4'26.
Two rounded panels in the blue identity color. Left: two-bar blue chart with an arrow and a KPI card below. Right: three stacked stat cards with large blue numbers and italic descriptions.
Three forward-looking theses: more capex will be deployed in the next 5 years than in the last 25; AI raises the urgency to modernize one trillion dollars of legacy security infrastructure within a decade; and agents will drive much more traffic, creating a new platform for AI security.
Three full-width stacked white cards with soft shadows, each holding one centered sentence in bold orange text.
Speaker introduction for CFO Dipak Golechha, marking the handoff to the financial results section.
Same template as the CEO slide: large black name and orange all-caps role on the left with the logo, and a cut-out portrait on the right over fading orange vertical bars.
Five-quarter trends: total RPO grew from $15.8B (Q4'25) to $21.2B (Q4'26, +34%); NGS ARR from $5.58B to $9.10B (+63%), with a ~$970M record net new ARR callout; revenue from $2,536M to $3,410M (+34%, up from 16% growth a year earlier).
Three side-by-side panels, each a combo chart with bars for the metric and a dot-line for y/y growth: green for RPO, orange for NGS ARR (dashed box around Q3-Q4 and a gray callout band) and yellow for revenue.
FY'26 vs FY'25 revenue by platform: Network & AI Security $7.13B to $8.35B (+17%), Cortex $1.54B to $1.92B (+25%), and Idira pro forma $1.04B to $1.26B (+21% pro forma growth; $0.61B reported).
Three equal panels with two-bar charts and arrows, each with a gray band showing the growth rate in the platform color: orange, green and blue.
Non-GAAP operating margin over five quarters: 30.3%, 30.2%, 30.3%, 27.1% (Q3'26) and 29.6% (Q4'26). TTM adj. FCF margin: 38.0%, 39.3%, 37.9%, 38.5% and 38.4%.
Two centered rounded panels (yellow and green-tinted borders), each with a single gray dot-line chart with data labels across Q4'25 to Q4'26.
Non-GAAP operating margin rose from 24.1% (FY'23) to 27.3%, 28.8% and 29.2% (FY'26), described as over 500 bps of expansion, with a ~26% op-income CAGR. Adj. FCF margin held at 38.8%, 38.9%, 38.0% and 38.4%, with a ~18% adj. FCF CAGR. The slide reaffirms a 40%+ FY'28 adj. FCF margin target.
Two panels, each with a subtitle band and a four-bar chart (orange for operating margin, green for FCF margin), both funneling into a full-width bottom banner with the target in orange.
TAM grows from $19B in 2018 (firewall only) to ~$200B in 2025 ($59B firewall/SASE, $117B SOC/observability/cloud, $29B identity) and ~$340B in 2030 ($90B Network & AI Security, $180B Cortex, $67B Idira). The company reaffirms $20B NGS ARR by FY'30.
Three stacked bars on a gray timeline arrow (2018, 2025, 2030), segmented orange/green/blue with white labels; a dark gray gradient callout card on the right; small source footnotes (Gartner, IDC, Dell'Oro and others).
Guidance vs actual for Q4'26: revenue $3.41B (34% y/y) vs $3.345-3.355B guidance; RPO $21.2B vs $20.9-21.0B; NGS ARR $9.10B (63%) vs $8.90-8.95B; non-GAAP EPS $1.02 vs $0.96-0.98. Also reported: product revenue $738M, non-GAAP gross margin 74.8%, non-GAAP operating income $1,011M (29.6% margin), GAAP EPS ($0.35) and adj. FCF $1,289M.
Three-column table: gray row labels, a dark gray 'Guidance' header column and an orange 'Actual' header column with orange values on a pink tint. Green circular checkmarks mark the four metrics that beat guidance.
Q1'27 guidance: NGS ARR $9.54-9.56B (63% y/y), RPO $20.8-20.9B, revenue $3,300-3,310M (33-34%) and non-GAAP EPS $0.96-0.98. FY'27 guidance: NGS ARR $11.075-11.175B (22-23%), RPO $25.2-25.4B, revenue $14.10-14.20B (23-24%), non-GAAP operating margin 29.5% (+30 bps), EPS $4.16-4.19 and adj. FCF margin 38.0%.
Table with gray metric labels on the left and two orange-headed columns (Q1'27, FY'27) on a light peach background; orange values with black y/y sublabels.
Section divider opening the question-and-answer session.
Full-bleed orange-to-rust gradient with an embossed stepped vertical-bar pattern; centered bold white 'Q&A'; copyright and white logo in the footer.
Section divider introducing the appendix of modeling points, platform revenue and non-GAAP reconciliations.
Same full-bleed orange gradient divider with the vertical-bar pattern and centered bold white 'Appendix'.
Q1'27 and FY'27 non-GAAP tax rate of 22%; Q1'27 net interest and other income of $75-80M; diluted shares of 837-844M (Q1'27) and 844-847M (FY'27); 2H FY'27 is expected to be 60-61% of net new NGS ARR. FY'27 platform points: Network & AI Security growth in the low double digits, Cortex ~30%, and Idira ~$1.5B (high-teens to 20% pro forma growth).
Bullet list slide with large gray text, orange round bullets and hollow sub-bullets; a small tax-rate footnote at the bottom.
Quarterly FY'26 revenue by platform ($M): Network & AI Security $1,904 / $2,025 / $2,094 / $2,331 (FY $8,354 vs $7,131); Cortex 422 / 431 / 481 / 586 (FY 1,920); Idira 278 in Q3 and 336 in Q4 (FY 614); Other 592. Total FY'26 revenue was $11,480M vs $9,221M. Definitions of each platform follow.
Financial table with an orange header bar and separate quarterly and fiscal-year column groups, underlined totals; below it, bulleted definitions with platform names in orange.
GAAP gross margin of 67.6% in Q4'26 (73.2% in Q4'25) reconciles to non-GAAP 74.8% (75.8%), mainly through $184M of acquired-intangible amortization. On a full-year basis, GAAP gross margin of 70.4% reconciles to non-GAAP 75.8% for FY'26 (76.4% for FY'25).
Reconciliation table with an orange header split into $ and % sub-columns for Q4'25, Q4'26, FY'25 and FY'26; indented adjustment rows; bold totals with double rules; footnotes.
Quarterly bridge from GAAP operating income ($497M, $309M, $397M, ($183M), $172M) to non-GAAP ($768M at 30.3%, $746M at 30.2%, $785M at 30.3%, $814M at 27.1% and $1,011M at 29.6%) for Q4'25 through Q4'26. Adjustments cover share-based compensation, acquisition costs, amortization and litigation.
Wide five-quarter table with an orange header and $/% sub-columns; adjustment rows indented; bold non-GAAP total row.
Annual bridge: GAAP operating margin of 5.6%, 8.5%, 13.5% and 6.1% (FY'23-FY'26) reconciles to non-GAAP operating income of $1,660M (24.1%), $2,190M (27.3%), $2,652M (28.8%) and $3,356M (29.2%). FY'26 share-based compensation was $1,712M and amortization $638M.
Four-year reconciliation table with an orange header, $/% sub-columns, six adjustment rows and a bold total row.
GAAP diluted EPS of ($0.35) in Q4'26, $1.60 in FY'25 and $0.40 in FY'26 reconciles to non-GAAP $1.02, $3.34 and $3.84. Adjustments include share-based compensation ($2.23 in FY'26), amortization ($0.84), the change in fair value of convertible notes and capped calls ($0.74) and tax adjustments (-$0.78).
Narrow three-column EPS table with a full-width orange header row; indented adjustment lines; underlined bold total row; four footnotes.
Q4'26 operating cash flow was $1,357M, FCF $1,254M and adj. FCF $1,289M (37.8% margin). TTM Q4'26 operating cash flow was $4,553M and adj. FCF $4,414M (38.4%), after adding back HQ capex ($91M), corporate assets ($42M), acquisition-cost payments ($164M) and litigation ($4M).
Table with an orange header: two quarterly columns separated from five TTM columns; italic margin row at the bottom; footnotes on the add-backs.
Annual adj. FCF: $2,671M (FY'23, 38.8%), $3,121M (FY'24, 38.9%), $3,507M (FY'25, 38.0%) and $4,414M (FY'26, 38.4%). FY'26 operating cash flow was $4,553M, less $440M capex.
Four-year table with an orange header, indented add-back rows, bold totals and an italic margin row; footnotes at the bottom.
Compares PANW's NGS ARR, which is based on revenue recognized under ASC 606 and excludes hardware and legacy offerings, with CyberArk's previous subscription ARR, which was based on annualized bookings regardless of revenue recognition and covered SaaS and self-hosted subscriptions.
Two side-by-side bordered boxes: an orange-bordered peach-gradient box (PANW) and a cyan-bordered light-blue gradient box (CYBR), each with a colored heading, a thin divider and centered definition text with bold key terms.
Closing slide with a copyright and proprietary information notice.
Full-bleed orange gradient with the embossed vertical-bar pattern, centered bold white 'Thank You' and the white logo bottom right.
Bu slayt ve temel sunum içeriği hakkında yaygın sorular.
It has 32 landscape 16:9 slides: a cover and safe harbor, the CEO section (FY'26 highlights, platformizations, largest deals, AI inflections, and NetSec, Prisma AIRS, Cortex and Idira updates), the CFO section (top-line trends, platform revenue, margins, TAM, Q4 metrics summary and FY'27 guidance), a Q&A divider, and an appendix with modeling points, platform revenue and GAAP-to-non-GAAP reconciliations.
The deck reports Q4'26 total revenue of $3.41B (+34% y/y), NGS ARR of $9.10B (+63%), total RPO of $21.2B (+34%), ~$970M net new NGS ARR, non-GAAP EPS of $1.02 and adjusted free cash flow of $1,289M. For all of FY'26, it shows a 29.2% non-GAAP operating margin, a 38.4% adjusted FCF margin and $3.84 non-GAAP EPS.
Slide 20 lists FY'27 guidance: NGS ARR of $11.075-11.175B, RPO of $25.2-25.4B, revenue of $14.10-14.20B, a 29.5% non-GAAP operating margin, non-GAAP EPS of $4.16-4.19 and a 38.0% adjusted FCF margin. It also gives Q1'27 ranges. These are company figures as of September 1, 2026, not investment advice.
The deck tells its story first and puts the proof after it. Opening KPI cards summarize the quarter, one slide covers each business segment, a guidance-vs-actual table uses checkmarks to show beats, a single guidance table follows, and the detailed reconciliations sit in the appendix. Each segment keeps its own color throughout (orange for Network & AI Security, green for Cortex, blue for Idira), which helps readers follow a segment across many charts.
It uses a clean corporate style: white slides, a short orange accent bar at top left, bold black sans-serif headlines, rounded cards with soft orange shadows, and an orange-to-rust gradient footer with the page number and logo. Section dividers are full-bleed orange with an embossed stepped vertical-bar pattern, and the CEO and CFO intro slides use cut-out portraits over fading orange bars.
The deck uses stacked bar charts (platformizations, TAM), bar-plus-line combo charts for metrics and y/y growth (RPO, NGS ARR, revenue), two-bar before/after comparisons with trend arrows (firewall bookings, XSIAM, Observability, CyberArk ACV, platform revenue), line charts for margins, a timeline wedge for Prisma AIRS, and financial tables for guidance and reconciliations.
Yes. The original PDF is available to download, along with an editable PPTX that was machine-converted from the PDF. The PPTX lets you reuse the layouts, but because it was converted automatically, some text boxes, charts and spacing may need touching up.
Palo Alto Networks published it for its Q4 fiscal year 2026 earnings call on September 1, 2026. It is available on the company's investor relations site at investors.paloaltonetworks.com.
Official source of the Q4 Fiscal Year 2026 Earnings Call presentation (September 1, 2026).

Create Your Own Slides
Turn your ideas into professional presentations in seconds with 2slides AI.
Profesyonel tasarımları referans alın, stilinizi seçin ve mükemmel metin oluşturma ile slaytlar oluşturun. Nano Banana ile desteklenir—şimdi sunumunuzu oluşturmaya başlayın.
Your AI Agent for slides. Save time, shine faster with intelligent presentation creation.




© 2026 2slides. All rights reserved.