
Şu koleksiyonda: Yatırımcı sunumu örnekleri
Micron Technology's fiscal Q4 2026 earnings presentation (September 30, 2026): record $54.2B quarterly revenue, $133.2B fiscal-year revenue, the strategic customer agreement program, AI-driven memory market outlook and FQ1-27 guidance.
Hızlı Navigasyon
Etiketler
Slaytları paylaş
Micron Technology's fiscal Q4 2026 earnings presentation (September 30, 2026): record $54.2B quarterly revenue, $133.2B fiscal-year revenue, the strategic customer agreement program, AI-driven memory market outlook and FQ1-27 guidance.
Her slayt sayfasının detaylı görünümü, düzen, temel içerik ve görsel öğeler dahil.
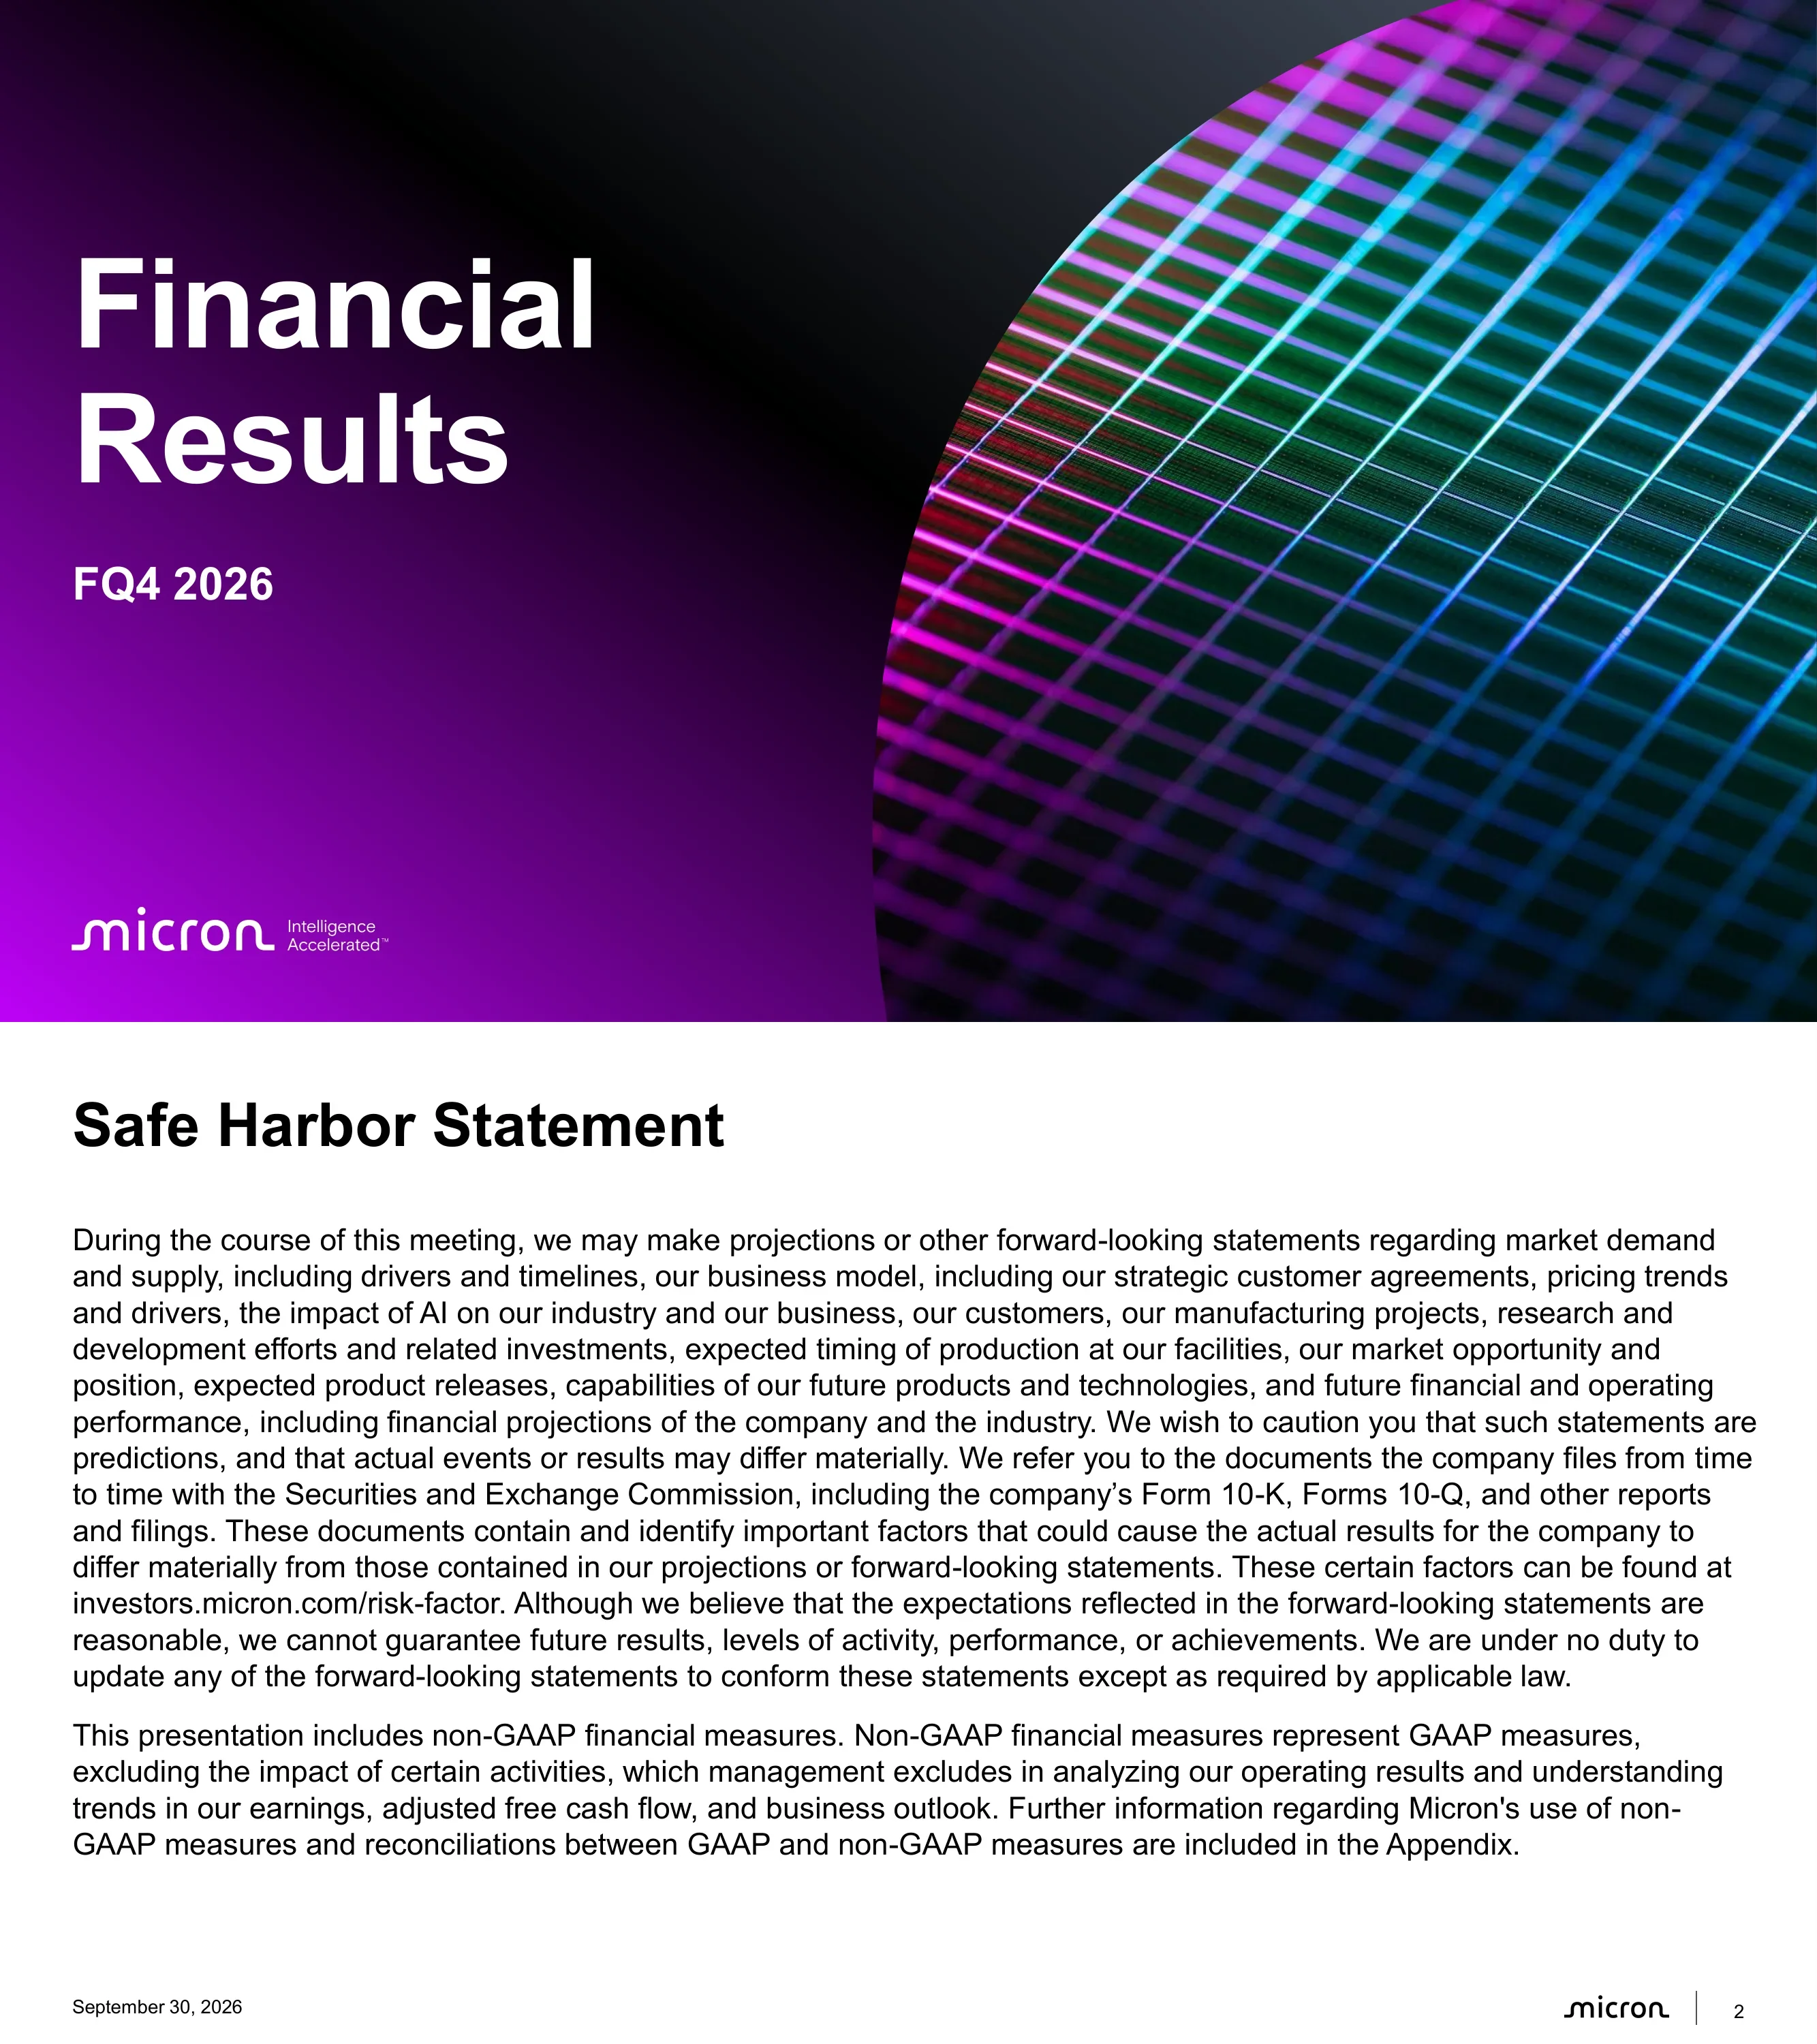
Title slide for Micron's fiscal fourth-quarter 2026 earnings call, with the Micron 'Intelligence Accelerated' wordmark.
Left-aligned white title and period label over a magenta-to-violet gradient; right half is a full-bleed close-up of an iridescent silicon wafer.
Forward-looking statement disclaimer covering demand, strategic customer agreements, pricing, AI impact, manufacturing projects and financial projections, plus a note on non-GAAP measures reconciled in the appendix.
Single text column on white with bold heading; date and page number in the footer.
Speaker divider introducing the CEO section of the call.
Name and title on the left over white; large studio portrait on a black background fills the right half.
Record fiscal Q4 with revenue, gross margin and EPS above the high end of guidance; FY26 revenue 3.5x the prior record, data center revenue up fourfold, DRAM revenue above $100B; higher incentive compensation for all employees; FY27 expected to be even better as supply stays tight.
Narrow left image strip (green-lit wafer) with a bulleted text panel taking two-thirds of the slide.
Argues AI is becoming 'Super Intelligence' and that every competing customer platform gains value from more memory and storage performance and capacity.
Left photo of a cleanroom engineer with a tablet; right-hand heading and four bullets.
Memory's strategic role gives Micron more differentiation than ever: performance, quality, time-to-market, U.S.-made DRAM, and a richer high-value product mix.
Mirror of the previous slide with a server-rack photo on the left and bullets on the right.
1-gamma DRAM and G9 NAND are the largest production nodes and on track to be the highest-volume in Micron's history; next-gen nodes target volume production in 2H CY2027; leadership in HBM, SOCAMM, DDR modules and data center SSDs.
Red-lit wafer image strip on the left, bulleted text on the right.
U.S. fabs in Virginia, Idaho and New York for DDR, LPDRAM and HBM supply; concrete pour at the first New York fab (output CY2030); ID1 output mid-CY2027 and ID2 late CY2028.
Two-column bullets on top; wide aerial construction photo of the fab site across the bottom third.
Groundbreaking for a DRAM fab expansion in Hiroshima, Japan (late CY2028); Tongluo, Taiwan shipments mid-CY2027; Singapore HBM packaging output early CY2027 and a new NAND facility in 2H CY2028.
Two-column bullets above a banner photo of the Micron Hiroshima groundbreaking ceremony.
Explains multi-year take-or-pay strategic customer agreements (SCAs): better supply planning and financial predictability for Micron, supply assurance and roadmap collaboration for customers.
Left photo of a hand on a glowing data chart; right-side bullets.
26 SCAs signed, estimated at over 35% of revenue through 2030; three-quarters have defined pricing frameworks, mostly with floors and ceilings; agreements now extend into 2031; customer financial commitments up to $32B, mostly cash deposits.
Lifestyle photo on the left, dense bullet list on the right.
Server units expected to grow in the high teens in CY2026 and CY2027; larger models, longer contexts and higher concurrency keep raising memory and storage content per AI workload.
Text on the left, tall photo of a blue-lit data center aisle on the right.
HBM revenue grew faster than company revenue; most CY2027 HBM supply is contracted at significantly higher prices; HBM4 ramping and custom HBM4E (NVHBM) with NVIDIA; data center SSD revenue nearly $10B, more than 10x year over year.
Bullet column on the left with a server-rack photo in the right third.
PC and mobile revenue still growing on premium demand despite possible double-digit unit declines; edge AI drives more DRAM and NAND content; nearly half of MCBU revenue came from 1-gamma products.
Bullets on the left, photo of a laptop with a vivid gradient screen on the right.
Autonomous vehicles are the first big physical-AI deployment; L4+ vehicles carry over 200GB of memory and multiple terabytes of storage, and humanoid robots need similar amounts, making physical AI a significant demand driver by decade end.
Bullets on the left, photo of a city highway with autonomous-vehicle detection overlays on the right.
Supply-demand expected to be much tighter in CY2027–28; NAND industry bits up low-20s% in CY2026 and mid-20s% in CY2027–28; DRAM bits up mid-20s% in CY2026 and low-20s% thereafter; HBM bits to outgrow conventional DRAM.
Amber-tinted fab photo on the left, long bullet list on the right.
Structural DRAM supply gap needs new cleanroom space; no line of sight to supply-demand balance; FY27 capex raised mainly for construction to bring cleanroom space forward to late CY2028 and beyond.
Photo of a Micron-branded automated wafer carrier on the left, bullets on the right.
Announces Manish Bhatia as President and COO and Dr. Scott DeBoer as President and Chief Technology and Products Officer.
Two short text columns above a full-width abstract blue light-streak banner.
Manish Bhatia leads the business units and global operations with end-to-end demand-through-supply responsibility for the operating P&L.
Executive portrait on black at left, bullets on white at right.
Scott DeBoer leads technology and products, the memory and storage roadmaps, and Micron Research Labs.
Same portrait-plus-bullets layout as the previous slide.
Speaker divider opening the CFO's financial section.
Name and title on white at left, studio portrait on black at right.
Headline numbers: FQ4 revenue of $54.2B, up 31% Q/Q and 379% Y/Y; FY26 revenue of $133.2B, up 256% Y/Y.
Two large gradient (blue-to-green) hero figures side by side on white with short captions.
DRAM FQ4 revenue $39.8B (73% of total, +27% Q/Q, ASPs up high teens); NAND $14.1B (26%, +42% Q/Q, ASPs up ~30%); FY26 DRAM $100.7B and NAND $31.8B.
2x2 grid of DRAM/NAND quarter/year text blocks over an abstract circuit-board light banner.
Table of revenue, gross margin and operating margin for CMBU, CDBU, MCBU and AEBU across FQ4-26, FQ3-26 and FQ4-25; every unit at 79–88% operating margin this quarter.
Full-width financial table with a black header row and grouped sub-rows per business unit.
CMBU record $16.3B (30% of revenue, +18% Q/Q, 83% GM); CDBU record $18.0B (33%, +56% Q/Q, 90% GM, +290bp).
Bokeh-style blue and red light image on the left, bullets on the right.
MCBU record $13.1B (24%, +14% Q/Q, 90% GM); AEBU record $6.8B (13%, +47% Q/Q, 84% GM, +470bp).
Teal particle-wave image on the left, bullets on the right.
Key non-GAAP line items: revenue $54.23B, gross margin 87.0%, opex $2.57B, operating income $44.64B, net income $38.40B, EPS $33.42, operating cash flow $43.97B.
Label-value list on the left; glowing magenta wafer photo on the right.
Operating cash flow $43.97B (81% of revenue); net capex $10.77B; adjusted FCF $33.20B; FY26 FCF $62.31B; $0.15 dividend; $75.48B liquidity; FY23–FY26 shareholder returns of $3.5B.
Grey sidebar with cumulative capital-return bullets at left, two-column label/value table at right, footnotes below.
Guidance: revenue $61.5B ± $1.5B, gross margin ~86.25%, opex ~$2.06B, EPS $38.15 ± $1.00 on ~1.15B diluted shares.
Wafer close-up on the left half, four-row guidance table on the right.
FY27 expected to set records with sequential revenue growth each quarter; FQ1 is the gross-margin floor because of incentive-pay costs flowing through inventory; opex up ~$2.5B in FY27, mostly R&D; tax rate around 15.5%.
Two-column bullet text above a green-and-blue chip-pattern banner.
Section divider for the appendix.
Full-bleed violet-to-blue gradient with a large white 'Appendix' heading.
Non-GAAP P&L comparing FQ4-26, FQ3-26 and FQ4-25 with percent of revenue: revenue, gross margin, operating income, tax, net income, EPS, operating cash flow, cash balance.
Full-width table with black header and alternating percent-of-revenue columns.
FY26 vs FY25 non-GAAP summary: revenue $133.2B vs $37.4B, gross margin 81% vs 41%, net income $86.8B vs $9.5B, EPS $75.52 vs $8.29.
Same table style as the quarterly summary, two periods.
Reference sheet: DRAM/NAND revenue mix, volume and ASP changes Q/Q, FQ4 actuals vs FQ1-27 guidance, diluted shares, tax and capex estimates.
Five small black-header tables arranged in a two-column grid.
DRAM $39,771M, NAND $14,102M and other $356M for FQ4-26, compared with FQ3-26 and FQ4-25, with percent of total.
Single wide table with black header.
FY26 DRAM $100,679M (76%), NAND $31,785M (24%), other $724M vs FY25.
Single wide table with black header.
Q/Q and Y/Y growth by business unit plus FY totals; CDBU up 1,042% Y/Y in the quarter and 420% for the year.
Wide table above a red-and-blue particle banner.
Section divider for the reconciliation tables.
Full-bleed blue-to-green gradient with a large white heading.
Quarterly GAAP to non-GAAP bridge for gross margin, operating expenses and operating income, including a $500M patent license charge in FQ4.
Reconciliation table with indented adjustment rows and bolded totals.
Quarterly GAAP to non-GAAP bridge for cost of goods sold, R&D and SG&A, mostly stock-based compensation adjustments.
Reconciliation table.
Quarterly bridge from GAAP net income of $37,701M to non-GAAP $38,398M, plus the income-tax reconciliation.
Reconciliation table.
Quarterly adjusted EBITDA of $47,244M vs $36,057M in FQ3 and $6,066M a year earlier.
Reconciliation table.
Quarterly share-count and EPS bridge (GAAP $32.87 to non-GAAP $33.42) and adjusted free cash flow of $33,199M.
Reconciliation table with two stacked sections.
Net cash rises to $68,301M from $24,433M last quarter and a net debt position a year ago.
Short reconciliation table.
FY26 vs FY25 GAAP to non-GAAP bridge for gross margin, opex and operating income.
Reconciliation table, two periods.
FY26 vs FY25 bridge for cost of goods sold, R&D and SG&A.
Reconciliation table, two periods.
FY26 GAAP net income of $84,969M to non-GAAP $86,758M, plus the tax bridge.
Reconciliation table, two periods.
FY26 adjusted EBITDA of $110,590M vs $19,126M in FY25.
Reconciliation table, two periods.
FY26 non-GAAP EPS of $75.52 and adjusted free cash flow of $62,308M vs $3,721M in FY25.
Reconciliation table with two stacked sections.
GAAP outlook (EPS $37.84 ± $1.00) bridged to non-GAAP (EPS $38.15 ± $1.00), with lettered adjustment footnotes for stock comp and tax effects.
Three-column GAAP / adjustments / non-GAAP table above a lettered adjustments table.
Closing slide with the Micron wordmark and the trademark and copyright notice.
Black background with a centered white logo and fine-print legal text at the bottom.
Bu slayt ve temel sunum içeriği hakkında yaygın sorular.
It is Micron's official 51-slide deck for the September 30, 2026 earnings call. It covers the CEO's business update (AI and memory strategy, technology nodes, manufacturing expansions, strategic customer agreements, data center, PC/mobile and physical-AI markets, market outlook and leadership changes), the CFO's financial review and FQ1-27 guidance, and a 20-page appendix of non-GAAP financial tables and reconciliations.
Revenue was $54.2B, up 31% quarter over quarter and 379% year over year. Non-GAAP gross margin was 87.0%, non-GAAP EPS was $33.42 and operating cash flow was $43.97B. Fiscal 2026 revenue was $133.2B, with DRAM above $100B.
Non-GAAP guidance is revenue of $61.5B ± $1.5B, gross margin of about 86.25%, operating expenses of about $2.06B and diluted EPS of $38.15 ± $1.00 on about 1.15B diluted shares. Slide 50 reconciles this to GAAP.
They are multi-year take-or-pay supply agreements. Micron reports 26 signed SCAs, estimated at over 35% of revenue through 2030, with pricing frameworks that often have floors and ceilings, and about $32B in customer financial commitments, mostly cash deposits. Slides 10–11 cover the details.
Yes. You can download the original PDF from this page and use its structure as a reference: speaker dividers, a big-number revenue slide, business-unit tables, a guidance slide and an appendix of reconciliations. To build your own version with your data, you can recreate the layout in 2Slides.
It uses a clean white base with black-header financial tables, magenta-violet and blue-green gradient section dividers, and photography-led narrative slides that pair a vertical image strip with bullet text. Headline KPIs use oversized gradient numerals.
It is useful for investors tracking the memory and HBM cycle, IR and FP&A teams building quarterly decks, and founders who want to see how a large public company presents results, segment data and forward guidance.
Official investor relations page hosting the FQ4 2026 earnings deck, press release and prepared remarks

Create Your Own Slides
Turn your ideas into professional presentations in seconds with 2slides AI.
Profesyonel tasarımları referans alın, stilinizi seçin ve mükemmel metin oluşturma ile slaytlar oluşturun. Nano Banana ile desteklenir—şimdi sunumunuzu oluşturmaya başlayın.
Slaytlar için AI Ajanınız. Akıllı sunum oluşturma ile zaman kazanın, daha hızlı parlayın.




© 2026 2slides. Tüm hakları saklıdır.