
Şu koleksiyonda: Yatırımcı sunumu örnekleri · Japonya'dan yatırımcı sunumu örnekleri
A 35-page Japanese-language investor presentation from JX Advanced Metals Corporation (JX金属) covering results for the first half (Q2) of the fiscal year ending March 2027 (FY2026), dated 9 November 2026; the original was published on TDnet (Tokyo Stock Exchange timely disclosure). It covers semiconductor materials (sputtering targets, InP substrates, tantalum powder), information & communications materials (rolled copper foil, titanium copper), the base metals/recycling business, a raised full-year forecast and mid-term targets.
Bu sunumun kapağını, kendi içeriğinizden oluşturulan slaytlar için stil referansı olarak kullanır. Ya da aşağıdan herhangi bir sayfayı seçip düzenini referans olarak kullanın.
Hızlı Navigasyon
Etiketler
Slaytları paylaş
A 35-page Japanese-language investor presentation from JX Advanced Metals Corporation (JX金属) covering results for the first half (Q2) of the fiscal year ending March 2027 (FY2026), dated 9 November 2026; the original was published on TDnet (Tokyo Stock Exchange timely disclosure). It covers semiconductor materials (sputtering targets, InP substrates, tantalum powder), information & communications materials (rolled copper foil, titanium copper), the base metals/recycling business, a raised full-year forecast and mid-term targets.
Her slayt sayfasının detaylı görünümü, düzen, temel içerik ve görsel öğeler dahil.
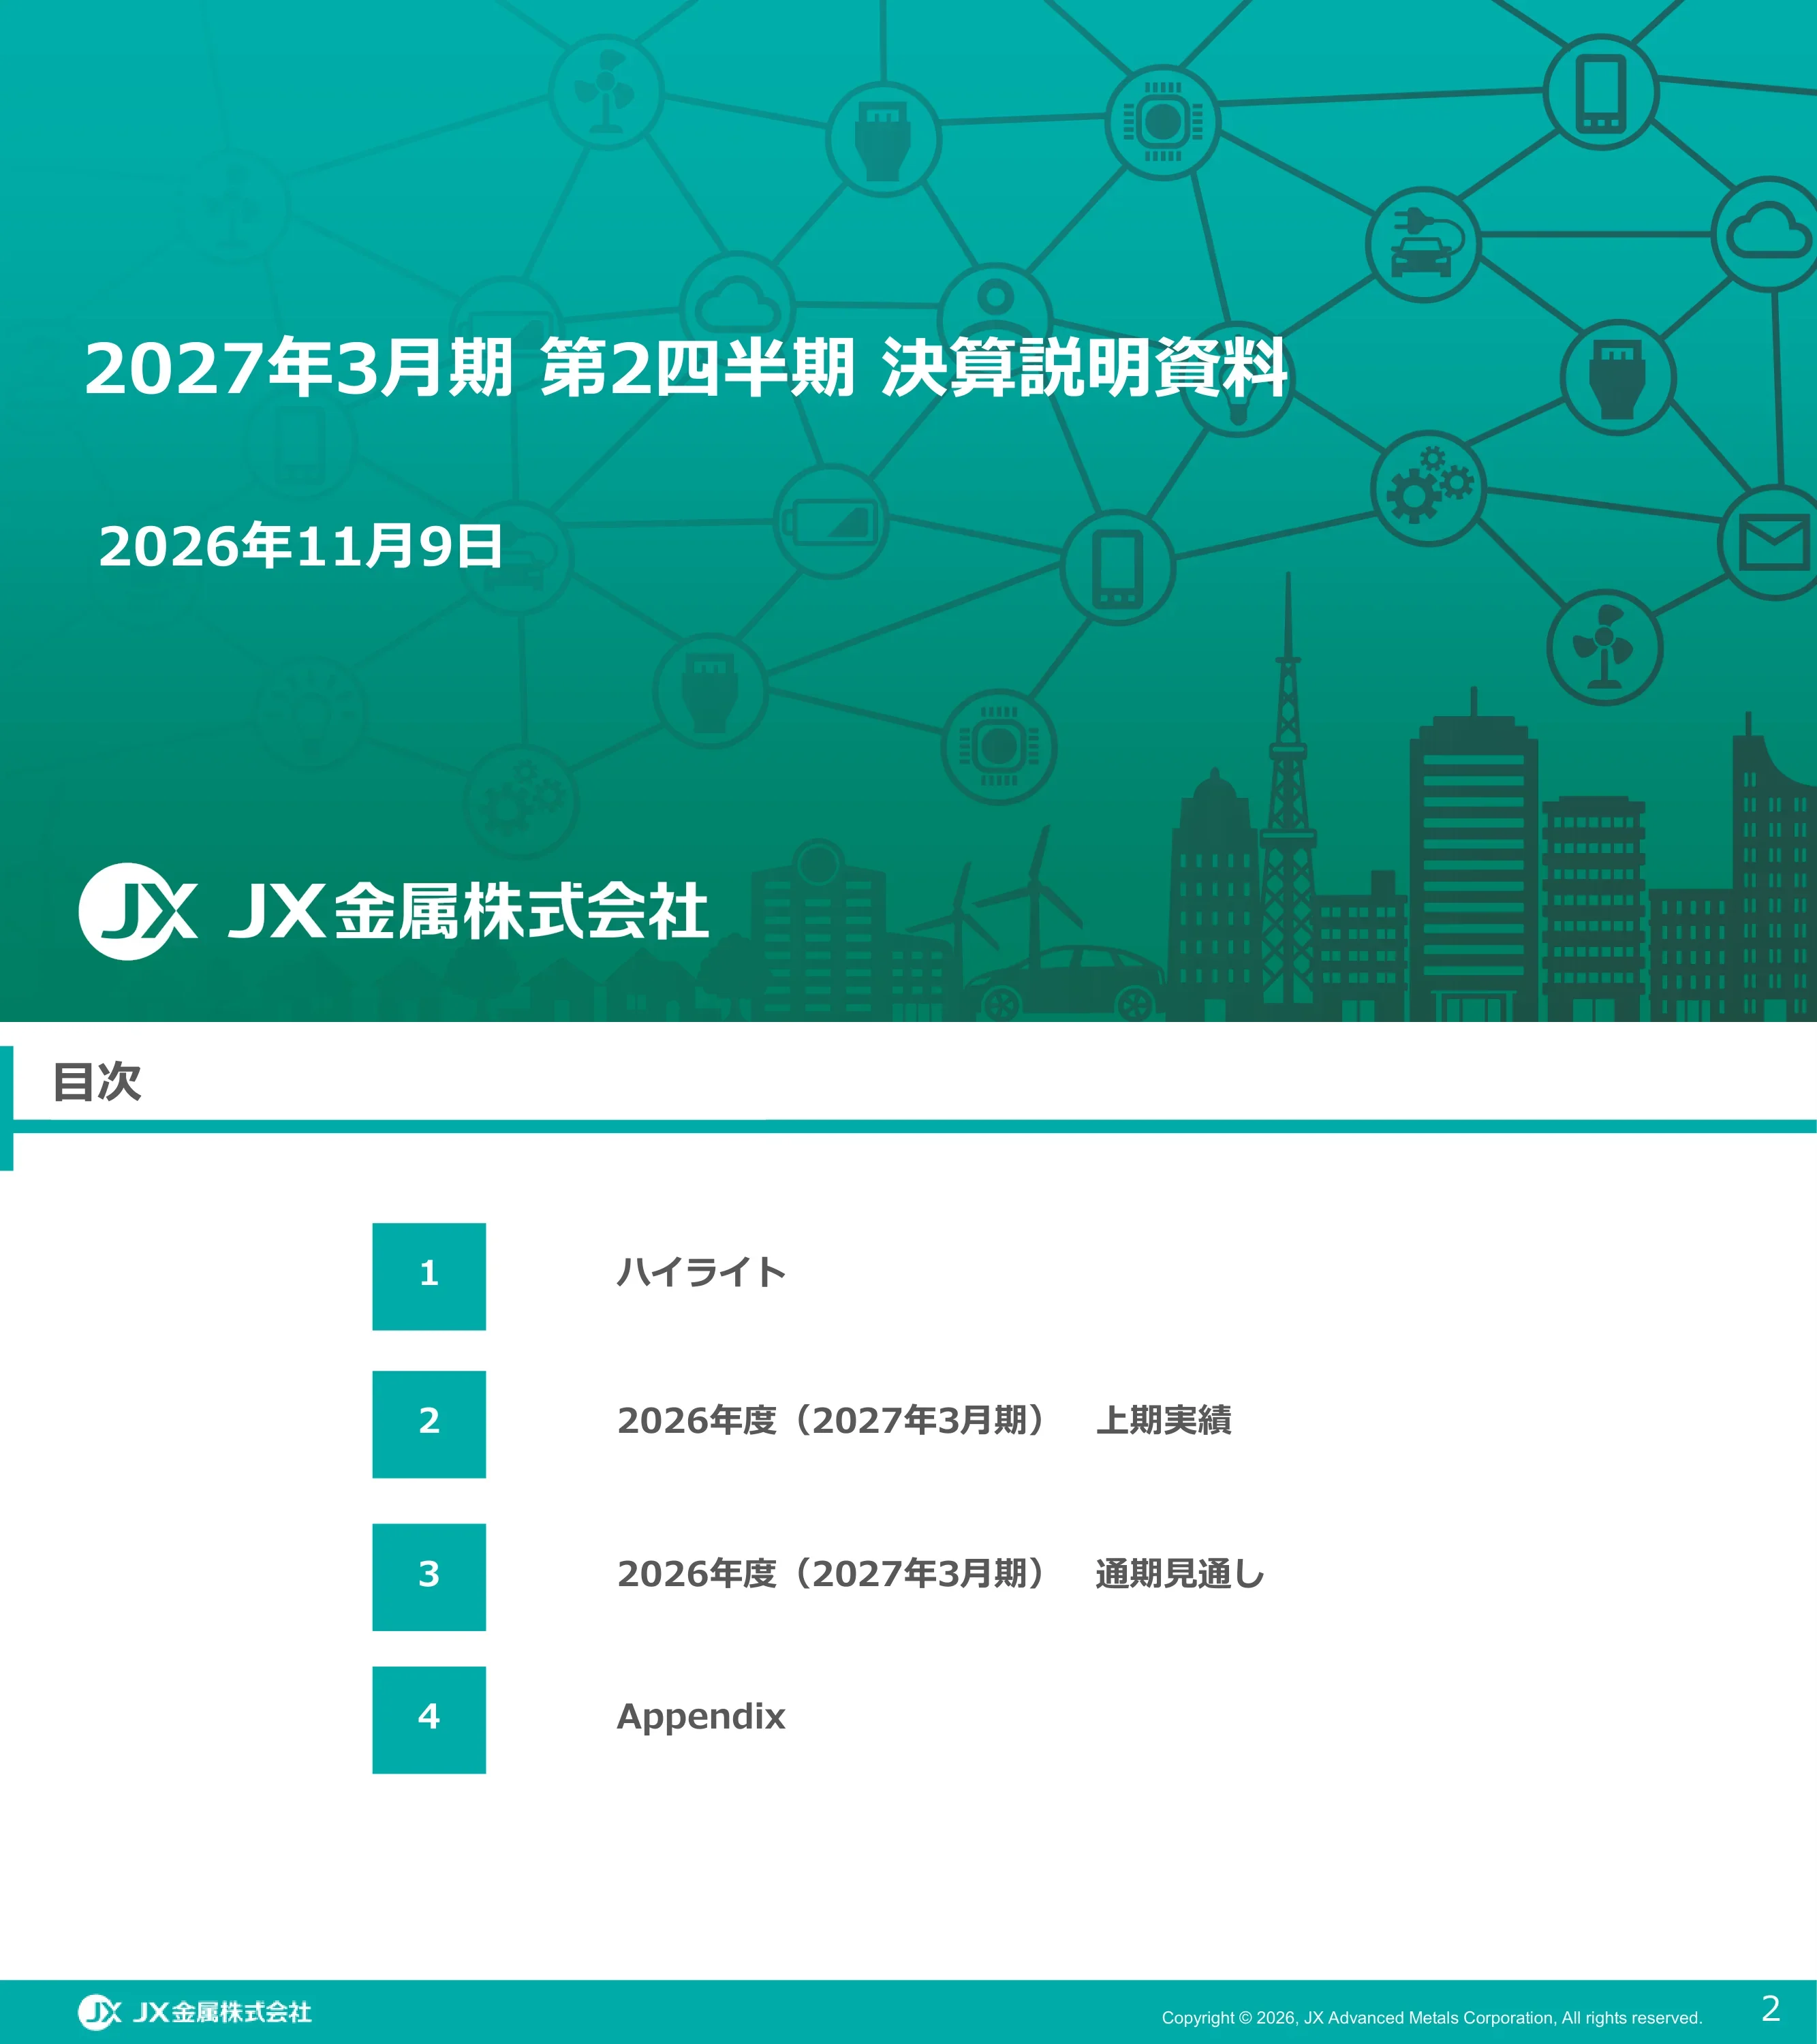
Title slide of the Q2 results presentation for the fiscal year ending March 2027, dated 9 November 2026, issued by JX Advanced Metals Corporation (JX金属株式会社).
Full-bleed teal gradient background with title and date at left and company logo at bottom left
Four sections: 1 Highlights, 2 FY2026 (year to March 2027) first-half results, 3 FY2026 full-year outlook, 4 Appendix.
Four numbered teal squares in a vertical list with section names to the right
Section divider introducing the Highlights section; no figures.
Mostly white slide with a wide centered teal band containing the section title
H1 operating profit was 1,508 (億円, ¥100 million), up 808 from 700 a year earlier, at 159 yen/USD and copper 622 cents/lb. The full-year forecast was raised from 2,320 to 2,550 (億円), +46% year on year, and about 2,650 if copper stays at 650 cents/lb from October; focus business is 1,140 and semiconductor materials 730, versus analyst average of 2,650 total.
Two-column comparison (H1 actual vs prior year; full-year forecast Aug vs Nov) with variance-factor boxes, plus a bottom table of annual trend and analyst averages
H1 volume growth: semiconductor targets +27%, magnetic targets +12%, InP substrates +11%, tantalum powder for capacitors +19%, rolled copper foil +11%, titanium copper +30%. Full-year forecasts (Aug to Nov): semiconductor targets +21% to +24%, magnetic targets +8% to +11%, InP +13%, tantalum powder +2% (AI data center +62%, other -9%), copper foil +5%, titanium copper +33%.
Matrix with product rows by segment on the left, H1 actual column and full-year forecast (Aug vs Nov) columns on the right, short commentary beside
Capacity targets versus FY2025: semiconductor targets 1.3x from FY2027, magnetic targets 1.2x raised to 1.5x by mid-2029, InP substrates 7-10x from H2 FY2026, Ubiquinog (high-purity copper sulfate) 1.5x, tantalum powder 1.5x, titanium copper 1.5x in FY2029, MLCC ultrafine nickel powder 2x, leak sensors 1.3x raised to 4x by September 2027.
Table with segment, product photo, expansion scale, timing and rationale columns; highlighted rows mark Q2 updates; explanatory strip on Ubiquinog at bottom
Continuing investments and joint studies to secure raw materials for focus businesses: the Isohara and Hitachinaka plants handle 56 elements; a joint study with Tronox on rare earth smelting (cost USD 32 million, shared 50/50); stakes in Copi project (2025), Fireweed Metals (2025), Mibra mine tantalum (2022), eCycle Solutions (2022) and a capital/business tie with ReNet Japan Group (2026).
Map-based diagram with a periodic table inset at top, callout boxes connected by lines to world map locations
Semiconductor materials: capital/business alliance with Oxide Corporation (photonics), investment of ¥2.75 billion (27.5億円) by third-party allotment for a 7.12% stake. Base materials: JX Metals Circular Solutions invests ¥350 million (3.5億円) for 2.4% of ReNet Japan Group, which has agreements with over 770 municipalities.
Two-column slide (semiconductor materials on the left, base materials on the right), each with summary box, deal terms, partner description and a diagram
Section divider for the FY2026 (year to March 2027) first-half results section; no figures.
White slide with a centered teal title band
Net sales 5,315 (億円), +34% from 3,964; operating profit 1,508, +115% from 700 (focus 622, base 955, other -69); pre-tax profit 1,461; net profit 1,143; profit attributable to owners of parent 979, +128%. FX 159 yen/USD, LME copper average 622 cents/lb.
Single large table with prior-year, current-year, difference and percent-change columns; highlighted total rows
Operating profit 1,508 total: semiconductor materials 361 (+171, +90%), information & communications 261 (+108, +71%), basic materials 955 (+551, +136%), other -69. The bridge from 700 adds one-off +191, FX/copper +583, focus volume +170, base volume -89 and cost -47.
Segment table at left and an operating-profit waterfall chart with breakdown table at right
Segment operating profit rose from 190 to 361 (+171): FX +26, volume +111, cost and other +34. Sales 1,109 (+33%); thin film materials sales 935 and profit 335 (+81%); tantalum/niobium sales 262 and profit 21.
Waterfall chart at left; business commentary and sales/profit table at right
Segment operating profit rose from 153 to 261 (+108): FX +29, volume +59, cost +20. Sales 1,900 (+22%); functional materials sales 994 and profit 177 (+57%); Toho Titanium/Tatsuta Electric Wire sales 906 and profit 84 (+110%).
Waterfall chart at left; commentary boxes and sub-segment table at right
Segment operating profit rose from 404 to 955 (+551): one-off +191, FX/copper +528, volume -89, cost -79. Resources profit 729 (+463) on sales of 24; metals & recycling profit 232 (+91) on sales of 2,481.
Waterfall chart at left; commentary and sub-segment table at right
At end of September 2026, interest-bearing debt was 4,488 (up from 3,243, mainly convertible bonds) and net debt 3,698; cash 790. H1 operating cash flow 818, investing 13, free cash flow 831, financing -704. Capex 372, depreciation 253, R&D 103.
Left: two stacked bar charts (March vs September 2026); right: cash flow table and a three-column capex/depreciation/R&D table
Section divider for the FY2026 (year to March 2027) full-year outlook section; no figures.
White slide with a centered teal title band
Net sales forecast 10,500 (+250 from 10,250); operating profit 2,550 (+230, +10%; focus 1,140, base 1,550, other -140); net profit attributable to parent 1,600 (+190). Assumes 157 yen/USD, copper average 619 cents/lb. Sensitivity from October: 5 yen weaker yen +50, +10 cents/lb copper +25.
Table comparing August and November forecasts at left; FX/copper assumptions and sensitivity tables at right bottom
Operating profit forecast rises from 2,320 to 2,550: FX/copper +197, focus volume +39, base volume -147 (mine output -95, metals & recycling -50), cost +141. Segment profit: semiconductor materials 730 (+120), information & communications 410 (+20), basic materials 1,550 (+80).
Segment table at left; revision waterfall at right with breakdown by segment
Segment forecast profit rises from 610 to 730 (+120): FX +3, volume +30, cost and other +87. Thin film materials sales 2,000 and profit 670 (+16%); tantalum/niobium sales 600 and profit 50 (+67%).
Waterfall chart at left; commentary and sub-segment table at right
Segment forecast profit rises from 390 to 410 (+20): FX 0, volume +9, cost +11. Functional materials sales 1,900 and profit 260 (unchanged); Toho Titanium/Tatsuta sales 1,900 and profit 150 (+20, +15%).
Waterfall chart at left; commentary and table at right
Segment forecast profit rises from 1,470 to 1,550 (+80): FX/copper +194, volume -147, cost +33. Resources profit 1,250 (+70) on sales of 50; metals & recycling profit 300 (+10) on sales of 4,700.
Waterfall chart at left; commentary and table at right
March 2027 forecast: cash 810, interest-bearing debt 4,770 (mainly convertible bonds), net debt 3,960. Forecast operating cash flow 1,600, investing -950, free cash flow 650. Dividend planned at 20 yen/share (10 interim, 10 year-end), payout ratio 11%, total return ratio about 133% including share buybacks of 1,949 (億円).
Left: stacked balance sheet bars (March 2026 actual vs March 2027 forecast); right: cash flow table and dividend policy box with dividend table
Appendix divider listing ten items: topics, company overview, long-term vision and history, product list, data center products, semiconductor targets, strengths, InP substrates, base business initiatives, mid-term targets.
Centered teal title band with a bulleted contents list below
Chronological list of FY2026 announcements from May to November 2026: capacity increases for sputtering targets, magnetic targets, InP substrates, tantalum powder, titanium copper, MLCC nickel powder and leak detection; Tronox rare earth study (September); ReNet Japan alliance (October); Oxide alliance (November). Items since the previous results are highlighted.
Color-coded dated bullet list (blue semiconductor, green information & communications, orange basic materials) with the latest items in a highlighted teal block
Positioned as a global top maker of advanced materials for semiconductors and communications. Estimated global shares: semiconductor targets about 65%, magnetic targets about 60%, InP substrates about 40%, rolled copper foil 78% (FPC use, per Fuji Chimera Research), titanium copper about 70%, tantalum powder about 50%; end uses include AI servers, wearables, smartphones and mobility.
Product grid organized by segment (semiconductor vs information & communications) with photos and share badges, end-use column at right and a base business strip at bottom
Long-term vision shifts from an equipment-industry type to a technology-driven company, with focus business as growth core and base business as foundation. Timeline runs from the 1905 opening of Hitachi Mine to the 2024 name change to JX Advanced Metals Corporation, with 2023 vision revision.
Left: vision policy and target portfolio boxes; right: central year timeline with company history on one side and business history on the other
FY2025 net sales were 8,846 (億円) and operating profit 1,750; sub-segment sales: thin film 1,470, tantalum/niobium 458, functional materials 1,602, Toho Titanium/Tatsuta 1,596, resources 57, metals & recycling 4,021. Table lists products, uses and end uses as of August 2026, plus equity stakes (Caserones 25%, Los Pelambres 12.52%, Escondida 3%, Pan Pacific Copper 47.8%).
Product photo strip and two donut charts on top; detailed product table by segment below
Schematic of an AI server (CPU, GPU, HBM, switch, DRAM, SSD, HDD, DPU) showing where JX products are used, with estimated global shares: semiconductor targets about 65%, titanium copper about 70%, tantalum powder about 50%, InP substrates about 40%, magnetic targets about 60%; also CVD/ALD precursors and leak sensors.
Large rounded diagram of server architecture with GPU package cross-section at center, product photos and share badges connected by leader lines
Semiconductor targets are high-purity metal materials used in the PVD (sputtering) step to form transistors and wiring layers on silicon wafers; JX holds about 60% of the world share (No. 1). Diagrams show the chip manufacturing flow and the sputter chamber.
Top left definition with No.1 badge; bottom left process flow loop; right cut-away of sputter chamber and film formation sequence
Four strengths: world-top technology (copper purity 99.9999999%), strong relations with semiconductor equipment makers, trust with customers (supplier awards from TSMC, Intel, SK hynix), and a global production network (Hitachinaka plant in Japan, Arizona Mesa plant in the US, plus sites in Korea and Taiwan).
Four columns, each with a teal arrow header, description and illustration
InP (indium phosphide) substrates for optical transceivers are selling strongly for data centers. Capacity versus FY2025: +20% (July 2025, about ¥1.5 billion), about +50% (October 2025, about ¥3.3 billion), about 3x (February 2026, about ¥20 billion), and 7-10x (June 2026, up to ¥120 billion).
Top bullet summary; middle left explanation with electric-to-optical diagram; middle right investment table; bottom growth opportunity matrix of optical vs electrical connections
Building an optimal base business structure aligned with the focus-business portfolio: Mibra mine (2022), partial sales of Caserones and Los Pelambres interests (2023-2025), Copi project and Fireweed stake (2025), eCycle stake (2022), Pan Pacific Copper integration with Mitsubishi Materials (final agreement May 2026; stakes JX 32.50%, Mitsubishi Materials 32.00%, Mitsui Mining 21.90%, Marubeni 13.60%), and the Tronox rare earth study in 2026.
Timeline matrix by fiscal year (2022 to 2026) with two rows: resources business and metals & recycling business
FY2026 forecast: operating profit 2,550 (+45.7%), focus 1,140 (+60.6%), operating margin 24.3% (semiconductor materials 30.4%, information & communications 10.8%), ROE 22.2%, net debt/EBITDA 1.3x. FY2027 targets include profit CAGR 10-15% (focus 35-40%), ROE 10% or more, net debt/EBITDA below 1.5x.
KPI table with actuals FY2023-2025, FY2026 forecast highlighted, reference CAGR and FY2027 targets columns
Disclaimer stating that targets, plans, estimates and forecasts in the document are based on information available at the time and on certain assumptions, so actual results may differ materially.
Text-only slide with large paragraph under standard title bar
Closing slide with the JX company logo (JX金属株式会社) on a teal gradient; no figures.
Full-bleed teal gradient with centered logo
Bu slayt ve temel sunum içeriği hakkında yaygın sorular.
The deck is in Japanese. It is the earnings presentation (決算説明資料) that JX Advanced Metals Corporation published on TDnet, the Tokyo Stock Exchange timely disclosure system, on 9 November 2026. This gallery page gives English titles and summaries so you can find and understand the slides.
The company calls its fiscal year to March 2027 'FY2026' (2026年度). It runs from April 2026 to March 2027, and this deck reports the first half (April to September 2026) plus the full-year outlook. FY2025 means April 2025 to March 2026.
H1 operating profit was 1,508 (億円, ¥100 million), up from 700 a year earlier, on sales of 5,315. The full-year operating profit forecast was raised from 2,320 to 2,550, assuming 157 yen/USD and a copper average of 619 cents/lb; it would be about 2,650 if copper stays at 650 cents/lb from October.
The 'focus business' contains semiconductor materials (thin film materials such as sputtering targets and InP substrates, plus tantalum/niobium) and information & communications materials (rolled copper foil, titanium copper, Toho Titanium, Tatsuta Electric Wire). The 'base business' is basic materials (resources and metals & recycling). H1 operating profit was 361, 261 and 955 respectively.
Several slides tie products to AI data centers: H1 volume growth of +27% for semiconductor targets and +30% for titanium copper, capacity plans such as InP substrates at 7-10x FY2025 levels and leak sensors at 4x by September 2027, and a server diagram with estimated global shares by product.
Yes as a structural reference. It uses a repeatable layout: highlights, results tables, operating-profit waterfalls per segment, forecast-revision tables, then an appendix with product and technology explainers. The teal-and-white styling with consistent title bars and callout boxes is easy to adapt. Reuse the layout ideas, not JX's logo, text or data.
The deck forecasts a dividend of 20 yen per share (10 interim and 10 year-end), a payout ratio of 11% and a total return ratio of about 133%, including share buybacks of 1,949 (億円). Net interest-bearing debt was 3,698 at end of September 2026, mainly from convertible bond issuance, and is forecast at 3,960 for March 2027.
Yes. Targets for FY2027 include operating profit CAGR of 10-15% from FY2023 (35-40% for the focus business), ROE of 10% or more and net debt/EBITDA below 1.5x. The FY2026 forecast already shows operating profit of 2,550, ROE of 22.2% and net debt/EBITDA of 1.3x.

Create Your Own Slides
Turn your ideas into professional presentations in seconds with 2slides AI.
Profesyonel tasarımları referans alın, stilinizi seçin ve mükemmel metin oluşturma ile slaytlar oluşturun. Nano Banana ile desteklenir—şimdi sunumunuzu oluşturmaya başlayın.
Slaytlar için AI Ajanınız. Akıllı sunum oluşturma ile zaman kazanın, daha hızlı parlayın.


© 2026 2slides. Tüm hakları saklıdır.