
Şu koleksiyonda: Yatırımcı sunumu örnekleri · E-ticaret sunumu örnekleri
eBay Q2 2026 Earnings Presentation: the 40-page Business & Financial Highlights deck eBay released on August 5, 2026, covering $22.4B GMV (+14% FX-neutral), $3.13B revenue, $0.89B non-GAAP operating income, $1.60 non-GAAP EPS, the completed Depop acquisition, focus-category and C2C growth, eBay Live, advertising, capital returns and Q3/FY26 guidance, plus a full non-GAAP reconciliation appendix
Hızlı Navigasyon
Etiketler
Slaytları paylaş
eBay Q2 2026 Earnings Presentation: the 40-page Business & Financial Highlights deck eBay released on August 5, 2026, covering $22.4B GMV (+14% FX-neutral), $3.13B revenue, $0.89B non-GAAP operating income, $1.60 non-GAAP EPS, the completed Depop acquisition, focus-category and C2C growth, eBay Live, advertising, capital returns and Q3/FY26 guidance, plus a full non-GAAP reconciliation appendix
Her slayt sayfasının detaylı görünümü, düzen, temel içerik ve görsel öğeler dahil.
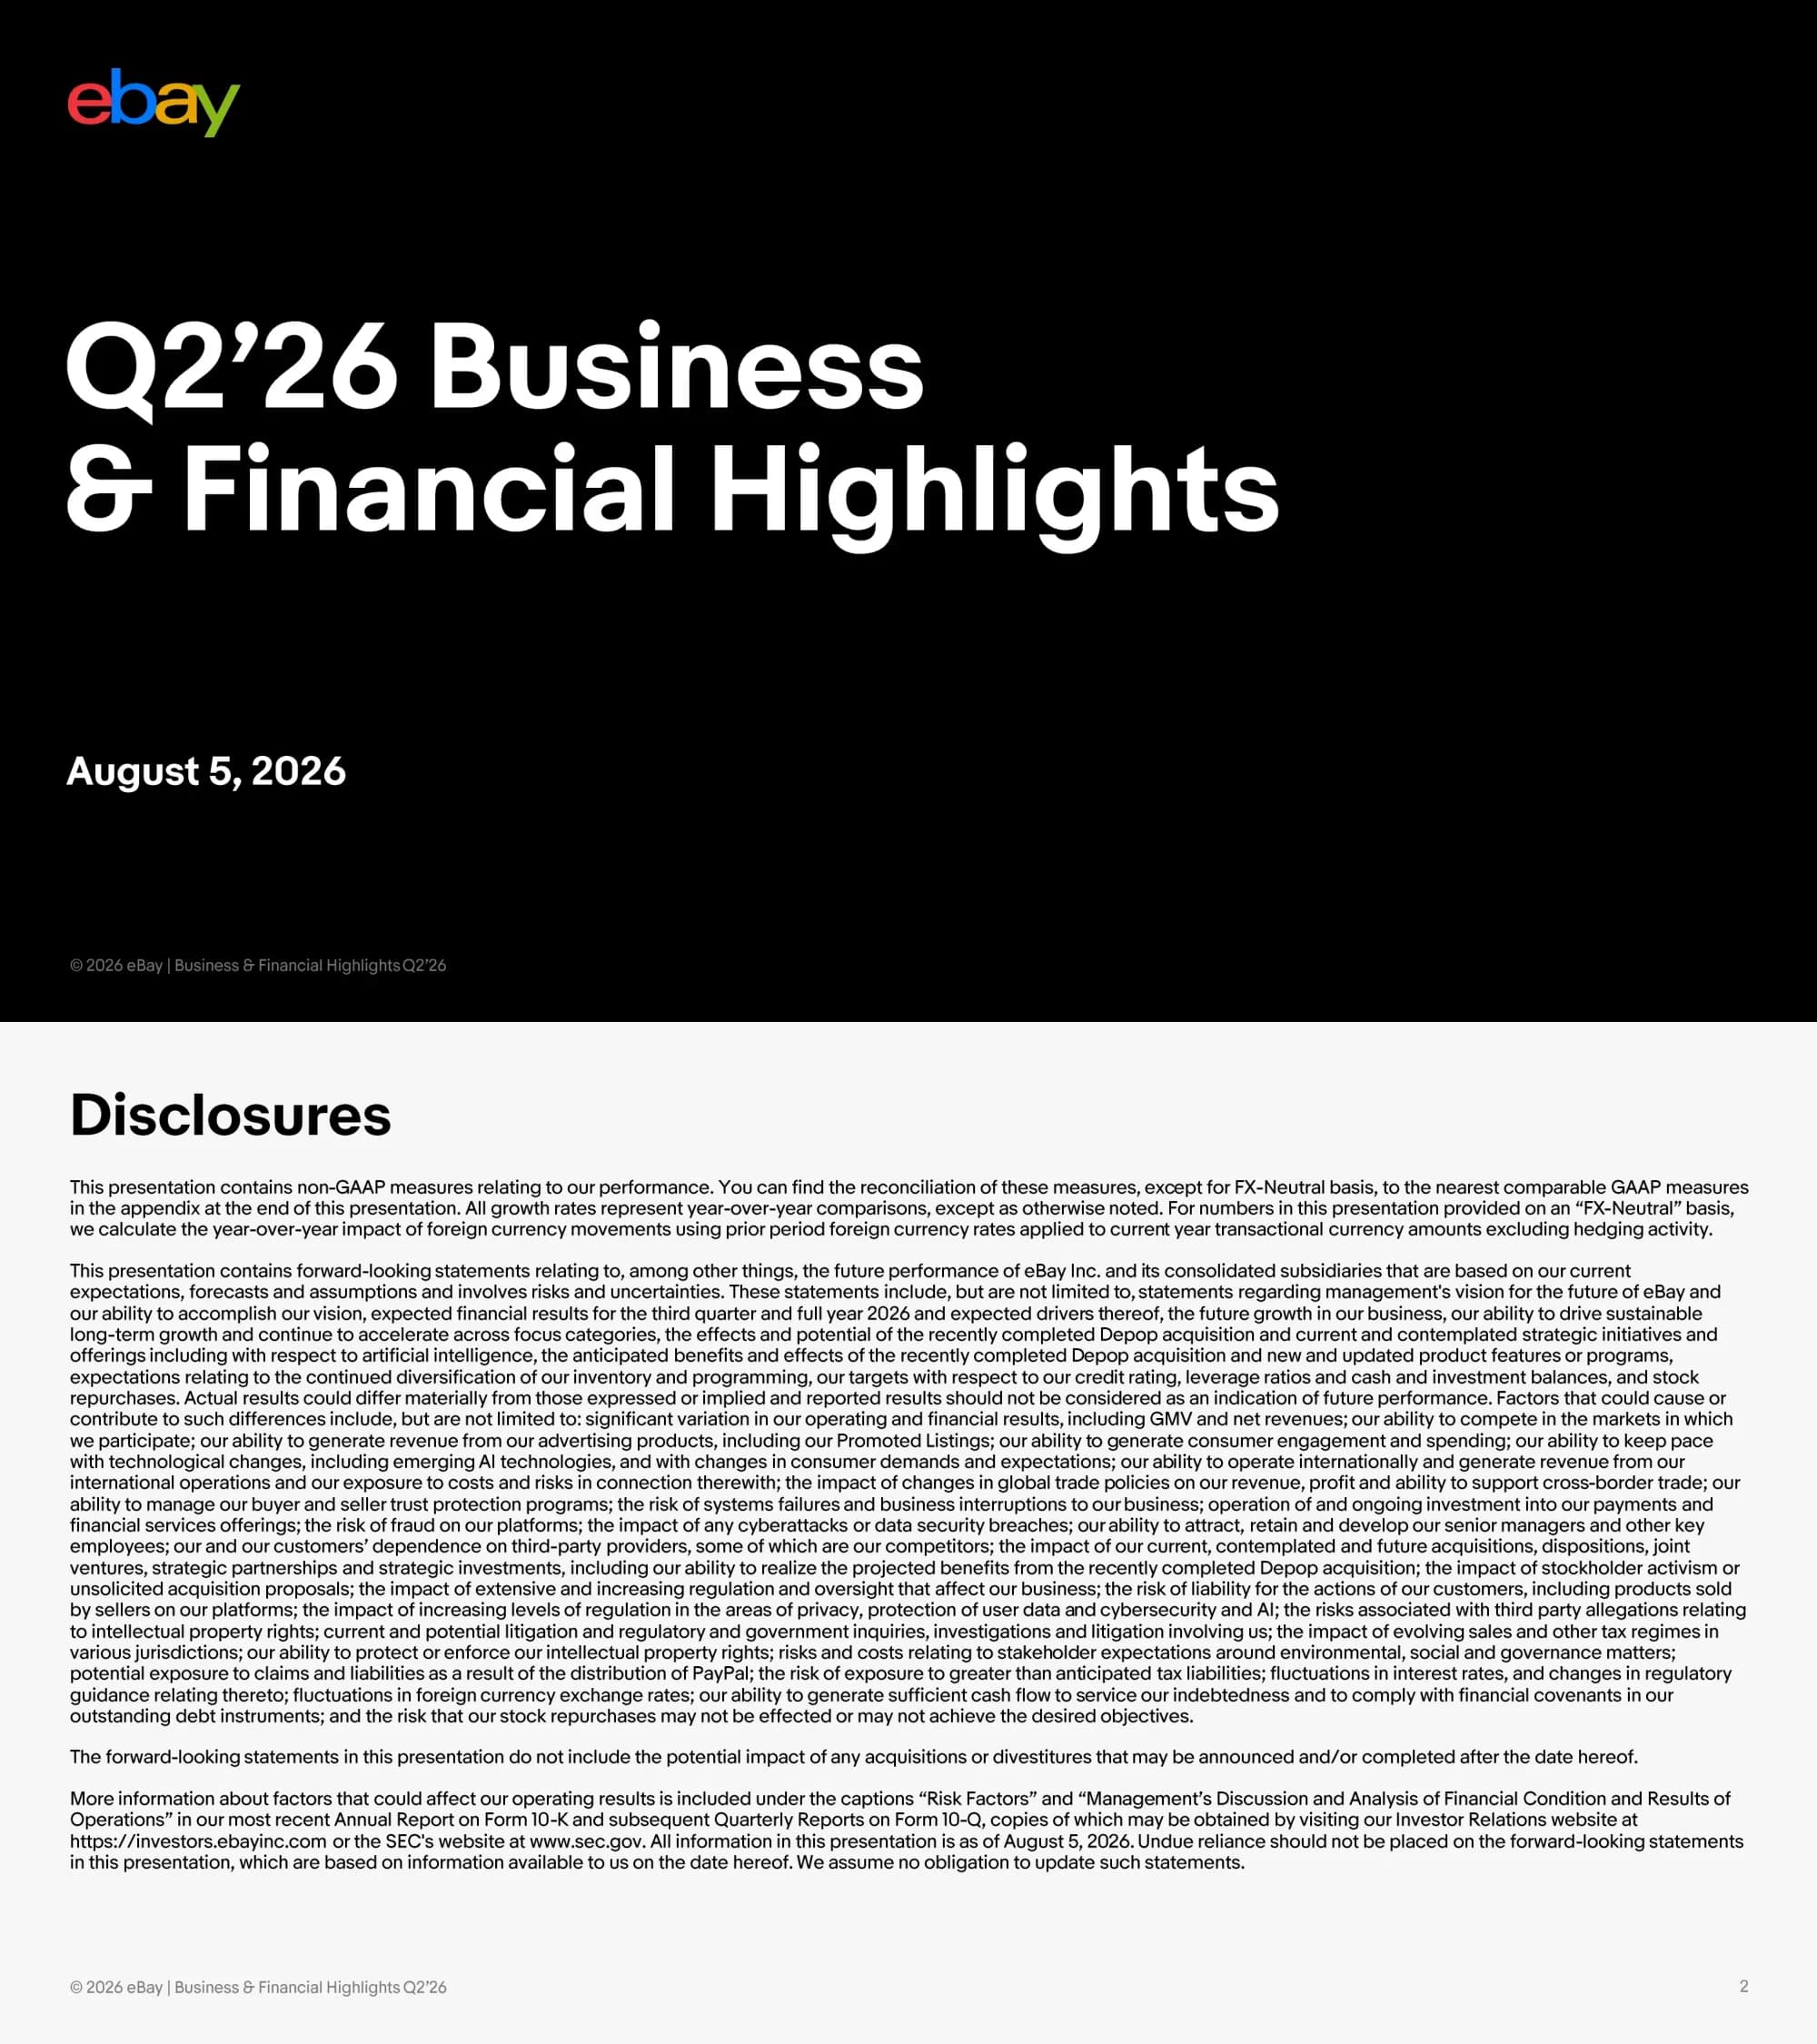
Cover slide titled 'Q2'26 Business & Financial Highlights' dated August 5, 2026, with the multicolor eBay logo in the top-left corner.
Full-bleed black background, logo top-left, oversized two-line white headline left-aligned at mid-height, date in bold white below and a small copyright footer.
Legal disclosures: non-GAAP measures and FX-Neutral basis explained, followed by a long forward-looking statements paragraph listing risks such as the Depop acquisition, AI, advertising, cross-border trade, PayPal distribution exposure, regulation and share repurchases, with references to the 10-K, 10-Q and investors.ebayinc.com.
White text slide with bold 'Disclosures' heading and four dense full-width paragraphs; page number bottom-right.
Section divider introducing the Business Highlights part of the presentation.
Full-bleed bright blue background with black eBay wordmark top-left and a large black 'Business Highlights' headline left-aligned.
Headline KPIs for the quarter: $22.4B Gross Merchandise Volume, $3.1B revenue, $0.89B non-GAAP operating income, $1.60 diluted non-GAAP EPS and 16 million enthusiast buyers (buyers with 6+ purchase days and $800+ annual spend, trailing twelve months).
Split layout: left column stacks five large bold numbers with labels beneath; right half shows a rounded-corner photo; footnotes under the photo.
Three strategic priorities: Focus Categories (GMV growth accelerated to 26% Y/Y, over 40% of total GMV for the first time, strength in Collectibles, eBay Motors, Fashion and Refurbished), C2C (GMV over 20% Y/Y, growth across US, UK, DE and AU, Magical Listing technology) and Recommerce (GMV over 20% Y/Y, activations at The Masters, Earth Day and Memorial Day). Together they exceed 70% of GMV and grew over 20% Y/Y.
Left: three stacked color-coded cards (green, yellow, blue) each with a thumbnail photo, title and bullets. Right: white panel with a three-circle Venn diagram in the same colors and a bold summary sentence below.
Focus Category GMV grew 26% Y/Y FXN and topped 40% of GMV. Collectibles led growth via trading cards, 80M+ AI-powered card scans and Card Ladder indexes; eBay Motors added nearly 2 points of total GMV growth, launched Easy & Free returns in the UK and eBay Guaranteed Fit in Canada and native vehicle listing in the app; Fashion grew on luxury and pre-loved, expanded Authenticity Guarantee to 100+ brands and to jewelry sourced from Greater China.
Three equal white rounded columns, each with a category heading, a rounded photo and bullet points; full-width blue banner at the bottom with the takeaway.
Depop acquisition completed on July 30. Complementary strengths: eBay brings broad global pre-loved and authenticated luxury selection; Depop brings a social-forward, discovery-led pre-loved fashion experience. Initial integration priorities: 1) maintain what makes Depop special, 2) help accelerate the existing roadmap, 3) apply eBay capabilities (reach, shipping, trust, safety) to support growth.
Left tall card with red Depop logo, phone mockup of the Depop app and a pink 'Completed the acquisition on July 30' badge. Right: top card comparing eBay and Depop logos split by a divider; bottom card with three numbered red-circle priorities in columns.
Core eBay C2C GMV grew more than 20% in Q2, outpacing overall GMV, driven by consumer supply, simpler selling via Magical Listing and differentiated inventory. Country proof points: US double-digit seller and supply growth; UK active sellers at highest level since 2023; Germany healthy C2C growth; Australia C2C GMV accelerated to double digits after the May initiative launch.
Left narrow card with a large blue '>20%' stat and 'What is working' subheads; right wide card listing four countries with round flag icons and descriptions; blue takeaway banner at the bottom.
eBay Live posted a record quarter with GMV up roughly 8x Y/Y, opened self-service onboarding to eligible US sellers in July and streamlined operations. Halo effect: over 90% of established Live sellers grew GMV with about 3x median GMV increase versus non-Live sellers; first-time Live buyers in Collectibles spent about 70% more, with about 50% of incremental spend outside Live events.
Three-part layout: left card with three blue-headed text blocks, center rounded photo of a live sports-card stream, right card with Seller Halo and Buyer Halo statistics in large blue figures; footnotes at the bottom.
United Kingdom focus: the majority of UK C2C transactions use Managed Shipping, with pickup and drop-off expanded through InPost and Royal Mail (about 50K lockers and parcel shops; 95% of UK buyers live within 1 km). eBay International Shipping launches in the UK in August, giving eligible sellers access to 190+ countries via a domestic hub. Shipping revenue grew double digits Y/Y.
UK flag header; two side-by-side white cards, each with an image (parcel locker photo / world map with routes), a blue highlight statement and supporting bullets or light-blue stat pills; blue takeaway banner across the bottom.
Section divider introducing the Financial Highlights part of the deck.
Full-bleed teal background with navy eBay wordmark and a large navy 'Financial Highlights' headline.
Guidance versus actuals: GMV $22.4B vs $21.3-$21.7B guidance (15% spot, 14% FXN); revenue $3.13B vs $2.97-$3.03B (15% spot, 14% FXN); non-GAAP operating income $0.89B vs $0.82-$0.85B (16% growth); diluted non-GAAP EPS $1.60 vs $1.46-$1.51 (17% growth).
Four-row table with metric labels on the left, a black-headed GUIDANCE column and a teal-headed ACTUALS column with large figures and small growth lines; a portrait photo occupies the right side.
Six-quarter stacked GMV chart ($B): Q1'25 18.8, Q2'25 19.5, Q3'25 20.1, Q4'25 21.2, Q1'26 22.2, Q2'26 22.4 (+14% FXN). Q2'26 split US 11.7 (+24%) and international 10.7 (+5%); organic FXN growth 2%, 4%, 8%, 8%, 14%, 14%.
Light gray chart panel with key legend at top-left, stacked columns (dark forest green international over lime green US) with totals and growth labels on top, rounded summary strip for organic FXN beneath.
Revenue ($M) by quarter: 2,585, 2,730, 2,820, 2,965, 3,089 and 3,134 in Q2'26 (+14% FXN). Take rate overlaid as a line holding at 13.8%-14.0% (14.0% in Q2'26). Organic FXN growth: 1%, 4%, 8%, 13%, 17%, 14%.
Royal blue column chart with a white-dotted line overlay for take rate, legend box, value and growth labels above bars and an organic FXN summary strip below.
Total advertising revenue ($M): 442, 482, 525, 544, 581 and 596 in Q2'26 (+23% FXN). First-party ads reached $570M (+24%), third-party ads $5M (-34%), plus off-platform ads. 1P ads outgrew GMV by 10 points in Q2; ad GMV penetration rose from 2.4% to 2.7%.
Stacked violet (1P), near-black (3P) and green (off-platform) columns with totals above; legend box at top-left; two-row summary strip (1P vs GMV, GMV penetration); definitions in footnotes.
Expenses as a percent of revenue, Q2'25 vs Q2'26: cost of revenue 26.8% to 25.9%; operating expense 45.6%, up 0.7 pts Y/Y, with sales and marketing 20.6% to 21.4%, product development 13.4% to 12.7%, G&A 7.8% to 7.2% and transaction losses 3.2% to 4.2%, each with a one-line explanation (UK managed shipping accounting, reorganization efficiencies, higher consumer protection losses).
Five pairs of small bar charts (dark navy prior year vs light teal current year); the four opex pairs are grouped inside a rounded frame headed 'Operating Expense at 45.6%, up +0.7 pts Y/Y'; short captions under each pair.
Non-GAAP operating income ($M): 767, 771, 760, 771, 907 and 893 in Q2'26 (+16% Y/Y). Non-GAAP operating margin: 29.6%, 28.3%, 27.0%, 26.0%, 29.4% and 28.5%. 2025 quarters are recast for ASU 2025-06.
Teal column chart with values and growth above bars, margin summary strip below, footnotes on recast methodology.
Non-GAAP EPS: $1.37, $1.36, $1.35, $1.41, $1.66 and $1.60 in Q2'26 (+17% Y/Y). GAAP EPS row: $1.05, $0.78, $1.27, $1.14, $1.12 and $1.21 (+56% Y/Y in Q2'26).
Amber/yellow column chart with values and growth labels, two-row GAAP EPS and GAAP Y/Y summary strip below.
Free cash flow ($M): 644, (441), 803, 478, 898 and 326 in Q2'26. CapEx as % of revenue rose to 7% in Q2'26 from 2%-4% earlier; FCF as % of revenue 25%, n/m, 28%, 16%, 29% and 10%.
Green column chart with a zero baseline showing one negative bar below the axis, values printed in white inside bars, two-row CapEx % and FCF % strip below.
Capital returned ($M): 759, 759, 757, 756, 639 and 448 in Q2'26, made up of $310M stock repurchases and $138M cash dividends. Average diluted shares fell from 475M to 455M. About $2.0B of repurchase authorization remained as of June 30, 2026.
Stacked purple (repurchases) and dark plum (dividends) columns with totals above, legend box, diluted share strip and a black full-width banner with the remaining authorization.
Q2'26 ending cash and investments $4.9B, debt $6.7B and net debt $1.9B. Remaining equity investments worth about $0.8B, mainly Aurelia equity (~$0.5B). Targets: maintain BBB+ rating, mid-term leverage around 1.5x net debt and gross debt below 3.0x adjusted EBITDA. Credit ratios: 0.6x net debt, 2.3x gross debt.
Left: gold and brown waterfall-style bars above and below a baseline with a yellow rounded callout box. Right: separated by a vertical rule, 'Targets' and 'Credit Ratios' headings with bullet lists.
Q3'26 guidance: GMV $22.0-$22.4B (9%-11% spot, 10%-12% FXN, 7%-9% organic FXN; Depop adds about 2.5 pts); revenue $3.07-$3.12B (Depop about 1.5 pts); non-GAAP operating income $0.77-$0.80B implying 25.1%-25.6% margin with Depop a 3-4 pt headwind; non-GAAP EPS $1.36-$1.42 with mid-single-digit Depop dilution.
Four-row table: metric labels left, black-headed GUIDANCE column with large ranges, teal-headed CONTEXT column with bullet explanations.
Full-year 2026 outlook: GMV growth 11.5%-12.5% FXN with Depop adding about 1.5 pts and revenue growth 11%-12% FXN; non-GAAP operating income growth 10%-12% with a ~2 pt Depop headwind and Depop accretive by 2028; non-GAAP EPS growth 10%-12% with ~2.5 pts Depop dilution and a 17.5% tax rate; capital allocation of ~$2B buybacks, a $0.31 Q3 dividend and 90%-100% of normalized FCF returned.
Four horizontal rows, each with a colored rounded label block on the left (blue, navy-teal, teal-green, purple) connected to an outlined rounded bullet box on the right.
Section divider marking the start of the appendix.
Full-bleed teal background with navy logo and large navy 'Appendix' headline.
Six-quarter reconciliation from GAAP operating income ($676M in Q2'26) to non-GAAP operating income ($893M), adding back stock-based compensation ($188M), amortization, restructuring, legal matters and transaction costs; GAAP margin 21.6% vs non-GAAP margin 28.5% in Q2'26.
Full-width financial table with gray zebra-shaded rows, quarter columns labelled 'As Adjusted' for 2025, and an ASU 2025-06 note at the bottom.
Reconciles GAAP income from continuing operations ($552M in Q2'26) to non-GAAP net income ($727M) and non-GAAP EPS ($1.60), including equity investment fair value changes and tax effects; diluted shares 455M.
Full-width six-quarter financial table with shaded rows and separate per-share and share-count rows.
Waterfall bridging non-GAAP EPS of $1.60 to GAAP EPS of $1.21: minus $0.37 for stock-based compensation and amortization and minus $0.02 for restructuring, tax rate and other items.
Four-bar waterfall chart: solid teal start and end bars, pale teal floating decrement bars connected by dashed lines, category labels below.
Side-by-side reported, non-GAAP entries and non-GAAP statements of income for Q2'26 and Q2'25: net revenues $3,134M vs $2,730M, non-GAAP gross profit $2,322M, non-GAAP operating income $893M, operating margin 28.5% and effective tax rate 17.5%, with lettered notes (a)-(f) explaining adjustments.
Dense two-period income statement table with three sub-columns per period, indented line items, lettered adjustment references and a notes legend at the bottom.
Free cash flow derived as operating cash flow less purchases of property and equipment for six quarters; Q2'26: $549M operating cash flow minus $223M capex equals $326M FCF.
Compact three-row table across six quarter columns, with large white space below.
Total net revenues for six quarters ($2,585M to $3,134M) with hedge gain/loss and foreign currency impact lines (Q2'26: $(1)M hedge, $22M FX).
Single highlighted total row with two footnoted detail rows under six quarter columns.
Bridges as-reported revenue growth (1%, 6%, 9%, 15%, 19%, 15%) through acquisition/disposition and FX impacts to organic FX-neutral revenue growth (1%, 4%, 8%, 13%, 17%, 14%).
Four-row growth table with shaded rows and an underlined result row across six quarters.
Quarter-end common shares outstanding (463M down to 445M) plus RSU shares gives fully diluted shares falling from 482M to 465M by June 30, 2026.
Three-row table across six quarter columns with shaded rows.
Adds back taxes, depreciation, amortization, interest, equity investment gains/losses, restructuring, legal matters and transaction costs to reach adjusted EBITDA of $695M, $674M, $686M, $691M, $824M and $792M across six quarters, with five footnotes explaining definitions and the ASU recast.
Full-width table with bold GAAP and adjusted EBITDA rows, indented adjustment lines and numbered footnotes beneath.
TTM adjusted EBITDA grew from $2,647M to $2,993M; gross debt about $6.7B; total cash and non-equity investments $4,851M at Q2'26; net leverage 0.6x and gross leverage 2.3x, with six footnotes defining each measure.
Financial table with indented cash sub-lines and bold leverage rows, followed by a block of numbered footnotes.
Q3'26 guidance reconciliation: net revenue $3.07-$3.12B under both GAAP and non-GAAP; diluted EPS $0.94-$0.99 GAAP vs $1.36-$1.42 non-GAAP, excluding amortization ($24-$28M), stock-based compensation ($168-$178M), transaction costs ($14-$16M) and tax adjustments.
Small two-column table (GAAP, Non-GAAP) under a 'Three Months Ending September 30, 2026' header with a paragraph note below.
Explains early adoption of ASU 2025-06 (internal-use software costs) effective January 1, 2026 with full retrospective method, and presents 2025 and 2024 GAAP income statements as reported, the adjustment and as recast (e.g. FY2025 revenue $11,100M, recast operating income $2,258M).
Two bullet paragraphs on top, centered bold subtitle, then a very dense three-block table (As Reported / Adjustment / As Recast) with quarterly and annual columns.
Same ASU 2025-06 recast shown for the non-GAAP income statement: 2025 and 2024 quarterly and annual results as reported, adjusted and recast, including non-GAAP EPS of $5.49 for FY2025 as recast.
Identical structure to page 36: explanation bullets, subtitle and three-block wide financial table.
Reconciles the ASU adoption adjustments between the GAAP and non-GAAP income statements, showing GAAP adjustments, GAAP to non-GAAP adjustments for internal-use software and the resulting non-GAAP adjustments by quarter and year.
Explanation bullets above a three-block adjustment table with a small note (a) inside the middle block.
Recasts the operating cash flow to free cash flow reconciliation for 2025 and 2024: operating cash flow and capex both shift by the capitalized software amounts, leaving free cash flow unchanged (FY2025 $1,484M, FY2024 $1,956M).
Explanation bullets, subtitle and a short three-block table (As Reported / Adjustment / As Recast).
Closing slide showing only the multicolor eBay logo.
Full-bleed black background with the red, blue, yellow and green eBay wordmark centered.
Bu slayt ve temel sunum içeriği hakkında yaygın sorular.
It is eBay's 40-page Business & Financial Highlights deck from August 5, 2026. It covers the Q2 snapshot ($22.4B GMV, $3.13B revenue, $1.60 non-GAAP EPS), strategic priorities, focus categories, the Depop acquisition, C2C, eBay Live and UK shipping. It then runs six quarters of GMV, revenue, advertising, expense, operating income, EPS, free cash flow, capital return and cash and debt charts, followed by Q3 and FY2026 guidance and a 16-page reconciliation appendix.
Yes. The gallery page has both the original PDF and a PPTX version converted from it, so you can reuse the chart layouts, guidance tables and section dividers in PowerPoint, Keynote or Google Slides. The PPTX comes from a conversion, so check fonts and chart objects after you open it.
The Q2'26 Results guidance-versus-actuals table (page 12), the stacked GMV chart with an organic growth strip (page 13), the revenue bars with a take-rate line (page 14), the paired expense-ratio charts (page 16), the EPS waterfall (page 27) and the Q3 guidance-with-context table (page 22) adapt easily to any company's quarterly review.
Page 7 shows Depop's logo and app next to a 'Completed the acquisition on July 30' badge, compares the complementary strengths of eBay and Depop, and lists three numbered integration priorities. The guidance pages then spell out Depop's contribution to GMV and revenue and its headwind to operating income and EPS. It is a good model for describing an acquisition to investors.
Yes. It uses the core marketplace metrics investors expect: GMV split by geography, take rate, advertising penetration, enthusiast buyers, C2C supply and recommerce. Founders can follow the same structure for an investor update or board deck at a smaller scale.
It uses a bold brand-color system: a black cover and closing slide with the multicolor eBay logo, bright blue and teal section dividers, rounded white cards with blue takeaway banners, and a different solid color for each financial chart. Lifestyle photography sits beside large sans-serif headlines.
eBay early-adopted accounting standard ASU 2025-06 for internal-use software on January 1, 2026, using the full retrospective method. Pages 36 to 39 recast 2025 and 2024 GAAP and non-GAAP income statements and free cash flow so investors can compare periods on the same basis. They are useful layouts if you ever need to present a restatement.

Create Your Own Slides
Turn your ideas into professional presentations in seconds with 2slides AI.
Profesyonel tasarımları referans alın, stilinizi seçin ve mükemmel metin oluşturma ile slaytlar oluşturun. Nano Banana ile desteklenir—şimdi sunumunuzu oluşturmaya başlayın.
Slaytlar için AI Ajanınız. Akıllı sunum oluşturma ile zaman kazanın, daha hızlı parlayın.


© 2026 2slides. Tüm hakları saklıdır.