
2025 E-Commerce Trends - Global Shopper Insights Report by DHL
Hızlı Navigasyon
Etiketler
Slaytları paylaş
2025 E-Commerce Trends - Global Shopper Insights Report by DHL
Her slayt sayfasının detaylı görünümü, düzen, temel içerik ve görsel öğeler dahil.
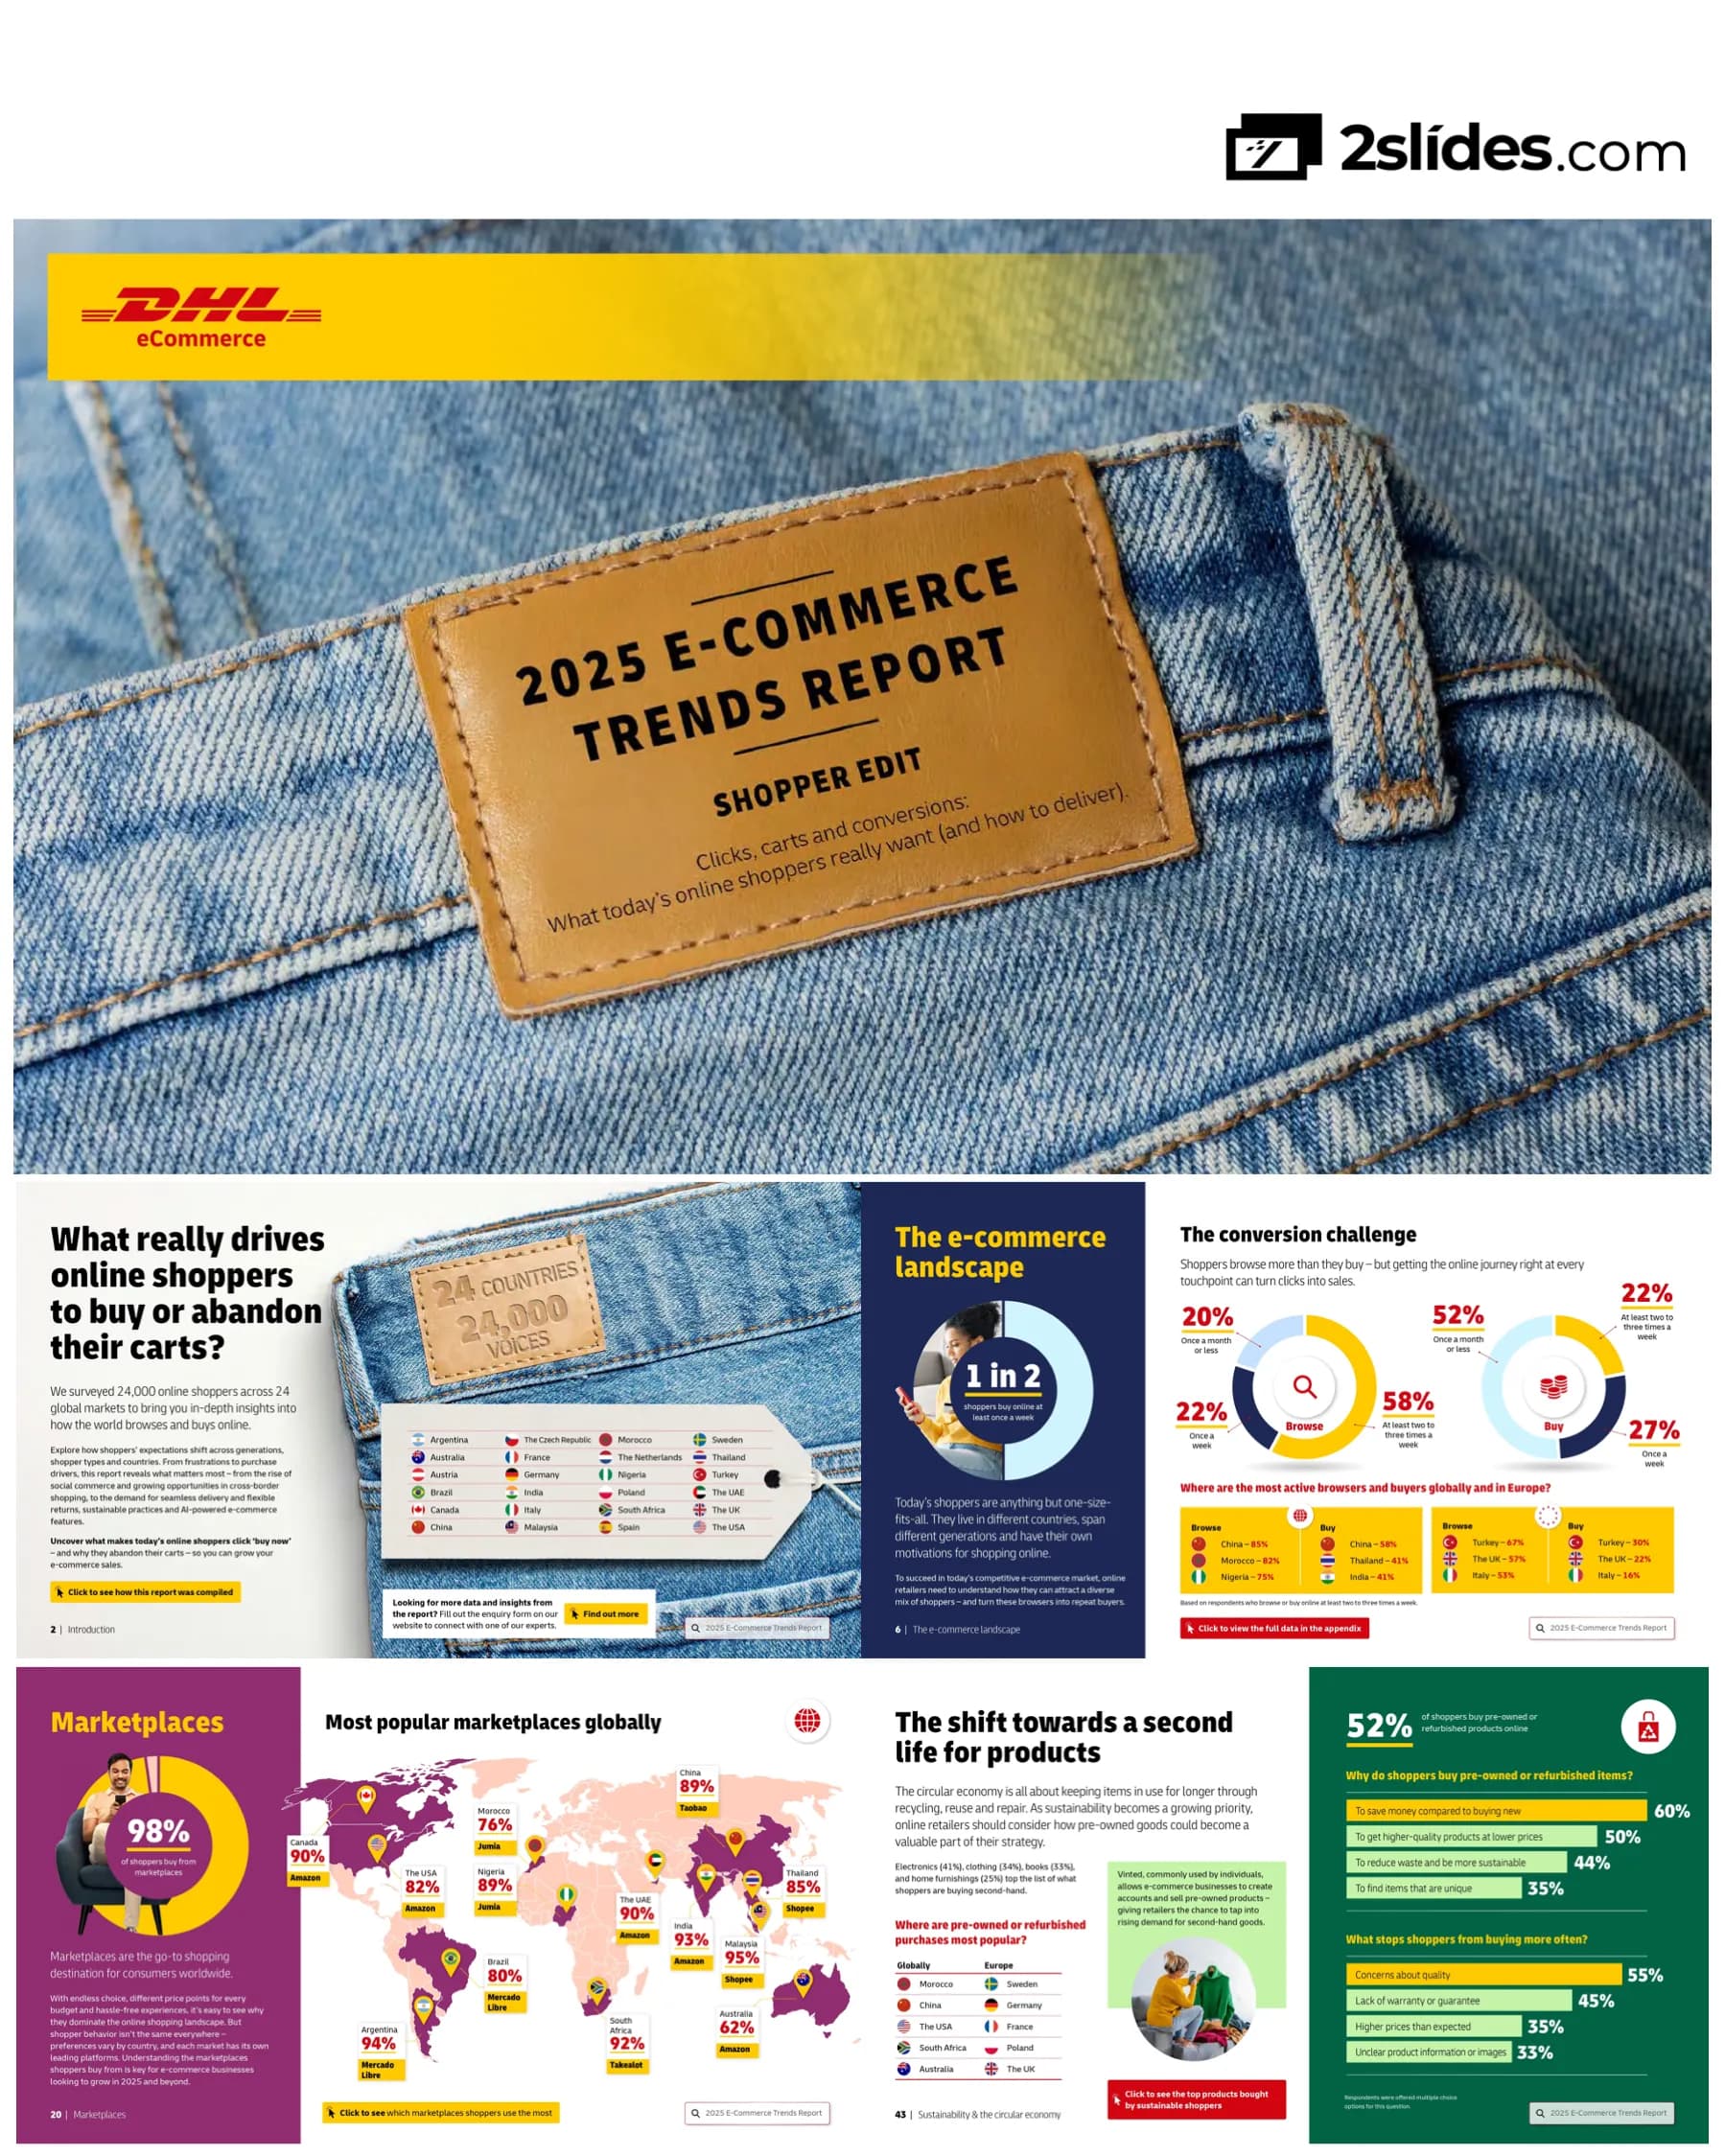
Introduces the report's title, theme ('Shopper Edit'), and core focus: understanding what drives clicks, carts, and conversions for today's online shoppers.
Full-page title slide with bold typography, minimalist design, and accent color highlighting key phrases.
States the report's foundation: a survey of 24,000 shoppers across 24 countries. Lists all countries surveyed and provides a call-to-action for more data.
Two-column layout. Left side presents the core question and survey scale. Right side lists the 24 countries in a grid.
Outlines the 8 key chapters covered in the report: E-commerce Landscape, Social Commerce, Marketplaces, Black Friday, Cross-border, Delivery & Returns, Sustainability, and AI.
Visual table of contents with icon and brief description for each chapter topic.
Defines key shopper segments analyzed in the report: Generations (Gen Z to Boomers) and Behavior-based types (Social, Cross-border, Sustainable, etc.).
Grid-based definition cards for each shopper persona, with a clear label and concise description.
Chapter title slide introducing the first major section on general online shopping habits and challenges.
Minimalist chapter divider with title and report branding.
Presents data on how often people browse and buy online. Highlights the 'conversion challenge' and shows top countries for browsing/buying globally and in Europe.
Multi-panel layout combining a large statistic ('1 in 2'), a donut chart for frequency, and comparative bar charts for country-level data.
Focuses on the dominance of smartphones and the rise of voice commerce. Provides stats on device usage and recommendations for optimizing for voice search.
Top section with narrative insights and recommendations. Bottom section uses a horizontal bar chart to compare device popularity across regions.
Identifies high delivery costs and long times as top frustrations, and free/fast delivery as top desired improvements. Includes country-specific pain points.
Dual-column comparison. Left side lists 'Frustrations' with associated stats. Right side lists 'Improvements' with associated stats.
Shows popular product categories bought online (clothing leads). Provides specific examples of how shoppers in different countries purchase best-selling items (via subscription, social media, etc.).
Two main sections. Left: ranked list of product categories with percentages. Right: specific, data-driven examples linking countries, products, and purchase channels.
Highlights the critical role of payment options in preventing cart abandonment. Focuses on the rise of Buy Now, Pay Later (BNPL), showing adoption by segment and preferred methods by region.
Combines narrative explanation with segmented data visualizations: demographic adoption of BNPL and a chart of popular payment methods by country.
Details the specific reasons shoppers abandon carts, with slow delivery as #1. Emphasizes the importance of trusted delivery/returns providers, especially for Baby Boomers.
Lead with key statistic and top reason. Lists other major abandonment factors with percentages. Includes a generational insight callout.
Analyzes how reviews build trust and influence purchases. Shows what makes reviews trustworthy (photos, detail, verified badges) and how this varies by generation and country.
Narrative supported by key stats. Uses a multi-column chart to visualize elements of trust and their popularity in specific countries.
Explores the growing subscription economy, its drivers (convenience, savings), and popularity across segments and countries. Provides tips for success in this market.
Market overview with growth forecast. Segmented data on 'Who's signing up' and 'Where it's popular'. Concludes with actionable bullet points for businesses.
Chapter title slide introducing the section on purchasing through social media platforms.
Minimalist chapter divider.
Highlights that 7 in 10 shoppers have bought via social media. Breaks down which platforms drive sales in different global regions and for different generations.
Lead statistic followed by platform analysis. Uses a map/graphic to show popular platforms by region and a separate callout for China's unique ecosystem.
Shows the massive financial scale of social commerce and how it changes habits (more research, impulse buys). Lists key factors that give shoppers confidence to buy on social (free returns, reviews).
Dual-panel. Left: Market growth data and habit change statistics. Right: Ranked list of confidence-building factors with percentages.
Focuses on the power of viral trends and live-streamed shopping events. Shows which types of social content influence purchases most, with country-level data.
Top section covers trends and live shopping interest. Bottom section uses a horizontal bar chart to show the impact of different content types by country.
Forecasts how shopping behavior on key platforms (Instagram, Facebook, TikTok, YouTube) will change by 2030, with detailed breakdowns by generation.
Uses a multi-series stacked bar chart for each platform to show projected behavior (Buy more/same/less/etc.). Includes key generational takeaways.
Chapter title slide for the section on online marketplaces.
Minimalist chapter divider.
Shows that 98% of shoppers use marketplaces. Uses a world map graphic to highlight the dominant marketplace in key countries globally.
World map as central visual, with country labels and their leading marketplace name and percentage.
Provides key stats on major global players (Amazon, Temu, Shein, etc.) and their core audiences. Also details the most popular marketplaces in European countries.
Two-column layout. Left: bullet points with stats on major global platforms. Right: list of European countries with their top marketplace and penetration rate.
Chapter title slide for the Black Friday/Cyber Monday analysis.
Minimalist chapter divider.
Analyzes shopper participation, trust in deals, spending changes, and primary motivations during Black Friday. Highlights generational differences in trust and activity.
Multi-panel layout combining a large participation stat, pie/bar charts for spending/trust, and a list of motivating factors.
Chapter title slide for cross-border shopping analysis.
Minimalist chapter divider.
Establishes that 3 in 5 shoppers buy internationally. Lists which shopper segments are most active in cross-border and shows top countries for this behavior.
Lead statistic followed by a ranked list of shopper segments by adoption rate. Includes a list of top countries for cross-border shoppers.
Uses a flow diagram to show which countries global shoppers buy from most (China, USA, Germany lead). Discusses trust as a key factor and generational shifts in sourcing.
Sankey diagram or flow chart visualizing export countries and their share of cross-border purchases. Narrative provides analysis on trust and generational trends.
Breakdown of why shoppers buy from abroad (price, availability), why they don't (fear of fraud, delivery), and what would encourage them (free delivery, secure payments).
Three-column comparison table, neatly organizing 'Why buy', 'Why not buy', and 'What would encourage' factors with corresponding percentages.
Chapter title slide for the deep dive on delivery and returns.
Minimalist chapter divider.
Emphasizes that trust in the provider is critical. Focuses on the overwhelming demand for 'free' delivery and returns, showing stats on abandonment due to fees.
Dual-panel focus on Delivery and Returns. Each panel states a key stat about shopper preference for 'free' and the consequence of not offering it (cart abandonment).
Presents a detailed data table showing country-by-country preferences for delivery method (Home, Locker, Shop) and returns method (Home Collection, Locker, Shop).
Large, clear data table with countries as rows and preference percentages for different delivery/return options as columns. Includes global averages.
Shows growth in out-of-home (parcel locker/shop) delivery and returns, especially in Europe. Provides generational insights and year-over-year growth data.
Combines narrative insights with a comparative data table showing 2024 vs. 2025 preferences for home vs. out-of-home options, globally and in Europe.
Highlights shopper desire to redirect parcels. Shows popular redirection options (safe place, change day, parcel shop) and how they prefer to track/redirect (provider's app).
Two sections. Top: horizontal bar chart of popular redirection options with top countries. Bottom: similar chart for tracking/redirect methods.
Provides data on how often shoppers return items. Features a large table detailing return behavior metrics (ever returned, return rate, provider trust impact) for all 24 countries and generations.
Lead with a simple frequency chart. Main content is a wide data table providing three key metrics across all segments and countries.
Lists the top reasons for returns (poor quality, wrong size). Introduces the opportunity to reduce returns via better product info and virtual try-on features.
Left: ranked list of return reasons with percentages. Right: narrative insight on the problem and solution (virtual try-on), supported by a relevant stat.
Analyzes the move from pre-printed return labels to digital/QR code options. Shows preference by generation and provides a country-by-country breakdown of label method preference.
Top: narrative and generational comparison. Bottom: data table showing preference for three return label methods across all countries.
Recaps the most critical statistics on how delivery/returns impact cart abandonment, trust, and sales across different contexts (social, cross-border). Presents DHL's value proposition.
Collection of key stat callouts drawn from previous pages, unified under a central thesis. Concludes with a service provider solution block.
Chapter title slide for sustainability analysis.
Minimalist chapter divider.
Shows that 7 in 10 shoppers care about sustainability, but intensity varies greatly by country (highest in Nigeria/India, lowest in Netherlands). Highlights cart abandonment due to sustainability concerns by generation.
Lead stat, followed by a ranked list of 'Most' and 'Least' concerned countries. Bottom section shows generational data on sustainability-driven cart abandonment.
Presents direct shopper quotes explaining why sustainability is or isn't important to them, revealing tensions between values, trust, transparency, and price.
Dual-column comparison. Left column: quotes supporting importance. Right column: quotes questioning importance or citing barriers.
Lists the specific sustainable actions shoppers want retailers to take, led by sustainable packaging and plastic removal. Highlights demand for delivery emissions information.
Ranked list of desired retailer actions with percentages. Includes a special callout on delivery impact, noting top countries where this matters.
Measures how far shoppers will go to support sustainability: choosing sustainable providers, accepting longer times, switching to drop-off, or paying more.
Lead stat on growing importance. Main visual is a horizontal bar chart ranking shopper willingness to take specific actions. Includes trust stat for DHL on sustainability.
Shows market growth forecasts for sustainable products. Provides data on who buys them: by generation, shopper type, and country (China, Thailand, India lead).
Top: market size data. Bottom: two data panels - one for demographic/segment adoption, one for country-level adoption rates.
Focuses on the market for pre-owned/refurbished goods. Shows what categories are popular, global/European hotspots, and the drivers/barriers for shoppers.
Three-panel layout. Left: adoption stat and top product categories. Center: lists of popular countries. Right: dual lists of 'Why buy' and 'What stops' reasons.
Explores shopper interest in retailer take-back programs. Shows which segments are most likely to participate and what would make these programs more appealing.
Top: headline interest level and segmented adoption chart. Bottom: horizontal bar chart of factors that would increase participation.
Chapter title slide posing the question of AI's role in e-commerce.
Minimalist chapter divider.
Highlights strong shopper demand for AI features (7 in 10 want them) and massive market growth forecasts. Lists the most wanted AI shopping features, led by virtual try-on.
Top: demand stat and market size data. Bottom: ranked list of desired AI features with high percentages for each.
Chapter title slide for detailed persona deep dives.
Minimalist chapter divider.
Deep dive on Gen Z: Social-first, sustainability-driven, global shoppers who use BNPL and are quick to abandon carts over ethical concerns.
Thematic sections (Social-first, Global, Sustainable) with supporting statistics and insights presented in a clean, scannable layout.
Deep dive on Millennials: Frequent shoppers, app-savvy, high returners, and leaders in adopting BNPL payment options.
Thematic sections (Frequent Browsers/Buyers, Not Afraid to Return, Leading BNPL) with supporting stats in a three-column grid at the bottom.
Deep dive on Gen X: Value transparency in costs, are cautious social shoppers, and rely heavily on proof (reviews) before purchasing.
Thematic sections (Expect Transparency, Cautious Social Shoppers, Proof Before Purchase) with supporting stats and insights.
Deep dive on Baby Boomers: Trust-driven, need comprehensive information before buying, and are quietly conscious about sustainability.
Thematic sections (Trust-Driven, Want the Full Picture, Quietly Conscious) with a three-column stat grid for key trust and behavior metrics.
Title slide indicating the start of behavior-based persona deep dives.
Minimalist divider.
Profile of the Social Shopper: Discovery-driven, shops more frequently, trusts peer opinions, and has high expectations for speed. Includes key stats on app use and Black Friday trust.
Narrative description followed by a grid of key statistics that define this persona's behavior.
Profile of the Cross-border Shopper: Sustainability-conscious, seeks free delivery but hates surprise charges, and relies heavily on reviews and social proof.
Narrative description followed by a three-column grid of statistics covering sustainability, cost sensitivity, and proof-seeking behaviors.
Profile of the Sustainable Shopper: Environmentally conscious but balanced with value, demands trust beyond claims, and actively buys pre-owned/refurbished items.
Narrative description followed by a selection of key statistics that paint a picture of their expectations, trust issues, and circular economy participation.
Profile of the Subscription Shopper: High-frequency buyers with high expectations, trend-ready tech adopters (voice, AI), and heavily influenced by others' opinions.
Narrative description followed by a three-column grid of statistics highlighting their frequency, tech adoption, and social influence.
Profile of the Black Friday Shopper: Delivery terms are critical, open to international purchases, prone to impulse buys, and influenced by real voices (reviews).
Narrative description followed by a dense grid of statistics covering delivery demands, cross-border activity, and impulse/trend susceptibility.
Profile of the Refurbished/Recycled Shopper: Sustainability-driven, expects first-class service despite buying second-hand, and requires detailed info for confidence.
Narrative description followed by key statistics that highlight their sustainability drive, service expectations, and need for information/trust signals.
Promotional slide for additional, detailed Country Reports available from DHL, offering deeper market-specific insights.
Simple value proposition statement with visual suggestion of country flags or a globe.
Concluding remarks from Pablo Ciano, CEO of DHL eCommerce, summarizing the evolving landscape. Final call-to-action inviting businesses to connect with DHL experts for growth.
Top: inspirational conclusion summarizing key themes. Bottom: formal CEO quote. Final section: clear CTA box with DHL service promise.
Title slide introducing the appendix containing detailed survey data tables.
Minimalist divider.
Detailed data table showing the percentage of shoppers in each country who browse and buy online at different frequencies (2-3x/week, weekly, monthly or less).
Two extensive side-by-side tables for 'Browse' and 'Buy' behaviors, with countries as rows and frequency categories as columns. Includes Global and Europe averages.
Detailed data table showing browsing and buying frequencies segmented by generation and shopper persona.
Two tables (Browse, Buy) with shopper segments as rows and frequency categories as columns.
Large matrix table showing the percentage of each shopper segment (generations, personas) that buys each of 15 product categories.
Matrix with shopper segments as rows and product categories as columns, filled with percentage data.
Table showing what percentage of shoppers buy each product category via specific channels (subscription, social media, cross-border, etc.).
Matrix with product categories as rows and purchase channels as columns, filled with percentage data.
Table showing how different types of social media content influence the purchasing decisions of various shopper segments.
Matrix with shopper segments as rows and content types (influencer posts, ads, reviews, etc.) as columns, filled with percentage data.
Extensive table showing how different types of social media content influence purchasing decisions, broken down for all 24 countries, plus Europe and Global averages.
Large matrix with countries as rows and social content types as columns, filled with percentage data.
Two-part data presentation. Top: Table of current platform usage (% who buy from) by country, including China-specific platforms. Bottom: Table of current usage by generation.
Two distinct data tables stacked vertically, each with a clear header defining the data set.
Data tables forecasting how shopping behavior on Facebook, Instagram, and TikTok will change over 5 years, broken down by country.
Three wide tables (one per platform) stacked, showing country-level projections for 'Buy More', 'Same', 'Less', 'Might Use', 'Never Use'.
Continuation of future intent data for Pinterest, Snapchat, and YouTube, broken down by country.
Three wide tables (one per platform) stacked, similar to page 69.
Data tables forecasting shopping behavior changes on FB, IG, TikTok over 5 years, broken down by generation and shopper persona.
Three wide tables (one per platform) stacked, showing segment-level projections.
Continuation of future intent data for Pinterest, Snapchat, and YouTube, broken down by generation and shopper persona.
Three wide tables stacked, similar to page 71.
Lists the top 3 most used marketplaces in each of the 24 surveyed countries, with penetration percentages. Also lists top global marketplaces with usage percentages.
Two-column list of countries, each with a sub-list of their top 3 marketplaces and %s. Bottom section for global platform rankings.
Table showing the percentage of shoppers in each country (and each segment) who do vs. do not buy from online retailers based in other countries.
Two side-by-side tables. Left: Country-level Yes/No percentages. Right: Segment-level (Generation, Persona) Yes/No percentages.
Tables showing how frequently shoppers buy cross-border, at both the country level and the segment (generation/persona) level.
Two tables stacked. Top: Country-level frequency data. Bottom: Segment-level frequency data.
Tables showing preferred delivery methods and preferred returns methods, broken down by generation and shopper persona.
Two tables side-by-side: 'Delivery Preferences' and 'Returns Preferences', with shopper segments as rows.
Tables showing where shoppers prefer to redirect their deliveries, broken down by country and by shopper segment.
Two tables stacked. Top: Extensive country-level data for 5 redirection options. Bottom: Segment-level data for the same options.
Describes the survey methodology: sample size (24,000), country count (24), respondent criteria (purchased online in last 3 months), timing (Feb-Mar 2025), and data presentation notes.
Clean text-based layout explaining the research foundation. Serves as the final slide, establishing credibility.
Bu slayt ve temel sunum içeriği hakkında yaygın sorular.
The single biggest driver of cart abandonment is slow delivery, especially in markets like Thailand, China, and Malaysia. To combat this, prioritize offering fast and affordable shipping options. Crucially, 81% of shoppers abandon carts if their preferred delivery option isn't offered, and 79% do so if their preferred returns option isn't available. Optimizing the checkout process around flexible, trusted, and preferably free delivery and returns is paramount.
Gen Z are social-first, sustainability-driven global shoppers. Focus on TikTok/Instagram, highlight ethical practices, offer BNPL, and ensure seamless cross-border options. Baby Boomers are trust-driven and need full information. Prioritize clear delivery/returns info from trusted providers like DHL, provide detailed product descriptions, and be transparent on pricing. They are the most likely to abandon a purchase if they don't trust the logistics provider.
Absolutely. 7 in 10 shoppers have made a purchase on social media, and the market is forecast to exceed $1 trillion by 2028. To succeed, focus on building trust directly on the platform: offer free delivery and returns, showcase customer photos/videos, and provide secure payment options. Live shopping events and shoppable posts are particularly effective for engagement and conversion.
Action, not just claims. The top request (53%) is for the use of sustainable packaging, followed by removing plastic (50%). However, a major trust barrier exists. Shoppers need straightforward, reliable information. A highly valued action is providing environmental impact data for deliveries (important to 57% globally, and over 87% in Nigeria/India), coupled with offering lower-impact delivery options.
They are non-negotiable. While home delivery remains popular for receiving goods, out-of-home returns (via parcel lockers or shops) are the new norm, chosen by 66% of global shoppers and 79% in Europe. Growth in out-of-home delivery and returns is significant (up 25% and 43% globally YoY). Offering this flexibility, along with the ability to easily redirect parcels, is a key expectation.
Focus on features that reduce uncertainty and improve the pre-purchase experience. Shoppers most want Virtual Try-On (77%) and AI-powered shopping assistants (76%). These address top return reasons like 'wrong size' or 'didn't suit them.' Voice-enabled search (72%) and AR experiences (71%) are also high on the list, aligning with the rise of mobile and voice commerce.
The primary barrier is fear of fraud (52%), especially high in South Africa, Malaysia, and Nigeria. To overcome this, offer secure payment options and buyer protection. Other major barriers are longer delivery times (46%) and unexpected customs charges (43). To win cross-border sales, prioritize transparency on total costs (including clear customs guidance), offer free delivery and returns where possible, and use trusted, known delivery providers.

Create Your Own Slides
Turn your ideas into professional presentations in seconds with 2slides AI.
Profesyonel tasarımları referans alın, stilinizi seçin ve mükemmel metin oluşturma ile slaytlar oluşturun. Nano Banana ile desteklenir—şimdi sunumunuzu oluşturmaya başlayın.
Slaytlar için AI Ajanınız. Akıllı sunum oluşturma ile zaman kazanın, daha hızlı parlayın.




© 2026 2slides. Tüm hakları saklıdır.