
Şu koleksiyonda: Yatırımcı sunumu örnekleri · E-ticaret sunumu örnekleri
Coupang Q2 2026 Earnings Presentation: 23 slides from Coupang's second-quarter 2026 financial results (August 4, 2026). Total net revenues reached $8.9B, up 4% YoY and 10% FX-neutral. Gross margin was 28.2%, and the quarter's net loss of $(570)M includes $410M of administrative fines. Adjusted EBITDA came in at $163M (1.8% margin). The deck also covers Product Commerce and Developing Offerings segment results, Product Commerce active customers (24.7M), and a full non-GAAP reconciliation appendix.
Hızlı Navigasyon
Etiketler
Slaytları paylaş
Coupang Q2 2026 Earnings Presentation: 23 slides from Coupang's second-quarter 2026 financial results (August 4, 2026). Total net revenues reached $8.9B, up 4% YoY and 10% FX-neutral. Gross margin was 28.2%, and the quarter's net loss of $(570)M includes $410M of administrative fines. Adjusted EBITDA came in at $163M (1.8% margin). The deck also covers Product Commerce and Developing Offerings segment results, Product Commerce active customers (24.7M), and a full non-GAAP reconciliation appendix.
Her slayt sayfasının detaylı görünümü, düzen, temel içerik ve görsel öğeler dahil.
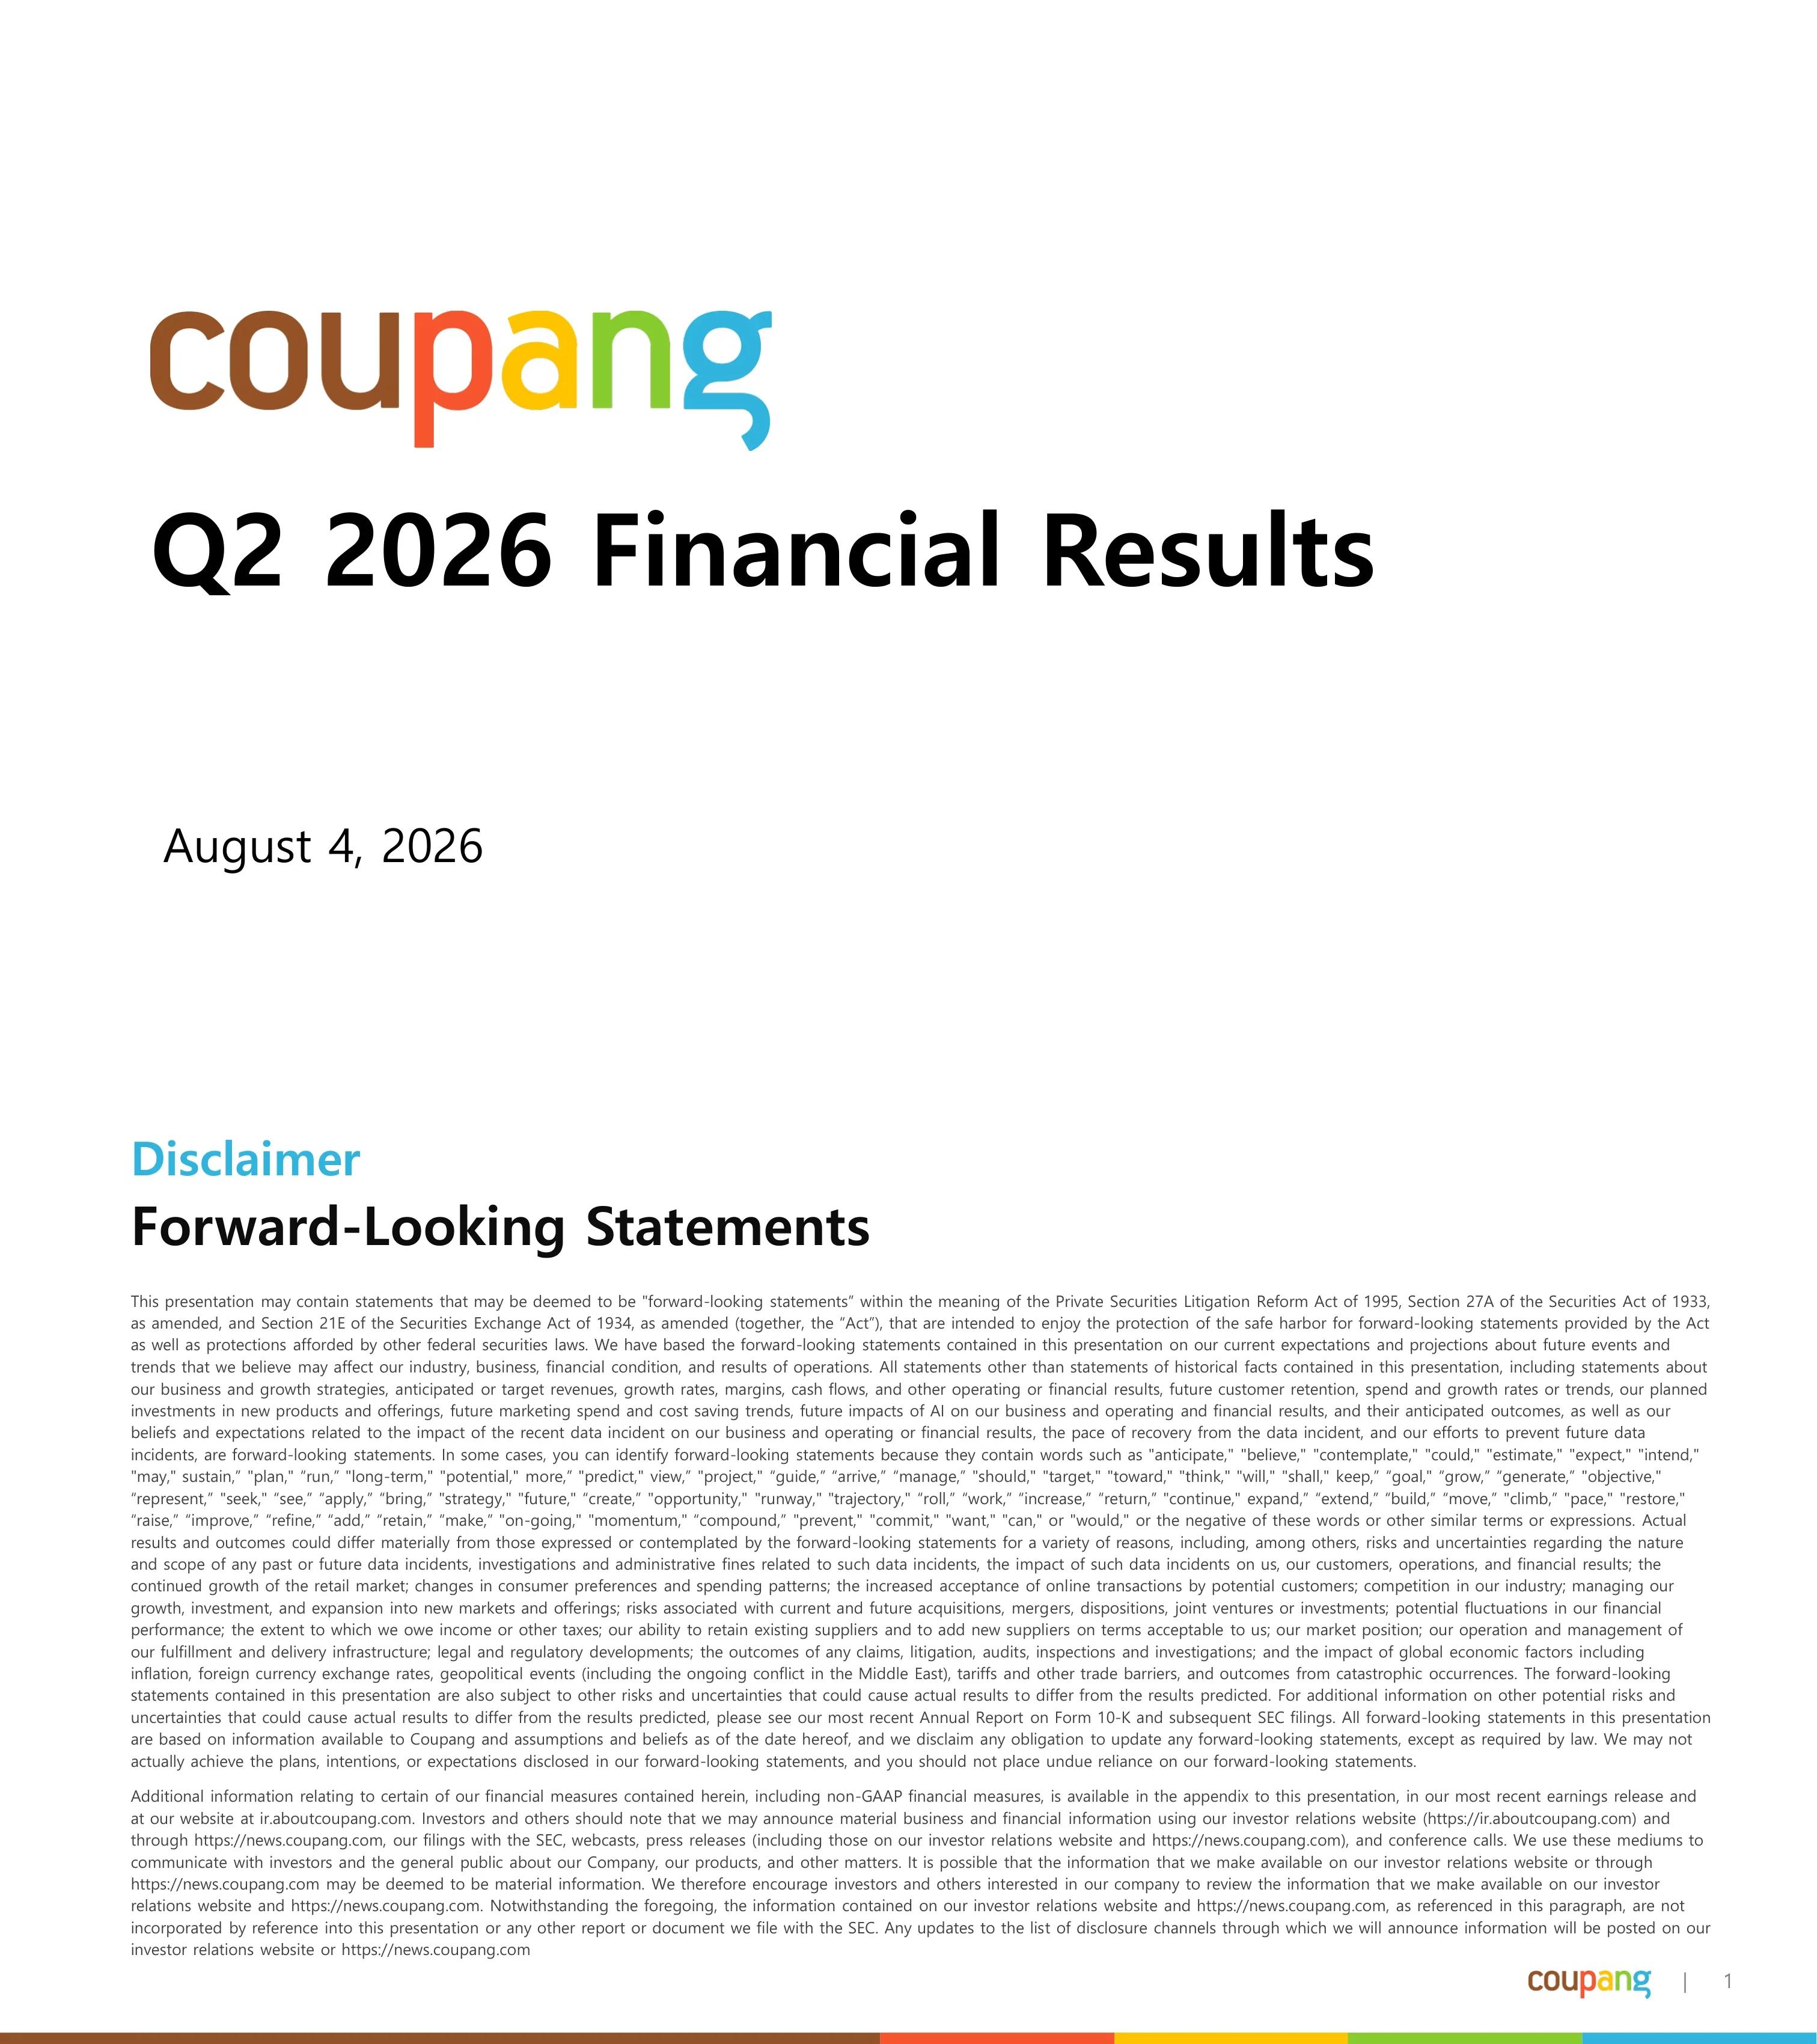
Cover slide with the multicolour Coupang wordmark, the title 'Q2 2026 Financial Results' and the date August 4, 2026.
Left-aligned stack on a plain white canvas: large logo, bold black title below it, and a small date line near the bottom-left.
Safe-harbor language under the Private Securities Litigation Reform Act. It lists risk factors including the recent data incident and related investigations and fines, AI impacts, competition, fulfillment infrastructure, FX, tariffs and the Middle East conflict, and names ir.aboutcoupang.com and news.coupang.com as disclosure channels.
Cyan 'Disclaimer' eyebrow and bold black headline above two dense justified paragraphs of small body text, with the logo and page number bottom-right and the rainbow stripe along the bottom edge.
Total share count fell from 1,900M in Q2 2025 to 1,880M in Q2 2026, a 1.1% reduction. Outstanding common stock went from 1,819M to 1,792M, while outstanding equity-based awards rose from 81M to 88M.
Eyebrow plus headline at top left, then a centred five-quarter stacked bar chart labelled only at the first and last bars, with a legend and footnote below.
Quarterly net revenues grew from $8.5B in Q2 2025 to $8.9B in Q2 2026. That is +4% as reported and +10% in constant currency, with intermediate quarters shown unlabelled.
Two-line bold headline stating both growth rates above a centred five-bar quarterly column chart, with an FX-neutral definition footnote.
Trailing-twelve-month revenues rose from $32.3B to $35.5B: +10% reported and +13% FX-neutral.
Same headline treatment with a two-bar year-over-year comparison chart centred on the slide.
Quarterly gross profit was $2.5B versus $2.6B a year ago: down 3% reported, up 3% FX-neutral. Gross margin slipped from 30.0% to 28.2%.
Three-line headline, then a five-quarter column chart with yellow margin dots and percentage labels inside the first and last bars, plus a 'Margin' legend.
Net income swung from $32M in Q2 2025 to a $(570)M loss in Q2 2026. A callout notes the loss would be $(160)M excluding $410M of certain administrative fines.
Headline above a five-quarter chart with a zero baseline in the upper third. Bars descend below the axis for the loss quarters, and a cyan text callout sits to the right of the final bar with a leader line.
Left: TTM gross profit grew from $9.6B to $10.1B (+4%), with GPM falling 152 bps from 29.9% to 28.4%. Right: TTM net income fell from $365M to $(767)M (down $1.1B), including $410M of administrative fines.
Two-column split slide, each half with its own eyebrow, headline and two-bar chart. The right chart drops below the axis and carries a small annotation.
Quarterly adjusted EBITDA fell from $428M (5.0% margin) to $163M (1.8% margin), down 318 bps. Q1 2026 is visibly the trough. A footnote defines adjusted EBITDA and points to the appendix reconciliation.
Two-line headline above a five-quarter column chart with margin dots, a legend, and a long definition footnote across the bottom.
TTM adjusted EBITDA declined from $1.6B (4.9% margin) to $872M (2.5% margin), a 242 bps margin compression.
Headline plus a centred two-bar comparison with in-bar margin dots and a 'Margin' legend.
TTM operating cash flow dropped from $1.9B to $1.4B (down $484M), and TTM free cash flow from $784M to $105M (down $679M). A footnote defines free cash flow as operating cash flow less net capex.
Two-column split with matching eyebrow, headline and two-bar chart in each half, plus a shared footnote.
Product Commerce quarterly revenue was $7.4B versus $7.3B (+1% YoY, +8% FX-neutral). TTM revenue was $30.0B versus $28.0B (+7%, +11% FX-neutral).
Bold black section title at top, then a two-column layout: a quarterly five-bar chart on the left and a TTM two-bar chart on the right, each with its own eyebrow and headline.
Product Commerce adjusted EBITDA was $382M (5.1% margin) versus $663M (9.0%), down $281M and 390 bps. TTM it was $2.0B (6.7%) versus $2.2B (7.9%), down $210M and 123 bps.
Section title plus two-column quarterly and TTM charts with yellow margin dots and a shared legend.
Active customers who ordered at least once in the quarter grew from 23.9M to 24.7M. A footnote defines the metric.
Single headline with a centred five-quarter column chart and a definition footnote.
Developing Offerings revenue grew from $1.2B to $1.4B quarterly (+20% YoY, +24% FX-neutral) and from $4.3B to $5.5B TTM (+28% both reported and FX-neutral).
Section title with the same two-column quarterly and TTM chart layout used for Product Commerce, which keeps the segments directly comparable.
Developing Offerings adjusted EBITDA losses narrowed by $16M YoY to $(219)M, a (15.3)% margin versus (19.7)%. TTM losses widened by $492M, from $(648)M to $(1.1)B, a (20.8)% margin versus (15.1)%.
Two-column layout with all bars hanging downward from a top baseline to show losses, with margin dots and labels below the bars.
Five numbered principles: deliver new moments of wow for customers; work backwards from jaw-dropping experiences rather than what looks easy; use technology, process innovation and scale for operating leverage and cash flow; always prioritise growth in long-term cash flows; be disciplined capital allocators who start small, test and iterate.
Text-only slide with a bold title and five spaced paragraphs, each led by a cyan ordinal word ('One,' 'Two,' and so on).
Full-bleed photo of a woman opening her front door to Coupang Rocket Fresh deliveries, overlaid with the mission line 'Create a world where customers wonder "How did I ever live without Coupang?"' and the word 'Appendix'.
Edge-to-edge lifestyle photograph with white text overlaid at the lower left, serving as the section break.
Reconciles as-reported revenue to constant currency by segment. Quarterly, Product Commerce went from $7,334M to $7,425M (FX effect $505M, constant currency $7,930M) and Developing Offerings from $1,190M to $1,431M, for a total of $8,856M (+4% reported, +10% constant currency). TTM totals were $32,263M versus $35,462M (+10% reported, +13% constant currency).
Two stacked financial tables (three months and trailing twelve months) with cyan column headers, thin cyan rules and a bold totals row.
Quarterly gross profit by segment: Product Commerce $2,390M to $2,268M ((5)% reported, +1% constant currency) and Developing Offerings $171M to $226M (+32%), for a total of $2,561M to $2,494M ((3)% reported, +3% constant currency).
Single financial table centred vertically, using the same cyan header and rule styling as the previous slide.
Five-quarter bridge from net income to adjusted EBITDA. Q2 2026 net loss of $(570)M plus D&A $145M, interest, taxes, other items, $410M certain administrative fines and $164M equity-based compensation gives adjusted EBITDA of $163M (1.8%). Prior quarters were $428M, $413M, $267M and $29M.
Wide five-column reconciliation table with indented adjustment rows, bold subtotal rows and a footnote defining 'certain administrative fines'.
TTM bridge: net income $340M to $(767)M. Adjustments include D&A $557M, $410M administrative fines, equity-based compensation $533M and a prior-year $(175)M fulfillment center fire insurance gain. TTM adjusted EBITDA was $872M (2.5%) versus $1,574M (4.9%).
Two-column reconciliation table with the label column on the left and the TTM values right-aligned.
Operating cash flow of $1,425M (vs $1,909M), less $334M of land and buildings and $992M of equipment purchases, plus $6M of proceeds, gives free cash flow of $105M (vs $784M). Net cash used in investing was $(1,370)M and financing was $(141)M.
Two-column cash flow reconciliation table with bold key rows and cyan rules separating subtotals.
Bu slayt ve temel sunum içeriği hakkında yaygın sorular.
Total net revenues were $8.9B (+4% YoY, +10% FX-neutral), gross profit was $2.5B at a 28.2% margin, and adjusted EBITDA was $163M (1.8% margin). The net loss attributable to stockholders was $(570)M, or $(160)M excluding $410M of certain administrative fines. Product Commerce active customers reached 24.7M (+3%).
Yes. The gallery page offers both the original 23-page PDF and a PPTX version you can open in PowerPoint, Keynote or Google Slides and adapt for your own results.
Cover and disclaimer, then share dilution, consolidated KPIs (revenue, gross profit, net income, adjusted EBITDA, cash flow) in quarterly and TTM views, then segment results for Product Commerce and Developing Offerings plus active customers. It closes with operating tenets, a photo divider and a five-slide non-GAAP appendix.
Each slide carries one metric. A small cyan label names it, a bold headline states the YoY change in plain words, and a single-colour bar chart labels only the first and latest periods. Margins appear as yellow dots inside the bars. The pattern is quick to scan and easy to copy.
Coupang earns mostly in Korean won but reports in US dollars, so exchange-rate moves can hide underlying growth. In Q2 2026, revenue grew 4% as reported but 10% in constant currency, a $548M exchange-rate effect that the appendix reconciles by segment.
Yes. The two-segment layout (a profitable core next to loss-making growth bets), the quarterly-plus-TTM pairing and the active-customer slide map well to marketplace and retail businesses. Swap in your own figures and keep the headline-states-the-number style.
The net income slides annotate the loss bar with a callout that separates the $410M administrative fines from the underlying $(160)M loss, and the appendix lists the fines as a separate adjustment line with a definition footnote. It shows how to disclose a bad quarter openly.

Create Your Own Slides
Turn your ideas into professional presentations in seconds with 2slides AI.
Profesyonel tasarımları referans alın, stilinizi seçin ve mükemmel metin oluşturma ile slaytlar oluşturun. Nano Banana ile desteklenir—şimdi sunumunuzu oluşturmaya başlayın.
Slaytlar için AI Ajanınız. Akıllı sunum oluşturma ile zaman kazanın, daha hızlı parlayın.


© 2026 2slides. Tüm hakları saklıdır.