
Şu koleksiyonda: Yatırımcı sunumu örnekleri
C.H. Robinson Q3 2026 Earnings Presentation (October 28, 2026) — a 31-slide quarterly results deck from the North American freight brokerage and global logistics company, filed with the SEC as an exhibit to Form 8-K. It covers third-quarter 2026 results (total revenues of $5.4B, +29.5% Y/Y; adjusted gross profits of $808M, +14.5% Y/Y; income from operations of $272M; diluted EPS of $1.67 and adjusted EPS of $1.80), segment detail for North American Surface Transportation (NAST), Global Forwarding and All Other & Corporate, the Lean AI operating model and its fleet of AI agents, capital allocation, the 2026 operating income target bridge, and the proposed acquisition of RXO, Inc. that the deck says will form a $25B+ logistics platform. Unlike many EDGAR exhibits, the footnotes are legible at this resolution.
Bu sunumun kapağını, kendi içeriğinizden oluşturulan slaytlar için stil referansı olarak kullanır. Ya da aşağıdan herhangi bir sayfayı seçip düzenini referans olarak kullanın.
Hızlı Navigasyon
Etiketler
Slaytları paylaş
C.H. Robinson Q3 2026 Earnings Presentation (October 28, 2026) — a 31-slide quarterly results deck from the North American freight brokerage and global logistics company, filed with the SEC as an exhibit to Form 8-K. It covers third-quarter 2026 results (total revenues of $5.4B, +29.5% Y/Y; adjusted gross profits of $808M, +14.5% Y/Y; income from operations of $272M; diluted EPS of $1.67 and adjusted EPS of $1.80), segment detail for North American Surface Transportation (NAST), Global Forwarding and All Other & Corporate, the Lean AI operating model and its fleet of AI agents, capital allocation, the 2026 operating income target bridge, and the proposed acquisition of RXO, Inc. that the deck says will form a $25B+ logistics platform. Unlike many EDGAR exhibits, the footnotes are legible at this resolution.
Her slayt sayfasının detaylı görünümü, düzen, temel içerik ve görsel öğeler dahil.
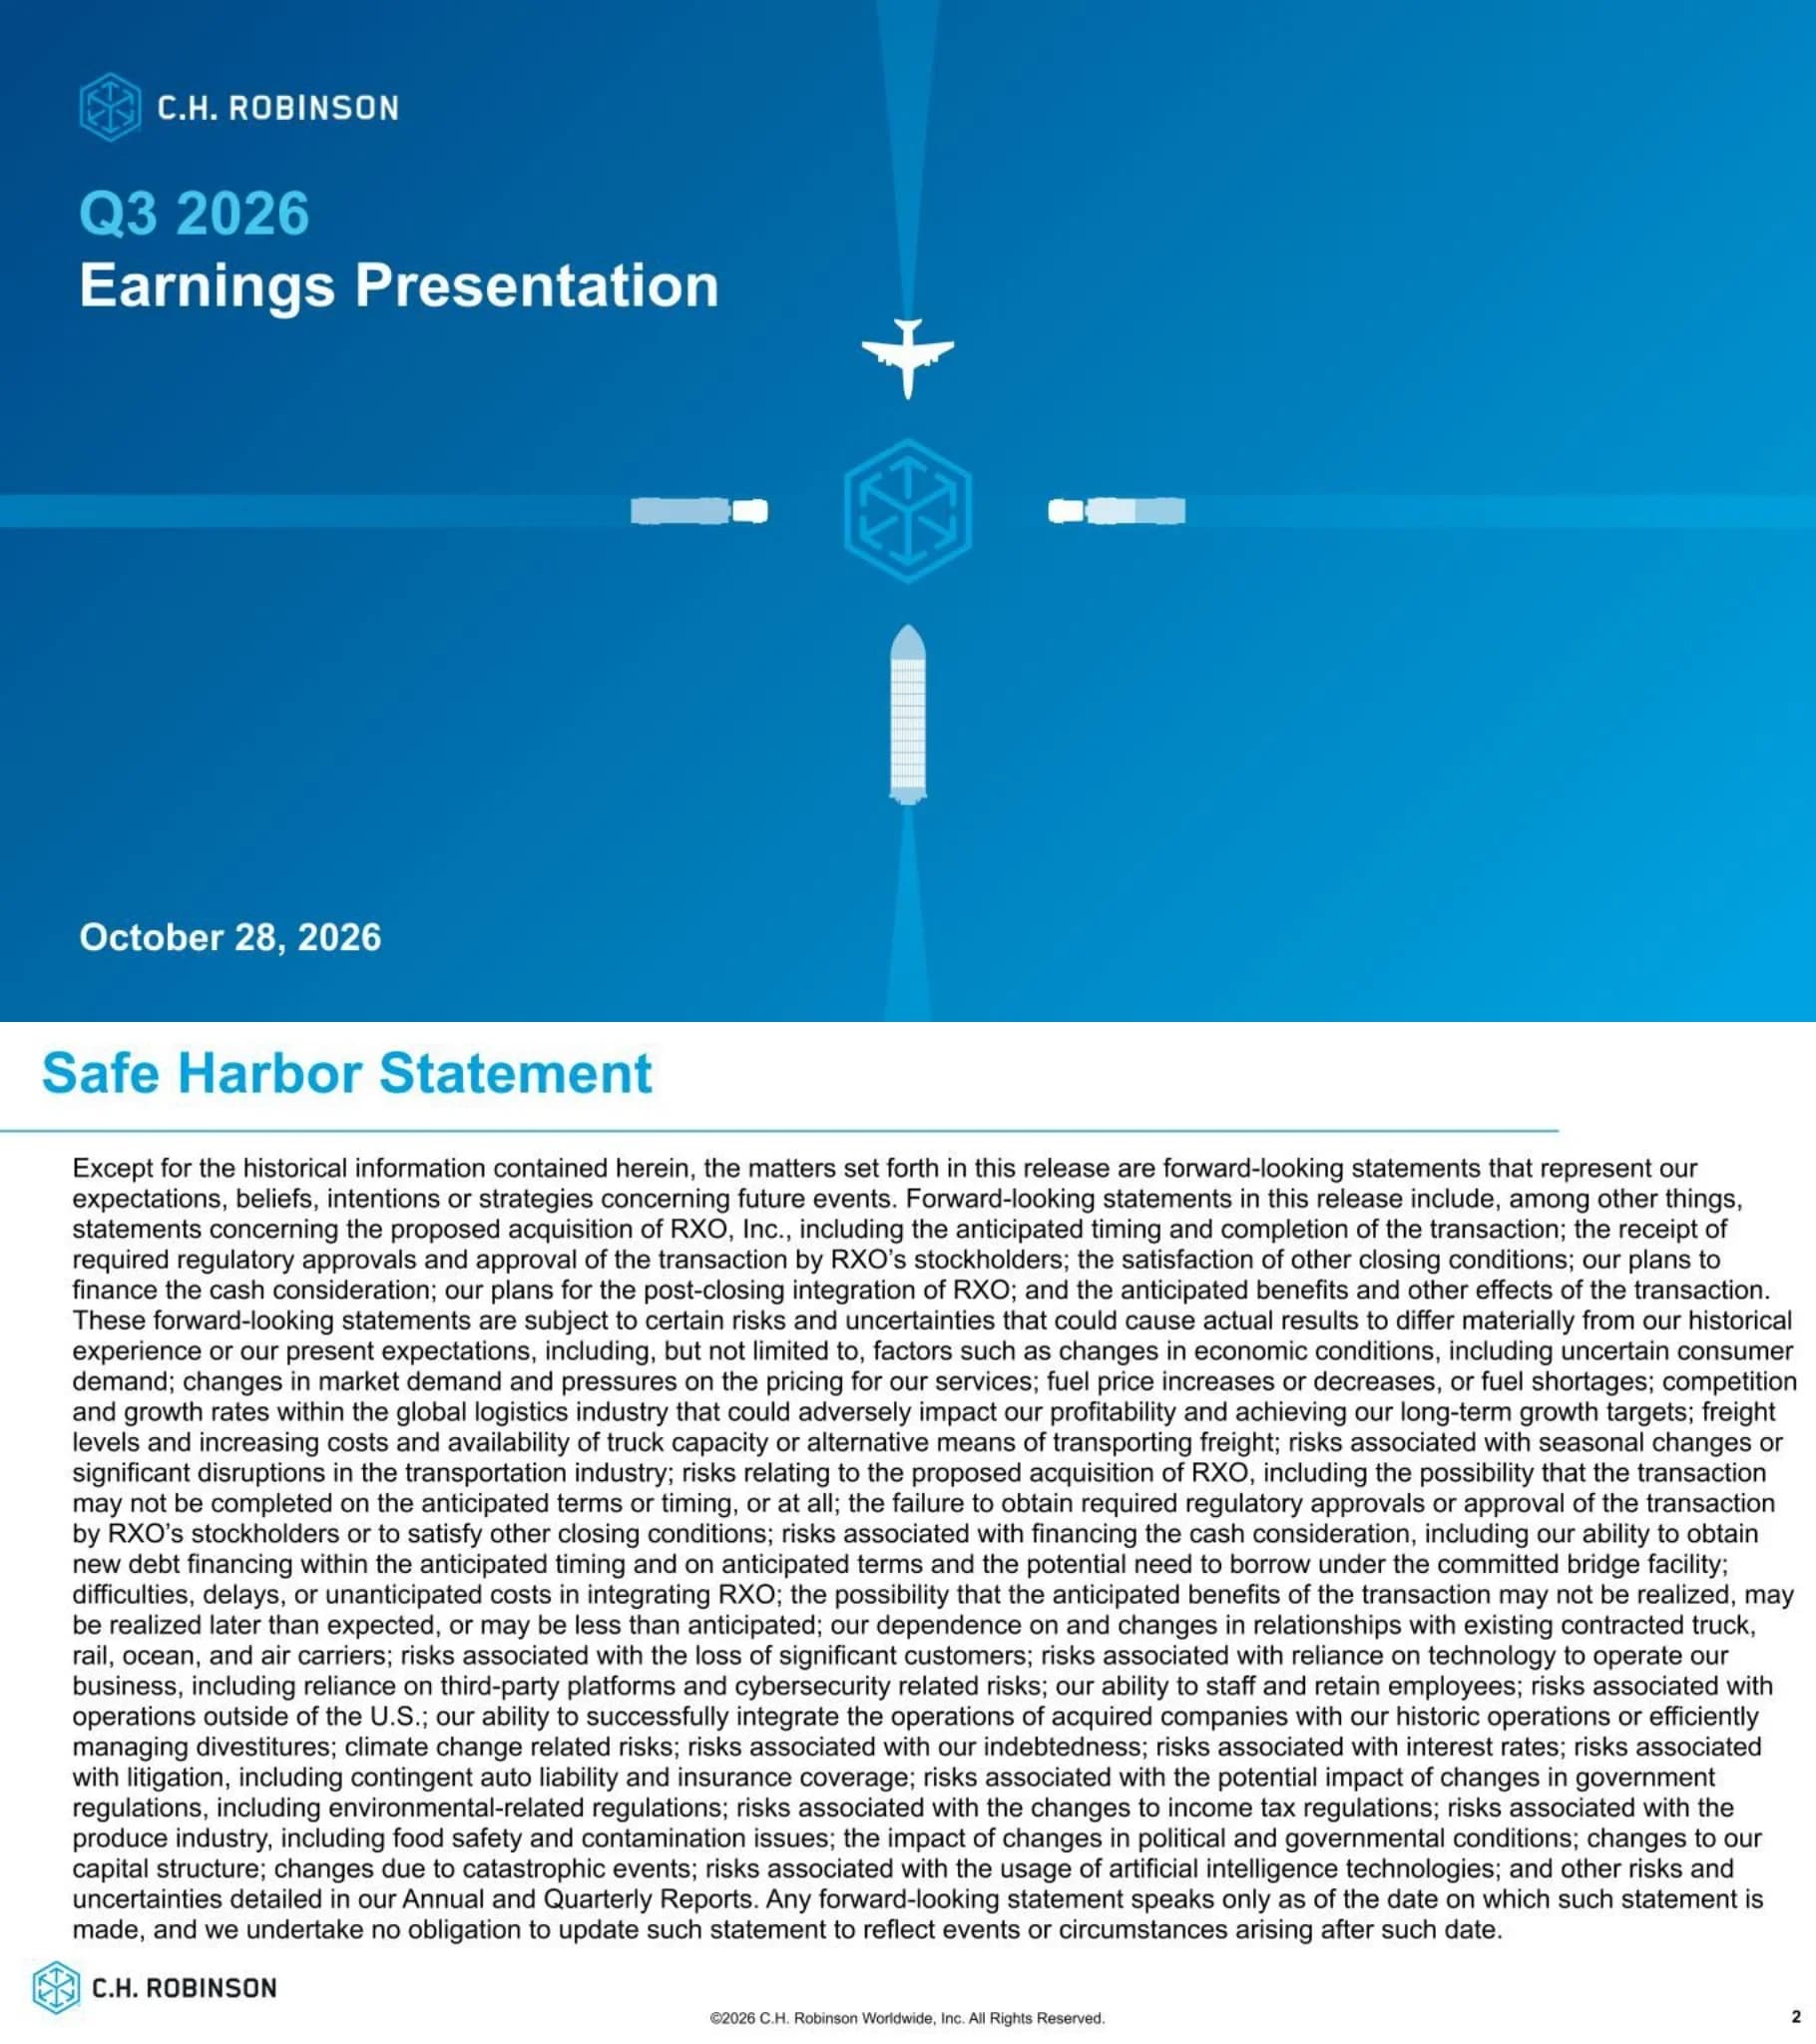
Cover slide with the C.H. Robinson logo, the title "Q3 2026 Earnings Presentation" and the date October 28, 2026.
Full-bleed blue gradient background; logo and title stacked top-left, date bottom-left; center graphic shows an airplane, two trucks and a container ship converging on the hexagonal C.H. Robinson mark.
Forward-looking statements disclaimer. It specifically covers statements concerning the proposed acquisition of RXO, Inc., including anticipated timing and completion, required regulatory approvals and approval by RXO's stockholders, financing the cash consideration (including a potential need to borrow under the committed bridge facility), post-closing integration and anticipated benefits, alongside general risks such as economic conditions, truck capacity, fuel prices, cybersecurity, AI technology usage and litigation.
Text-only slide: blue title with underline rule, a single dense paragraph filling the body, logo bottom-left and copyright line in the footer.
CEO commentary: NAST volume growth outpaced the Cass Freight Shipment Index for the 14th consecutive quarter; Lean AI delivered productivity improvements of greater than 15% Y/Y in Q3 and more than 65% since the end of 2022 in both NAST and Global Forwarding; operating leverage drove a 26% Y/Y increase in adjusted operating income, with NAST and GF achieving mid-cycle operating margin targets; and the same Lean operating model and AI technology are expected to enable the integration and transformation of RXO.
Two-column layout: four square-bullet statements on the left, a large portrait photo of the CEO on the right, footnote on adjusted operating income being non-GAAP.
KPI summary: total revenues $5.4B (+29.5% Y/Y), adjusted gross profits $808M (+14.5% Y/Y), income from operations $272M (+23.1% Y/Y), net income per share $1.67 (+24.6% Y/Y), $291M adjusted income from operations (+26.1% Y/Y) and $1.80 adjusted net income per share (+28.6% Y/Y). Narrative: NAST gained share in truckload and LTL, adjusted gross profit per shipment rose 17.0% Y/Y despite higher spot costs, and adjusted operating margin excluding specified items reached 40.3% in NAST and 36.6% in Global Forwarding.
Left column of three bullets; right side a large rounded dark-blue panel headed "Q3 [logo] 2026" split into a 2x2 KPI grid with dotted dividers; footnote defines the non-GAAP measures.
Q3 2026 adjusted gross profits split: NAST 64% (+16.6% Y/Y), Global Forwarding 27% (+15.4% Y/Y) and All Other & Corporate 9% (-1.2% Y/Y). Over half of total revenues come from customers using both surface transportation and global forwarding (One Robinson go-to-market, trailing twelve months). GF: ocean AGP per shipment +20.5% Y/Y and air AGP per metric ton +28.5% Y/Y. Other: Robinson Fresh AGP -5.1% Y/Y, Managed Solutions +4.1% Y/Y.
Central 3D pie chart flanked by three shaded callout panels (light blue for NAST at left, blue-grey for GF top-right, grey for All Other bottom-right), each with a circular Y/Y growth badge.
NAST truckload and LTL volume up 3.5% Y/Y versus a 0.3% decline in the Cass Freight Shipment Index; truckload AGP per shipment +17.0% and LTL AGP per order +4.0%; truckload AGP/load increased despite a 33.5% Y/Y increase in linehaul cost per mile. Adjusted gross profits ($M): truckload $322.8 vs $267.4 (+20.7%), LTL $169.5 vs $156.9 (+8.0%), other $25.5 vs $19.8 (+28.9%), total $517.9 vs $444.1 (+16.6%); adjusted gross profit margin 13.5% vs 15.0% (150 bps lower).
Left: "Third Quarter Highlights" navy banner with four bullets. Right: "Adjusted Gross Profits ($ in millions)" table with 3Q26, 3Q25 and % change columns and alternating row shading.
Line chart of North America truckload YoY price and cost change per mile (excluding fuel) by quarter from 2017 to 2026, peaking above 40% in 2021, troughing near -28% in 2023 and climbing back above 30% in 2026. Q3 table: truckload volume +3.5%, price/mile +31.5%, cost/mile +33.5%, adjusted gross profit +20.7%. Contractual/transactional mix was 70%/30% in Q3, unchanged from a year earlier; average routing guide depth in Managed Solutions was 1.5 vs 1.2 last year, reflecting tighter capacity.
Wide dual-line chart across the top; bottom band combines a shaded bullet box (left) with a small navy-headed Q3 truckload metrics table (right); four numbered footnotes.
Dual-axis chart from 2017 to 2026 plotting NAST adjusted gross profit dollars per truckload shipment (left axis, against a flat long-run average line) and NAST adjusted gross profit margin % (right axis, 11%–18%). The latest point shows AGP per shipment rising above the average. Commentary: disciplined pricing and procurement, higher-margin transactional volume and dynamic pricing and costing lifted AGP per mile and per shipment Y/Y; repricing campaigns were completed with a high level of success and faster than historically.
Full-width dual-axis line chart with legend on top, horizontal average line, and a shaded two-bullet commentary box below.
Global disruptions and supply-side constraints drove higher ocean and air rates. Ocean AGP rose on a 20.5% increase in AGP per shipment and 2.0% more shipments; air AGP rose on a 28.5% increase in AGP per metric ton, partly offset by a 4.0% decline in tons shipped; customs AGP fell on a 13.0% decrease in AGP per transaction. Adjusted gross profits ($M): ocean $135.9 vs $110.3 (+23.2%), air $43.1 vs $34.9 (+23.2%), customs $31.7 vs $36.4 (-12.9%), other $10.5 vs $10.2 (+2.9%), total $221.2 vs $191.8 (+15.4%); margin 19.3% vs 24.4% (510 bps lower).
Same template as the NAST slide: highlights banner and bullets on the left, striped 3Q26 vs 3Q25 adjusted gross profit table on the right.
Robinson Fresh AGP declined 5.1% Y/Y on margin compression from higher fuel costs, partly offset by higher volume with foodservice customers; Managed Solutions had total freight under management of $2.1B in Q3. Adjusted gross profits ($M): Robinson Fresh $38.1 vs $40.2 (-5.1%), Managed Solutions $31.2 vs $30.0 (+4.1%), total $69.3 vs $70.2 (-1.2%).
Highlights banner with two sub-headed bullet groups on the left; three-row adjusted gross profit table on the right; generous white space below.
Five-step Lean operating model: (1) clear long-term strategy and targets (enterprise strategy map, policy deployment matrix and initiatives); (2) defined and cascaded strategy maps (divisional and shared services); (3) scorecards with measurable, actionable inputs (binary green/red view, daily-to-quarterly operating reviews); (4) continuous, rigorous measurement and action plans ("embrace and attack the red", Gemba walks — "go to the desk"); (5) continuously improving, never stops. Grouped into Plan, Activate and Improve phases.
Five numbered chevron cards in progressively lighter blues running left to right, each with a line icon, heading and bullets, sitting on a three-segment Plan / Activate / Improve base bar.
Framework linking design solutions to outcomes: scalable digital processes (path to lowest-cost operator/execution) lead to decoupling volume and headcount growth; customer experience plus carrier experience lead to protecting and growing share; optimized AGP and volume at enterprise level (yield management) leads to profitable growth at scale. Enablers: cross-functionally aligned change, process re-engineering, talent and compensation alignment, and technology and science investment priorities.
Two-tier diagram: a light-blue "Outcomes" band on top, navy "Design Scalable Solutions" boxes below connected by thin arrows, and a curly bracket pointing to four enabler bullets on the right.
Nested-circle diagram ("from machine learning to multi-agent models with advanced reasoning"): Traditional AI (machine learning, predictive analytics and optimization; CHR examples costing, pricing and transportation optimization), Gen AI (large language models; CHR examples email classification, email quoting, email order entry and appointments) and Agentic AI (LLMs plus planning, tool use, memory and autonomous action; CHR examples NMFC Agent and Ocean Quoting).
Concentric blue circles in the center with leader lines to three labeled text blocks (What / How / CHR Examples) along the bottom.
A sample of agents "performing tasks that defied automation for decades": Quote Agents (fast transactional quotes), Order Agents (build and update orders in seconds), Appointment Agents (book and reschedule appointments), Truck Post Agents (post available truckload capacity early), Load Booking Agents (recommend loads to best-fit carriers), Tracking Agents (contact carriers for tracking updates), Documents Agents (acquire documents from carriers) and Carrier Payment Agents (ensure carriers are paid on time).
4x2 grid of rounded cards, each with a blue line icon, a sparkle accent in the corner and a first-person italic caption.
Four priorities: sustain and drive growth, minimize risk (maintain $600M–$750M of liquidity), optimize the balance sheet (investment grade ratings), and return capital (grow the dividend to keep Dividend Aristocrat status; $2B of share repurchase authorization remaining). Charts: cash from operations of $275M in Q3'25 vs $124M in Q3'26 (the decrease driven mainly by an unfavorable change in net operating working capital due to higher freight rates), shown beside operating working capital bars of $1,273M and $1,632M; capital distribution of $115M repurchases + $75M dividends in Q3'25 vs $214M + $75M in Q3'26. Notes: $289 million returned to shareholders in Q3 2026 (+52% Y/Y), 1.33 million shares repurchased at an average price of $160.64, more than 25 years of annually increasing dividends, and share repurchases now paused following the agreement to acquire RXO.
Left column of four colored-header priority cards (black, grey, navy, blue); right side a boxed pair of 3D stacked bar charts with two bullet boxes underneath.
Mid-cycle target of ~$400M–$500M incremental adjusted operating income vs 2023 (the earlier $350M–$450M range shown struck through), with 40% NAST operating margin, 30% GF operating margin and mid-30s enterprise operating margin. Key assumptions: outsized volume growth in NAST and GF, gross margin expansion from technology and revenue management, evergreen productivity and operating leverage; 40% and 30% remain the quality-of-earnings targets. Footnote: updated on October 29, 2025.
Blue gradient background reusing the cover's air, truck and ship graphics; big-number target in the center with a strikethrough prior range; three margin targets underneath; tall darker panel on the right for key assumptions.
Waterfall from $759M (FY24) through ~($99M) market headwinds and ~$174M strategic initiatives (FY25), then 2026 drivers — market outlook ~($40M)–$15M, market normalization ~($10M)–$15M, market share growth ~$50M, gross margin expansion ~$60M, cost reduction or avoidance ~$100M and inflationary cost growth ~($30M) — to a FY26 target of $964M–$1.04B (excluding restructuring and other charges). The bottom of the range is said to equal at least $6 of adjusted diluted EPS; $384M from 2025–2026 strategic initiatives vs $220M originally estimated. Assumes market volume growth of -3% to +1% in 2026.
Waterfall bar chart on a white background with a solid blue sidebar on the right listing market assumptions and key drivers.
Brand promise: "We deliver customer success through exceptional service and high value—like no one else," built on three pillars — Unmatched Expertise, Unrivaled Scale and Tailored Solutions — joined by plus signs.
Full-bleed blue background with three house-shaped (pentagon) columns in different blue shades, a centered headline above and a faint hexagon watermark.
Deal summary: consideration of $30.25 per RXO share (based on C.H. Robinson's 16-day VWAP of $151.88 as of October 2, 2026); transaction value $5.8B implied enterprise value; 13.2x implied EV / 2026E adjusted EBITDA (synergized, using RXO consensus estimates as of September 2026); expected close in the first half of 2027; ~$300M estimated net run-rate cost synergies; adjusted EPS accretive within 9 months of close and mid-teens accretion in 2028; net leverage target of 1.75x–2.25x by year-end 2028. Left panel: "One Stronger Logistics Platform" — Lean operating model plus human expertise and AI integrated, around capabilities, density and expertise.
Three panels: a navy panel with a brain/circuit continuous-improvement graphic, a navy deal-terms column, and a light-grey column with three outlined cards for synergies, EPS impact and deleveraging; numbered notes below.
Four synergy levers: cost-to-serve efficiencies (Lean operating model and AI agents across workflows) and shared services savings (centralizing processes and removing duplication) together account for 80%; third-party services eliminations (moving external services onto C.H. Robinson's vendor relationships) and other integration benefits (real estate consolidation and insurance procurement efficiencies) account for 20%.
Four navy-headed cards in a row, brackets grouping them into 80% and 20% boxes, and a full-width light-blue banner stating the ~$300M total.
As of October 28, 2026: transaction announced October 5, 2026; in Q4 2026 the U.S. antitrust (HSR) filing and Canada and Mexico merger control filings are submitted and the Form S-4 / proxy statement-prospectus is to be filed with the SEC; in 1H 2027 the Form S-4 is declared effective, the proxy is mailed and the RXO stockholder meeting is held, followed by receipt of required regulatory approvals and anticipated closing.
Horizontal arrow timeline with alternating above/below milestone stems; a diamond marks the current point and the final milestone uses a gold accent.
Section divider introducing the appendix of detailed results and non-GAAP reconciliations.
Same blue gradient and converging air, truck and ship graphic as the cover, with "Appendix" at top-left.
Transportation results across all segments ($ in thousands): Q3 total revenues $5,012,177 vs $3,783,535 (+32.5%); adjusted gross profits $775,286 vs $670,852 (+15.6%); adjusted gross profit margin 15.5% vs 17.7% (220 bps lower). Nine months: revenues $13,180,661 vs $11,252,110 (+17.1%), AGP $2,100,048 vs $1,965,416 (+6.9%), margin 15.9% vs 17.5%. A second table lists transportation AGP margin by quarter for 2017–2026 (Q3 2026: 15.5%; full-year 2025: 17.5%).
Two stacked tables: a three-month / nine-month comparison table at top and a 10-year quarterly margin grid below with navy year headers.
NAST ($ in thousands), three months: total revenues $3,829,223 vs $2,965,694 (+29.1%); adjusted gross profits $517,855 vs $444,139 (+16.6%); AGP margin 13.5% vs 15.0%; income from operations $203,903 vs $172,878 (+17.9%); adjusted operating margin 39.4% vs 38.9% (+50 bps); average headcount 4,597 vs 5,187 (-11.4%). Nine months: revenues $10,369,815 (+18.5%), income from operations $538,878 (+12.1%). Footnote: Q3 2026 includes $4.8 million of restructuring and other charges, primarily workforce reductions and acquisition-related costs.
Single wide financial table with three-month and nine-month column groups; italic margin rows; two footnotes.
Global Forwarding ($ in thousands), three months: total revenues $1,149,051 vs $786,347 (+46.1%); adjusted gross profits $221,238 vs $191,755 (+15.4%); AGP margin 19.3% vs 24.4%; income from operations $80,047 vs $49,021 (+63.3%); adjusted operating margin 36.2% vs 25.6% (+1,060 bps); average headcount 3,573 vs 4,245 (-15.8%). Nine months: revenues $2,710,385 (+14.9%), income from operations $172,701 (+20.5%), adjusted operating margin 30.2% vs 25.4%.
Same wide financial table template as the NAST appendix slide, with footnotes on non-GAAP measures and restructuring charges.
All Other and Corporate ($ in thousands), three months: total revenues $379,786 vs $384,805 (-1.3%); adjusted gross profits $69,341 vs $70,183 (-1.2%); loss from operations $(12,143) vs $(1,063); average headcount 3,083 vs 3,127 (-1.4%). Footnote: Q3 2026 includes $13.2 million of restructuring charges, primarily $12.2 million of impairment charges related to the Kansas City regional center lease.
Wide financial table with three-month and nine-month groups; N/M shown for loss comparisons; two footnotes.
Defines adjusted gross profit as gross profit excluding amortization of internally developed software used directly to serve customers and carriers. Q3 2026 ($ in thousands): transportation revenues $5,012,177 plus sourcing $345,883 = total revenues $5,358,060; gross profit $795,574 (14.8% margin) plus $12,860 of software amortization = adjusted gross profit $808,434 (15.1%), vs $706,077 (17.1%) in Q3 2025. Nine months: adjusted gross profit $2,206,893 (15.4%) vs $2,072,396 (16.8%).
Definition paragraph at top and a full reconciliation table below with revenue, cost and gross profit sections and double-underlined totals.
Operating margin 5.1% in Q3 2026 vs 5.3% (income from operations $271,807 vs $220,836 thousand); adjusted operating margin (operating income / adjusted gross profit) 33.6% vs 31.3%; adjusted operating margin excluding specified items 36.0% vs 32.7% (adjusted income from operations $290,754 vs $230,590). Nine months: 34.0% vs 30.7%. Footnote itemizes Q3 2026 restructuring of $3.6 million for workforce reductions and $15.4 million of other charges, including $12.2 million of Kansas City lease impairment and $2.9 million of acquisition-related costs.
Definition paragraph followed by three stacked mini-tables, each ending in a bold margin row; long footnote at the bottom.
Segment reconciliation for 2026: Q3 adjusted income from operations of $208,738 (NAST), $80,964 (GF), $1,052 (All Other) and $290,754 consolidated, giving adjusted operating margin excluding specified items of 40.3%, 36.6%, 1.5% and 36.0%. Net income $198,469 thousand ($1.67 per diluted share) plus restructuring $16,092 ($0.14) and acquisition costs $2,855 ($0.02), less tax effect $(4,000) ($(0.03)), equals adjusted net income $213,416 ($1.80). Nine months: adjusted net income $568,533 ($4.75) vs reported $532,488 ($4.45).
Explanatory paragraph and a wide table with four segment columns for each of the three-month and nine-month periods, plus an EPS bridge section in $000s and per share.
Prior-year comparison: Q3 2025 adjusted income from operations of $174,152 (NAST), $57,551 (GF), $(1,113) (All Other) and $230,590 consolidated; adjusted operating margin excluding specified items 39.2% NAST, 30.0% GF and 32.7% consolidated. Net income $162,987 thousand ($1.34 per diluted share) adjusted to $170,292 ($1.40). Nine months 2025: adjusted net income $468,957 ($3.86) vs reported $450,760 ($3.71).
Mirror of the previous slide for 2025 periods: paragraph plus wide segment reconciliation table and EPS bridge.
Closing slide with "Thank you" and the investor relations contact (Chuck Ives) in the bottom-right corner.
Same blue gradient cover design with converging transport icons; closing text top-left and IR contact block bottom-right.
Bu slayt ve temel sunum içeriği hakkında yaygın sorular.
It is the 31-slide deck C.H. Robinson released on October 28, 2026 with its third-quarter 2026 results. It covers the quarter's highlights, results for NAST, Global Forwarding and All Other & Corporate, truckload pricing and margin trends, the Lean AI operating model and AI agents, capital allocation, the 2026 operating income target bridge, the proposed acquisition of RXO, Inc., and non-GAAP reconciliations.
It was filed with the SEC as an exhibit to C.H. Robinson's Form 8-K. The slides in the SEC filing are rasterized images. Even so, the footnotes in this copy are legible, and the numbers on this page are quoted exactly as they appear on the slides.
According to the Q3 Highlights slide, total revenues were $5.4B (+29.5% Y/Y), adjusted gross profits were $808M (+14.5% Y/Y), income from operations was $272M (+23.1% Y/Y), and net income per share was $1.67 (+24.6% Y/Y). Adjusted income from operations was $291M (+26.1% Y/Y) and adjusted net income per share was $1.80 (+28.6% Y/Y).
Slide 19 says C.H. Robinson is to acquire RXO to form a $25B+ logistics platform. It lists consideration of $30.25 per RXO share, a $5.8B implied enterprise value, 13.2x implied EV / 2026E adjusted EBITDA (synergized), ~$300M of estimated net run-rate cost synergies, adjusted EPS accretion within 9 months of close and mid-teens accretion in 2028, and a 1.75x–2.25x net leverage target by year-end 2028. Expected close is the first half of 2027, subject to regulatory approvals and RXO stockholder approval.
The deck describes three layers: traditional AI for costing, pricing and optimization; generative AI for email classification, quoting, order entry and appointments; and agentic AI such as an NMFC Agent and Ocean Quoting. A slide also shows eight agent types: quote, order, appointment, truck post, load booking, tracking, documents and carrier payment. The deck says productivity improved by more than 15% Y/Y in Q3 and by more than 65% since the end of 2022.
Yes. This page offers the original PDF and a PPTX version converted from it. Because the SEC exhibit is made of slide images, the PPTX is mainly useful for reuse and annotation, not for editing the original text boxes. The layouts work well as references for your own earnings deck: KPI panel, segment pie chart, results-by-service tables, waterfall bridge, deal summary and reconciliation tables.
The bridge slide shows a FY26 target of $964M–$1.04B in operating income, excluding restructuring and other charges. It builds up from $759M in FY24, and the deck says the bottom of the range is equivalent to at least $6 of adjusted diluted EPS. The financial target slide sets mid-cycle goals of 40% NAST operating margin, 30% GF operating margin and mid-30s enterprise operating margin.
It is useful for investors and analysts following C.H. Robinson, RXO and the freight brokerage sector, for logistics professionals tracking truckload and forwarding margins, for M&A teams studying how a deal is presented inside an earnings deck, and for IR teams looking for a clean quarterly-results layout.
Original exhibit filed by C.H. Robinson Worldwide, Inc. with its Form 8-K for the third quarter of 2026.

Create Your Own Slides
Turn your ideas into professional presentations in seconds with 2slides AI.
Profesyonel tasarımları referans alın, stilinizi seçin ve mükemmel metin oluşturma ile slaytlar oluşturun. Nano Banana ile desteklenir—şimdi sunumunuzu oluşturmaya başlayın.
Slaytlar için AI Ajanınız. Akıllı sunum oluşturma ile zaman kazanın, daha hızlı parlayın.


© 2026 2slides. Tüm hakları saklıdır.