
Şu koleksiyonda: Yatırımcı sunumu örnekleri
Celestica 2026 Investor & Analyst Day (October 27, 2026), a 65-page investor presentation from Celestica Inc., the Toronto-headquartered Canadian design-and-manufacturing company listed as NYSE/TSX: CLS. The deck was filed with the SEC as an exhibit (99.1) to Form 6-K. It lays out how Celestica is building leading platforms for advanced AI infrastructure, with 2026E revenue of US$21.0 billion and non-GAAP adjusted EPS of $11.55, and a 2027 outlook of $40.0 billion in revenue (+90%), $21.50 adjusted EPS and a 9.0% non-GAAP operating margin.
Bu sunumun kapağını, kendi içeriğinizden oluşturulan slaytlar için stil referansı olarak kullanır. Ya da aşağıdan herhangi bir sayfayı seçip düzenini referans olarak kullanın.
Hızlı Navigasyon
Etiketler
Slaytları paylaş
Celestica 2026 Investor & Analyst Day (October 27, 2026), a 65-page investor presentation from Celestica Inc., the Toronto-headquartered Canadian design-and-manufacturing company listed as NYSE/TSX: CLS. The deck was filed with the SEC as an exhibit (99.1) to Form 6-K. It lays out how Celestica is building leading platforms for advanced AI infrastructure, with 2026E revenue of US$21.0 billion and non-GAAP adjusted EPS of $11.55, and a 2027 outlook of $40.0 billion in revenue (+90%), $21.50 adjusted EPS and a 9.0% non-GAAP operating margin.
Her slayt sayfasının detaylı görünümü, düzen, temel içerik ve görsel öğeler dahil.
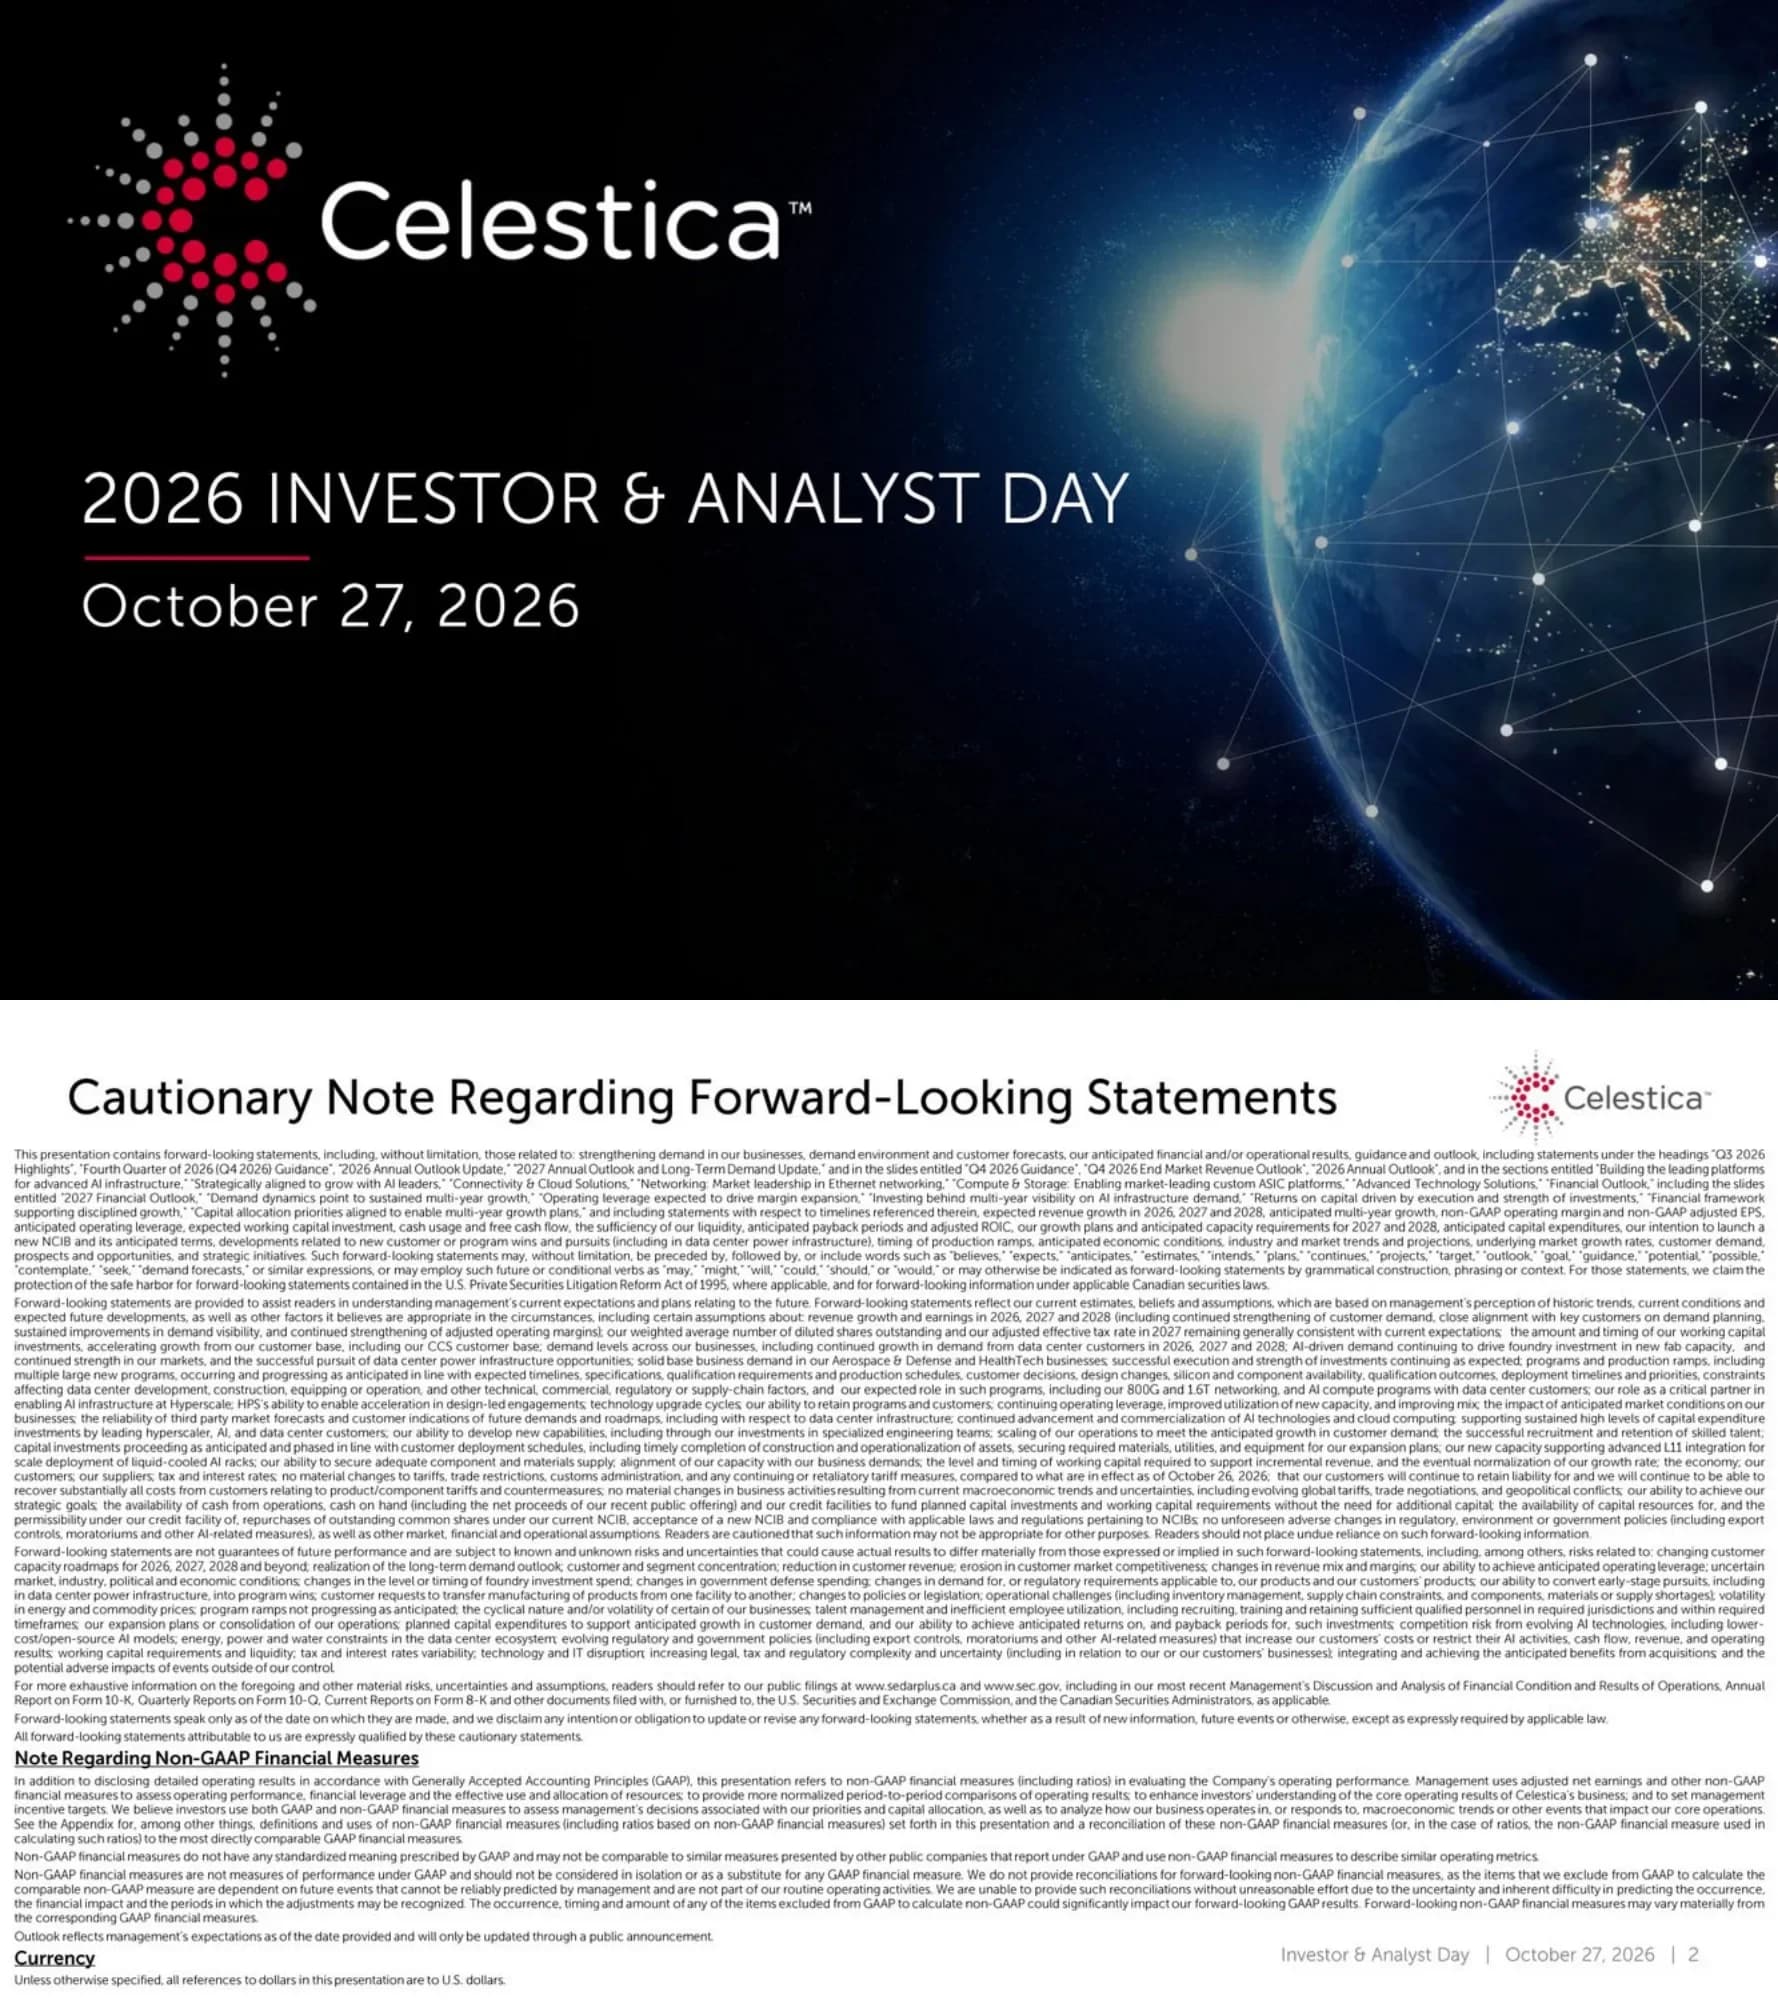
Cover slide for Celestica's 2026 Investor & Analyst Day, dated October 27, 2026, with the Celestica logo.
Full-bleed dark cover with logo at top left and event title and date left-aligned over a glowing Earth graphic.
Contains the cautionary note on forward-looking statements, the note on non-GAAP financial measures and the currency note stating that all dollar references are to U.S. dollars. It refers readers to SEDAR+ and SEC filings.
Single white page of dense small-print legal text split into three headed blocks.
Opens the first section, led by Rob Mionis, Chair of the Board and CEO, under the theme of building leading platforms for advanced AI infrastructure.
Black divider with title text on the left, speaker headshot in a circle with red underline, and a night city skyline with a glowing network mesh on the right.
Four pillars are presented: Differentiation (critical launch partner on next-generation platforms), Growth (industry-leading positions in AI data center technology), Visibility (multi-generational engagements and demand visibility) and Discipline (disciplined investment and sustained earnings growth).
Four equal cards in a row, each with an icon, a heading and a short description.
Revenue grows from $8.0B in 2023 to $9.6B in 2024, $12.4B in 2025 and $21.0B in 2026E, a 38% CAGR. GAAP EPS was $2.03, $3.61 and $7.16 for 2023 to 2025, while non-GAAP adjusted EPS was $2.46, $3.88, $6.05 and $11.55 in 2026E, a 67% CAGR.
Two side-by-side column charts with navy-to-teal columns, circular CAGR badges and a teal takeaway line at the bottom.
A funnel shows Design & Technology Leadership plus Operational Execution, enabled by core competencies in Design, Commercialization and Scale. These drive customer success in speed-to-market, quality, cost optimization and reliability.
Left-to-right funnel graphic converging on four outcome pills.
R&D and a system-level design approach span networking and AI compute and storage, with collaborative R&D and JDM with customers and silicon partners. Customization-for-optimization enables lower TCO, superior price-to-performance through tailored AI systems, and supply chain and vendor diversification.
Tabbed slide marked DESIGN, with a capability block on the left leading to a benefits column on the right.
A three-loop arrow diagram runs from design-for-manufacturability (DFM) through addressing key manufacturing process challenges to the NPI-to-mass-production hand-off. Benefits listed are seamless hand-off, vertically integrated design and manufacturing, and a trusted JDM launch partner.
Tabbed slide marked COMMERCIALIZE with a three-loop cycle diagram on the left and benefit bullets on the right.
Three chevrons describe Advanced Manufacturing (scale and geographic diversification), Stewardship Culture (end-to-end ownership through final test and delivery) and the Excellence Framework (the Celestica Operating System drives quality and reliability).
Tabbed slide marked SCALE with three horizontal chevrons, each with a caption.
Celestica operates 40+ sites across 16 countries. Expansion projects include multiple Texas sites, Monterrey (Mexico) campus upgrades, a larger flagship Thailand campus, new programs in Japan and Malaysia, and a bigger R&D site network in the US and Asia.
World map with location pins and a project list, with a footer bar reading Capacity | Capabilities | Power.
Targeted investments in automated manufacturing lines support networking and compute trays and rack-scale assembly, shown with photos of robotic arms and automated production lines.
Four-photo grid of factory automation with a short caption and teal takeaway.
Celestica's differentiated model sits between EMS and OEM and has five elements: system-level design, modular HPS IP building blocks, customized lifecycle solutions, a full SONiC software stack with customization, and open vendor ecosystems. The takeaway is that Celestica is the preferred AI infrastructure launch partner.
Spectrum graphic from EMS to OEM with a highlighted middle zone and five numbered elements.
Opens the section presented by Mandeep Chawla, Group President, Global Markets.
Black divider with headshot in a circle with red underline and skyline artwork.
A four-step arrow flows from the AI Investment Supercycle to Capacity & Supply Chain, then Design-Led Programs (JDM embeds Celestica at proof-of-concept) and finally Extended Visibility & Alignment.
Four chevron steps in a row with short descriptors under each.
Global data center capex per Dell'Oro rises from $1.2T in 2026 to $3.1T in 2030, adding $1.9T of TAM. The top four US hyperscalers and frontier AI labs are expected to account for two-thirds of the TAM by 2030, supported by growing AI usage, constrained compute capacity and long-term planning cycles.
Column chart on the left with a TAM growth callout, and three supporting bullets on the right.
A table for hyperscalers and frontier AI labs rates upgrade cycles as Short, performance and technology as Leading-Edge, and customization, scale and engineering collaboration as High, with a dynamics column explaining each.
Three-column table: attribute, rating pill and dynamics description.
A pyramid moves from Networking to Compute, Rack and System, with Software along the side. The HPS networking foundation supports the evolution into AI compute, racks and full systems.
Stepped pyramid graphic with a vertical software bar and explanatory text on the right.
Hyperscaler revenue grows from $2.9B in 2023 (62% of CCS) to $4.8B (74%) in 2024, $7.1B (77%) in 2025 and $14.4B (83%) in 2026E. That is 5x growth and a 71% CAGR. Key success factors are speed-to-market, scale and customization-for-optimization.
Column chart with percent-of-CCS labels and a 5x and CAGR badge, plus three success-factor pills.
Three panels are labelled Hyperscalers, Frontier AI Labs and Silicon Partners. The logo areas are blank in the filed version. The takeaway positions Celestica as a trusted partner for the world's largest AI deployments.
Three side-by-side panels with category headers, intended to hold customer logos.
Opens the CCS section, presented by Steven Dorwart, President, CCS.
Black divider with headshot in a circle with red underline and skyline artwork.
CCS 2026E revenue is $17.4B (+89% YTY) with a segment margin of 8.8% (+60bps). Revenue runs $4.6B, $6.5B, $9.2B and $17.4B for 2023 to 2026E (about 4x, 55% CAGR). The 2026E split is Networking $11.8B and Compute & Storage $5.6B, and the HPS portfolio is $8.5B.
Headline KPI tiles on the left, a column chart in the middle and a donut chart on the right.
HPS revenue grows from $1.7B to $2.8B, $5.0B and $8.5B (2023 to 2026E), about 5x and a 70% CAGR. R&D spend rises from $61M to $200M+ (more than 3x). Targets for 2027E are 2,000+ HPS engineers and $300M+ of R&D investment, with 9 global design centers.
Column chart with CAGR badge, an R&D comparison, target callouts and a bottom band of Networking, Software, Compute and Rack-scale.
A four-step cycle covers Explore (proofs of concept), Evaluate (disciplined filtering), Industrialize and Market-Ready, with HPS solutions ready ahead of JDM engagements.
Four numbered steps arranged around a puzzle-piece graphic.
Three trends are shown: proliferation of specialized silicon, greater customization of compute and networking architectures, and faster upgrade cycles.
Three numbered cubes along a pipe graphic, each with a caption.
Five challenge areas are listed: Full System (rack-scale and multi-rack), Optics (CPO, NPO, XPO, optical backplanes), Signal Integrity (400G-class SerDes toward 3.2T, next-gen PCB), Power (800V distribution, racks to 500kW+) and Thermal (rack-level and two-phase liquid cooling).
Rack photo on one side and five labelled challenge rows on the other.
Opens the Networking section under the theme of market leadership in Ethernet networking.
Black divider with title text and skyline artwork on the right.
2026E Networking revenue is $11.8B (+66% YTY). Stacked bars show 2025 at $6.1B networking plus $1.0B optical and other, and 2026E at $10.6B plus $1.2B. Into 2027, 1.6T ramps accelerate, 800G stays very strong and 400G is stable, with Scale-Up Ethernet driving 1.6T and support for hyperscalers on Scale-Up for AMD Helios.
Headline KPI, a stacked column chart and a momentum bullet list.
Three product cards: DS6001 1.6T scale-out switch (hybrid cooling, 2OU in 21-inch OCP ORv3, SONiC), DS6010 1.6T scale-up switch (native AMD Helios, dual Broadcom Tomahawk 6, 204.8 Tbps) and DS6005 1.6T CPO switch (up to 102.4 Tbps, Tomahawk 6 Davisson, 1.5OU, fully liquid-cooled).
Three product cards side by side with a switch image and spec bullets each.
A timeline maps Scale-Up (1.6T, XPU-to-XPU), Scale-Out (800G and 1.6T, rack-to-rack) and Scale-Across (800G and 1.6T, cluster-to-cluster) as the back-end network, alongside front-end at 400G and 800G. Most deployments are back-end AI networks.
Horizontal network diagram grouping back-end and front-end tiers with speed labels.
A To date versus Today & Looking Ahead table shows bandwidth moving from 400G and 800G to 1.6T and 3.2T, Ethernet in AI networks growing from Scale-Out and Scale-Across to include Scale-Up, and optics moving from copper and pluggables to add XPO, NPO and CPO.
Two-column comparison table with three attribute rows.
Data center Ethernet networking TAM per Dell'Oro grows from $44B in 2026 to $173B in 2030, with more than 7x growth in the 800G+ TAM. The stacked area is split by speed: below 400G, 400G, 800G, 1.6T and 3.2T.
Full-width stacked area chart with speed-tier legend and takeaway line.
TAM is $44B in 2026 (front-end $23B, scale-out $20B, scale-up $1B) and $173B in 2030 (front-end $34B, scale-out $84B, scale-up $55B). Scale-Up is expected to reach 40% of back-end and 32% of total data center Ethernet switch demand by 2030.
Two stacked columns for 2026 and 2030 with callouts for the scale-up share.
In the AMD and Open Compute Project Helios design, the Celestica DS6010 scales up 72 AMD Instinct MI455X GPUs per rack using dual Tomahawk 6 and UALink over Ethernet.
Rack illustration with highlighted switch trays and a spec list.
Optics progress from Traditional Pluggables to High-Density Pluggables (XPO) to Integrated Optics (CPO and NPO). Celestica's view is that broader CPO adoption comes at 3.2T, pluggables and integrated optics will co-exist, and CPO manufacturing is complex.
Three-stage progression graphic with a views panel beneath.
A hyperscaler awarded Celestica a JDM program for a 1.6T Ethernet CPO switch, the DS6005, co-designed on HPS IP and integrated at rack scale. Production is expected to begin in late 2027.
Product image on one side with award details and timeline bullets on the other.
A line chart tracks Ethernet switch revenue at the top four hyperscalers and frontier AI labs from Q1'24 to Q2'26, with Celestica highest versus US OEM A, a Taiwan ODM, a US merchant semi and US OEM B. 650 Group TTM Q2'26 shares are 31% of 800G+ revenue, 44% of 800G+ ports and 58% of custom Ethernet switch revenue.
Multi-line chart on the left with three share KPI tiles on the right.
Opens the Compute & Storage section under the theme of enabling market-leading custom ASIC platforms.
Black divider with title text and skyline artwork on the right.
2026E Compute & Storage revenue is $5.6B (+170% YTY). Stacked bars show 2025 at $1.5B server plus $0.6B storage and 2026E at $4.0B plus $1.6B. Next-gen hyperscaler AI compute reaches mass production in 2027, an HPS rack-scale program for the OpenAI Jalapeño accelerator ramps in 2027, and storage shows solid growth.
Headline KPI, stacked column chart and a bullet list of momentum drivers.
Custom ASIC TAM per 650 Group grows from $61B in 2026 to $434B in 2030, more than 7x. The custom ASIC CAGR is 64% versus 28% for merchant GPU.
Column chart with growth badge and a CAGR comparison panel.
With OpenAI and Broadcom, Celestica supplies a rack-scale platform with 128 OpenAI Jalapeño ASICs and Broadcom Tomahawk 6, designed as an HPS rack-scale solution with customized SONiC. Production ramp is planned for 2027 under multi-generational, multi-gigawatt plans.
Partner logo trio across the top with rack platform graphic and detail bullets.
Opens the ATS section, presented by Todd Cooper, President, ATS.
Black divider with headshot in a circle with red underline and skyline artwork.
ATS 2026E revenue is $3.6B (+13%) with a 6.4% segment margin (+110bps). The 2026E donut splits Industrial $1.4B, Capital Equipment $1.0B, A&D $0.9B and HealthTech $0.3B. Segment margin runs 4.7%, 4.6%, 5.3% and 6.4% from 2023 to 2026E, up 170bps.
KPI tiles, a donut chart and a margin trend column chart.
ATS revenue is expected to grow about 10% in 2027E. Drivers are Capital Equipment (AI-driven fab capacity, WFE share gains), Industrial (return to growth, data center power infrastructure), A&D (commercial aerospace, US and EU defense) and HealthTech (program ramps and pipeline).
Growth headline with four end-market quadrants, each with bullet drivers.
The ATS strategy rests on Growth & Profitability, Engineering-Led execution and Strategic Customer Focus.
Three-pillar layout with headings and short descriptions.
Opens the financial section, presented by Todd Ankenmann, CFO.
Black divider with headshot in a circle with red underline and skyline artwork.
Comparing 2026E with 2027E: revenue $21.0B to $40.0B (+90%), non-GAAP operating margin 8.4% to 9.0% (+60bps), non-GAAP adjusted EPS $11.55 to $21.50 (+86%) and capex about $1B to $1.5B-$2.0B (+75%). Assumptions are CCS growth of about 110%, ATS about 10% and an adjusted ETR of about 21%. EPS reflects the August 2026 public offering, with about 120M and 127M diluted shares for 2026 and 2027.
Four-row outlook table with 2026E, 2027E and YTY columns, plus an assumptions panel.
Customer demand for 2028 is meaningfully higher than the 2027 revenue outlook, and anchor customers are aligned on multi-year capacity plans. Growth drivers cited are Networking (1.6T), AI compute (custom ASIC) and new opportunities.
Headline statement with three driver blocks beneath.
In 2023, GAAP operating margin was 4.2% and non-GAAP was 5.5%. The non-GAAP margin is 8.4% for 2026E and 9.0% for 2027E.
Column chart of operating margin by year with GAAP and non-GAAP series.
Revenue growth of 10%, 21%, 28%, 69% and 90% (2023 to 2027E) is set against capex as a share of revenue of 1.6%, 1.8%, 1.6%, 4.8% and 4.4%. Non-GAAP FCF is expected to be a net use of funds in 2027, and total liquidity is $5.7B including $4.0B of cash as of September 30, 2026.
Paired charts of growth and capex intensity with a liquidity callout.
ROIC (GAAP / non-GAAP adjusted) was 16% / 21% in 2023, 26% / 27% in 2024, 42% / 37% in 2025 and 56% / 57% in 2026 YTD.
Clustered column chart with two series per year.
The framework targets long-term non-GAAP adjusted EPS growth, filtered through disciplined revenue growth, profitability and returns on capital.
Funnel or filter graphic with three criteria feeding an EPS growth goal.
Priorities are a strong and flexible balance sheet with investment-grade discipline, organic investments, opportunistic M&A and return of capital through opportunistic buybacks.
Stacked-cube graphic on the left with four priorities listed on the right.
Opens the closing remarks, delivered by Rob Mionis.
Black divider with headshot in a circle with red underline and skyline artwork.
Repeats the four pillars from page 4: Differentiation, Growth, Visibility and Discipline, as the closing summary of the investment case.
Four equal cards in a row with icons, mirroring the opening pillar slide.
Six management members join the Q&A: Rob Mionis (Chair & CEO), Mandeep Chawla (Group President, Global Markets), Todd Ankenmann (CFO), Steven Dorwart (President, CCS), Todd Cooper (President, ATS) and Gavin Cato (SVP, CCS Engineering).
Six headshot cards in a grid with names and titles.
Divider slide introducing the question-and-answer session.
Black divider with a large Q&A title and skyline artwork.
Closing cover that repeats the opening: Celestica logo and 2026 Investor & Analyst Day, October 27, 2026.
Full-bleed dark cover with logo, title and date over a glowing Earth graphic.
Divider marking the start of the appendix with non-GAAP definitions and financial reconciliations.
Black divider with the word Appendix and the starburst logo.
FY2025/2024/2023 revenue in US$ millions: ATS 3,202.4 / 3,155.5 / 3,319.8, Networking 7,126.4 / 3,946.7 / 2,675.6, Compute & Storage 2,062.1 / 2,543.8 / 1,965.6, CCS 9,188.5 / 6,490.5 / 4,641.2, total 12,390.9 / 9,646.0 / 7,961.0. Segment margin is ATS 5.3% / 4.6% / 4.7% and CCS 8.2% / 7.4% / 6.2%, with total segment income 927.0 / 622.6 / 441.6 and EBT 983.2 / 532.2 / 306.0.
Dense financial tables for revenue, segment income, segment costs and reconciling items.
Defines adjusted EBIAT, operating margin, adjusted net earnings, adjusted EPS, ROIC, free cash flow and adjusted tax. It covers adjustments for share-based compensation, TRS fair value adjustments, FCC/IRS transitional adjustments and amortization of intangibles.
Full page of small-print definitions in text blocks.
Continues the definitions with restructuring and other charges, transition costs and miscellaneous expense, and defines adjusted EBIAT, adjusted net earnings, free cash flow and adjusted ROIC.
Full page of small-print definitions in text blocks.
Net earnings were $832.5M / $428.0M / $244.4M with diluted EPS of $7.16 / $3.61 / $2.03. GAAP earnings from operations were $1,040.7M / $599.3M / $338.3M (8.4% / 6.2% / 4.2%), adjusted EBIAT $927.0M / $622.6M / $441.6M (7.5% / 6.5% / 5.5%), adjusted net earnings $703.2M / $460.8M / $295.8M and adjusted EPS $6.05 / $3.88 / $2.46.
Multi-row reconciliation table with three fiscal-year columns.
Adjusted ROIC was 49.8% in Q1 2026, 55.5% in Q2, 64.7% in Q3 and 56.7% YTD, versus 37.1% in FY2025, 27.2% in FY2024 and 20.7% in FY2023. GAAP ROIC YTD was 55.9%. Net invested capital at the end of Q3 2026 was $3,220.4M and total assets were $15,138.5M.
Wide reconciliation table with quarterly, YTD and full-year columns.
GAAP effective tax rate was 15% / 20% / 20% for FY2025/24/23, while the adjusted effective tax rate was 20% / 19% / 20%.
Compact reconciliation table with three fiscal-year columns.
Final slide, identical to the cover: Celestica logo and 2026 Investor & Analyst Day, October 27, 2026.
Full-bleed dark cover with logo, title and date over a glowing Earth graphic.
Bu slayt ve temel sunum içeriği hakkında yaygın sorular.
It is a 65-page investor and analyst day deck dated October 27, 2026. It covers Celestica's four strategic pillars, hyperscaler growth, the CCS segment (Networking, Compute & Storage and the HPS portfolio), the ATS segment, a 2027 financial outlook, capital allocation, management Q&A and an appendix of non-GAAP reconciliations.
The outlook is revenue of $40.0B (+90% from $21.0B in 2026E), a 9.0% non-GAAP operating margin (+60bps), non-GAAP adjusted EPS of $21.50 (+86% from $11.55) and capex of $1.5B to $2.0B. It assumes about 110% CCS growth, about 10% ATS growth and an adjusted effective tax rate of about 21%.
2026E CCS revenue is $17.4B (+89%) at an 8.8% segment margin. Within it, Networking is $11.8B, Compute & Storage is $5.6B and the HPS portfolio is $8.5B. Hyperscaler revenue is $14.4B in 2026E, or 83% of CCS. In Ethernet switching, a 650 Group source cites 31% share of 800G+ revenue, 44% of 800G+ ports and 58% of custom switch revenue.
Celestica is the technology partner for OpenAI's Jalapeño architecture, building a rack-scale platform with 128 Jalapeño ASICs and Broadcom Tomahawk 6, with production ramp planned for 2027. Its DS6010 scale-up switch is native to AMD Helios racks, scaling up 72 AMD Instinct MI455X GPUs per rack using UALink over Ethernet.
The deck was filed with the SEC as an exhibit (99.1) to Form 6-K. Celestica is a Canadian company headquartered in Toronto and listed on the NYSE and TSX under the ticker CLS. All dollar amounts are U.S. dollars unless otherwise noted.
The slides were rasterised to images in the SEC filing, so text cannot be selected and the small print on the legal page and appendix tables (pages 2 and 59 to 64) is dense. The customer and partner logo panels on page 19 are blank in the filed version.
All figures are in U.S. dollars, as page 2 states, even though Celestica is Canadian. Numbers such as $21.0B revenue and $11.55 adjusted EPS are therefore U.S. dollar amounts.
Follow its structure: a legal disclaimer, a CEO strategy section, segment deep dives led by each division head, a CFO outlook and capital allocation section, closing remarks, Q&A and an appendix. Reuse the repeating patterns such as KPI tiles, CAGR badges, a one-line takeaway under every chart and black section dividers with a speaker headshot.

Create Your Own Slides
Turn your ideas into professional presentations in seconds with 2slides AI.
Profesyonel tasarımları referans alın, stilinizi seçin ve mükemmel metin oluşturma ile slaytlar oluşturun. Nano Banana ile desteklenir—şimdi sunumunuzu oluşturmaya başlayın.
Slaytlar için AI Ajanınız. Akıllı sunum oluşturma ile zaman kazanın, daha hızlı parlayın.


© 2026 2slides. Tüm hakları saklıdır.