
Şu koleksiyonda: Yatırımcı sunumu örnekleri
Avenue Supermarts (DMart) H1 FY 2027 Corporate Presentation — the 12-page investor deck from India's value-retail supermarket chain covering the six months to 30 September 2026, filed with the Indian stock exchanges (BSE/NSE) on 10 October 2026. It walks through DMart's category mix, cluster-based store expansion to 518 stores across 17 states and union territories, the DMart Ready online-grocery footprint, quarterly operating KPIs and a six-period financial summary in ₹ crore.
Bu sunumun kapağını, kendi içeriğinizden oluşturulan slaytlar için stil referansı olarak kullanır. Ya da aşağıdan herhangi bir sayfayı seçip düzenini referans olarak kullanın.
Hızlı Navigasyon
Etiketler
Slaytları paylaş
Avenue Supermarts (DMart) H1 FY 2027 Corporate Presentation — the 12-page investor deck from India's value-retail supermarket chain covering the six months to 30 September 2026, filed with the Indian stock exchanges (BSE/NSE) on 10 October 2026. It walks through DMart's category mix, cluster-based store expansion to 518 stores across 17 states and union territories, the DMart Ready online-grocery footprint, quarterly operating KPIs and a six-period financial summary in ₹ crore.
Her slayt sayfasının detaylı görünümü, düzen, temel içerik ve görsel öğeler dahil.
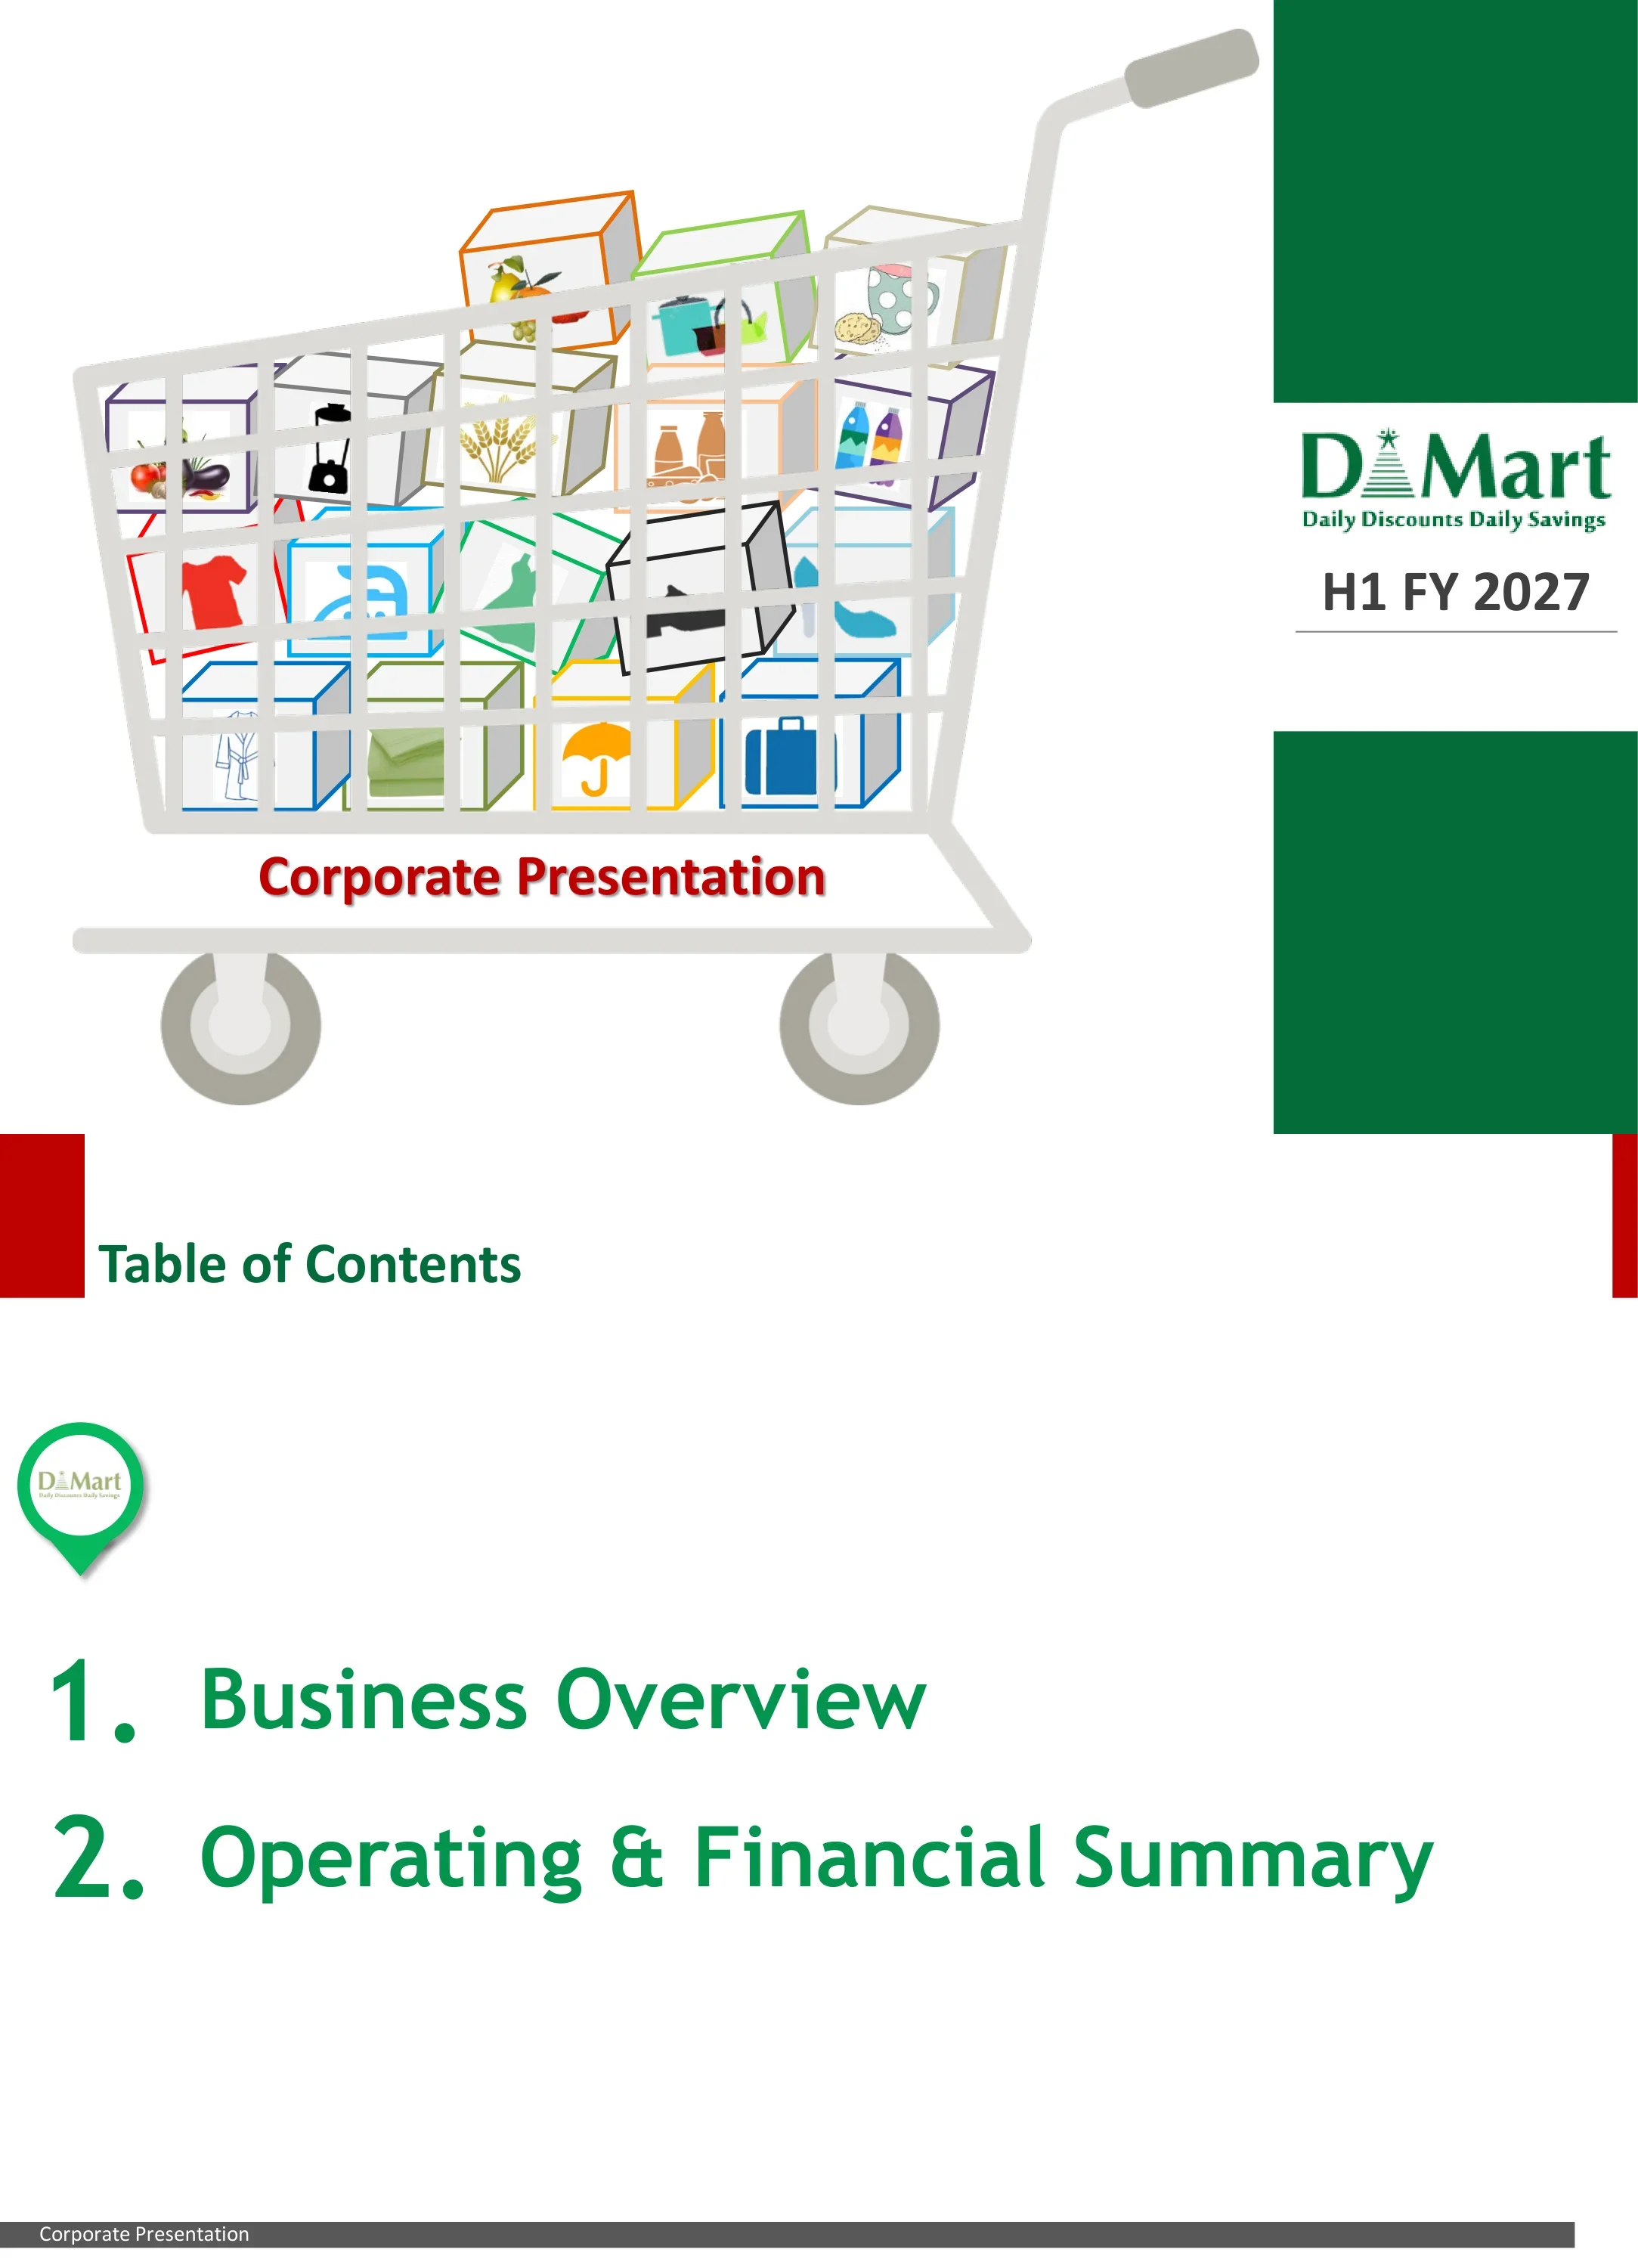
Cover slide: a large grey shopping-cart illustration filled with outlined product cubes (vegetables, grains, dairy, beverages, apparel, footwear, umbrella, luggage, towels) and the caption 'Corporate Presentation' in red, with the DMart logo and tagline 'Daily Discounts Daily Savings' and the period label 'H1 FY 2027' in a white band between two dark-green vertical panels on the right.
Asymmetric split: illustration occupies the left three-quarters; a right-hand vertical strip of dark green blocks frames the logo and period label in the middle.
Two-part agenda: 1. Business Overview and 2. Operating & Financial Summary, introduced by a green map-pin icon holding the DMart logo.
Red corner tab with green 'Table of Contents' heading at top-left; map-pin icon above two large numbered agenda lines in green; grey 'Corporate Presentation' footer bar.
Section divider introducing Business Overview, the first of the deck's two sections.
Mostly white slide with a horizontal band: red side blocks at left and right edges, a silver shopping-cart icon carrying the number 1, and the section title in large navy text with a soft shadow; DMart logo bottom-right.
Revenue mix across DMart's three category groups, H1 FY26 vs H1 FY27: Foods 57.01% → 56.90% (groceries, dairy, staples, snacks, frozen and processed foods, beverages and confectionery, fruits and vegetables, cooking oils); Non-Foods (FMCG) 19.65% → 19.48% (home care, personal care, toiletries, other over-the-counter products); General Merchandise & Apparel 23.34% → 23.62% (bed and bath, toys and games, crockery, plastic goods, garments, footwear, home appliances). General merchandise and apparel is the only group that gained share.
Three equal columns, each with a heading, a green 'Share of Revenue' bar, paired H1/26 and H1/27 pie charts with the share slice in red, and a grid of sage-green line icons naming the sub-categories inside a rounded bracket frame.
Four India maps track DMart's cluster-based store footprint: 55 stores in 2011-12 (Maharashtra 34, Gujarat 14, Andhra Pradesh & Telangana 4, Karnataka 3); 214 in 2019-20; 432 in H1 2025-26; and 518 in H1 2026-27. At H1 2026-27 the largest states are Maharashtra 132, Gujarat 77, Karnataka 53, Telangana 48, Andhra Pradesh 47, Tamil Nadu 36, Rajasthan 30, Madhya Pradesh 30, Punjab 26 and NCR 22, followed by Chhattisgarh 8, Uttar Pradesh 4 and one store each in Daman, Goa, Haryana, Uttarakhand and Odisha. Store counts per state appear in brackets.
Left column stacks two small maps (2011-12, 2019-20); a grey chevron leads to a medium H1 2025-26 map and then a large H1 2026-27 map on the right. States are shaded in four greens/greys by store density (no presence, under 20, 21-50, over 50), with red state labels on leader lines and a ribbon badge for each period's total.
DMart Ready, the online grocery ordering and fulfilment business, is now concentrated in large towns: it began in 1 city (Mumbai MMR) in 2016-17, reached 19 cities in H1 2025-26 (including Gurugram, Jaipur, Surat, Nashik, Kolhapur, Raipur, Vijayawada and Chennai) and has been consolidated to 11 cities in H1 2026-27 — Mumbai (MMR), Pune, Ahmedabad, Sanand, Vadodara, Indore, Bhopal, Nagpur, Hyderabad, Visakhapatnam and Bangalore.
Three outlined India maps left to right (small 2016-17, larger H1 2025-26 and H1 2026-27) with grey city dots, red city labels on leader lines and a ribbon badge with the city count under each map; period labels underlined beneath.
Store additions and closing store count by period: FY23 +40 (324 stores), FY24 +41 (365), FY25 +50 (415), H1 FY26 +17 (432), FY26 +85 (500) and H1 FY27 +18 (518). FY26 was the biggest expansion year in the series. A footnote says the 518 count includes the Sanpada store at Navi Mumbai, currently closed to customers for reconstruction.
Row of grey rounded boxes with total store counts above a six-bar green column chart labelled with additions; the H1/27 bar has a dark-green top segment for the new stores; italic footnote at the bottom.
Section divider introducing the Operating & Financial Summary.
Same divider template as page 3: red edge blocks, silver shopping-cart icon with the number 2 and a large navy shadowed title on white.
Five-quarter operating KPIs from Q2 FY26 to Q2 FY27: total bill cuts (crore) 9.7, 10.3, 10.1, 11.0, 11.1; like-for-like growth for stores older than 24 months 6.8%, 5.6%, 10.8%, 5.5%, 9.5%; retail business area at quarter end (mn sq ft) 17.9, 18.3, 20.6, 20.7, 21.4; and annualised revenue from sales per retail sq ft ₹8,692, ₹9,290, ₹8,395, ₹8,571, ₹8,741. Footnotes define LFL growth and the 92-day annualisation of revenue per sq ft.
2x2 grid of column charts, each under a navy rounded header bar; light-green bars with the latest quarter (Q2/27) in darker green and a larger bold label; two definition footnotes at the bottom.
Six-period financials in ₹ crore (FY23, FY24, FY25, H1 FY26, FY26, H1 FY27). Revenue from operations: 41,833; 49,533; 57,790; 32,151; 66,968; 37,550 (H1 up about 16.8% year on year). EBITDA and margin: 3,659 (8.7%), 4,099 (8.3%), 4,543 (7.9%), 2,543 (7.9%), 5,255 (7.8%), 2,930 (7.8%). PAT and margin: 2,556 (6.1%), 2,695 (5.4%), 2,927 (5.1%), 1,576 (4.9%), 3,224 (4.8%), 1,739 (4.6%). Net cash flow from operations: 3,113; 3,343; 3,724; 2,021; 4,168; 2,298. Footnotes note half-year data covers six months to 30 September, define EBITDA and net cash flow, and flag the FY23 one-off tax benefit.
2x2 grid of charts under navy header bars: revenue columns, EBITDA columns with a red margin line, PAT columns with a red margin line, and net cash flow columns; the H1/27 bar is dark green with an enlarged label; legends and footnotes under each half.
Working-capital, leverage and return metrics for the same six periods. Days inventory 28.8, 29.2, 31.4, 33.9, 33.2, 36.1 vs days payables 6.3, 7.1, 7.2, 6.8, 7.2, 6.8. Total debt (₹ crore) 439, 464, 693, 1,476, 2,267, 4,079 against equity 16,503, 19,281, 22,230, 23,811, 25,520, 27,290, with debt/equity rising from 0.03 to 0.15. Fixed asset turnover 3.7, 3.6, 3.4, 1.7, 3.2, 1.7 and inventory turnover 14.8, 14.6, 13.6, 6.3, 12.8, 5.9. Return on net worth 16.8%, 15.1%, 14.1%, 6.8%, 13.5%, 6.6% and ROCE 20.1%, 19.1%, 17.8%, 8.8%, 17.1%, 8.1% (half-year figures are not annualised). Footnotes define each ratio and note one-off tax benefits of ₹138.8 crore (FY23) and ₹36 crore (FY25).
2x2 grid under navy header bars: dashed red vs solid green line chart (days inventory/payables), clustered red-green columns with a grey debt/equity line, paired green/red turnover columns, and a dual smoothed-line chart for RoNW and ROCE; dense definition footnotes beneath.
Closing slide with a centred green 'Thank you!' message.
Plain white slide with red corner tabs at top, centred bold green text and the grey 'Corporate Presentation' footer bar.
Bu slayt ve temel sunum içeriği hakkında yaygın sorular.
It is the 12-page investor deck published by Avenue Supermarts Ltd, the company behind the DMart supermarket chain, for the half year ended 30 September 2026 (H1 FY 2027, since India's FY27 runs April 2026 to March 2027). It was filed with the Indian stock exchanges (BSE/NSE) on 10 October 2026 and covers category mix, store expansion, DMart Ready, operating KPIs and financials.
Revenue from operations was ₹37,550 crore (vs ₹32,151 crore in H1 FY26, about +16.8%), EBITDA ₹2,930 crore at a 7.8% margin, PAT ₹1,739 crore at a 4.6% margin and net cash flow from operations ₹2,298 crore. The store count reached 518 after 18 additions in the half, and Q2 FY27 like-for-like growth was 9.5%.
The deck shows 518 stores at H1 2026-27, up from 55 in 2011-12 and 432 a year earlier. Maharashtra (132) and Gujarat (77) are the largest clusters, followed by Karnataka 53, Telangana 48, Andhra Pradesh 47 and Tamil Nadu 36. The count includes the Sanpada store in Navi Mumbai, closed for reconstruction.
Yes. It is the original corporate presentation that Avenue Supermarts filed with BSE and NSE, available from the BSE corporate filings archive. Only the exchange cover letter has been removed; the 12 slides are unchanged and figures stay in the deck's own ₹ crore units.
Yes. You can download the PDF and an editable PPTX version, then reuse the layouts — the cluster-expansion maps, five-quarter KPI grid, combo revenue/EBITDA/PAT charts and ratio dashboards — for your own results or strategy deck.
A clean corporate look built on DMart's brand colours: bold green slide titles, a red corner tab on each content slide, navy rounded chart headers, light-green bars with the latest period in dark green, and red lines for margins. Section dividers use a silver shopping-cart icon, and the cover is a cart full of product-category cubes.
Investors and analysts tracking Indian retail, IR teams preparing half-year or quarterly results, and anyone building a compact retail performance deck. It is a good model for presenting store expansion on maps and summarising retail KPIs like bill cuts, LFL growth and revenue per square foot on one slide.
DMart Ready is DMart's online grocery ordering service. Page 6 maps its footprint: 1 city in 2016-17, 19 cities in H1 2025-26 and 11 large-town cities in H1 2026-27 (including Mumbai MMR, Pune, Ahmedabad, Hyderabad and Bangalore), reflecting a focus on large towns only.

Create Your Own Slides
Turn your ideas into professional presentations in seconds with 2slides AI.
Profesyonel tasarımları referans alın, stilinizi seçin ve mükemmel metin oluşturma ile slaytlar oluşturun. Nano Banana ile desteklenir—şimdi sunumunuzu oluşturmaya başlayın.
Slaytlar için AI Ajanınız. Akıllı sunum oluşturma ile zaman kazanın, daha hızlı parlayın.


© 2026 2slides. Tüm hakları saklıdır.